$BTCUSD Trade Setup – Rejection at Channel Highs or BreakoutBitcoin is approaching a key decision point at the top of its descending channel. After bouncing off $100K support and reclaiming the midline, price is now pressing against the upper trendline near $112K. The MACD has just flipped bullish, and momentum is turning upward. However, BTC has repeatedly failed at this level over the last two months, forming a clear resistance zone.
This trade is structured as a short from resistance with tight invalidation above $112K. The setup offers a favorable risk/reward if this rejection holds and BTC pulls back to the $97K–$98K zone.
Entry: ~$108K
Stop: ~$112K (channel breakout)
Target: ~$97.5K (lower channel support)
If BTC breaks and holds above $112K, that would invalidate the short thesis and likely flip the structure toward a full breakout scenario.
BTCUSD.PM trade ideas

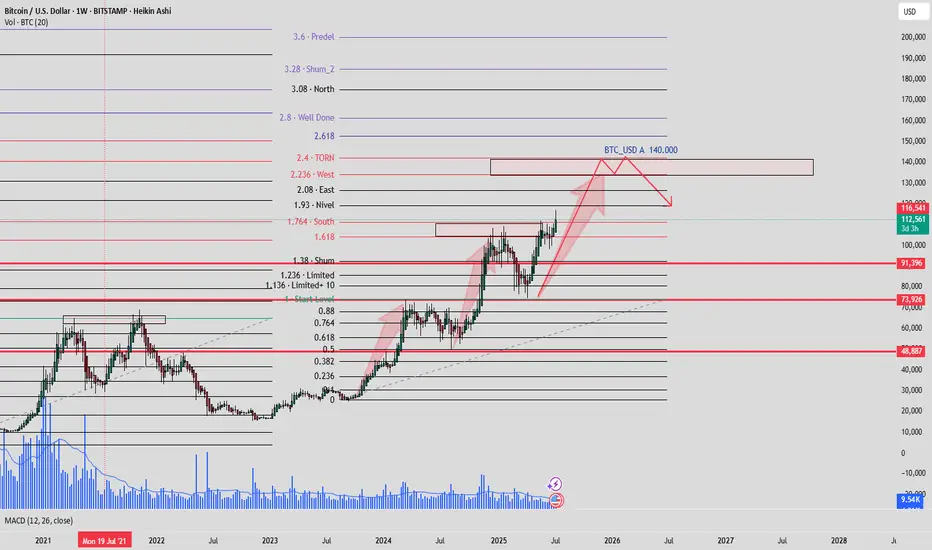
#BTC ALMAZOV PROJECTION#BTCUSD ALMAZOV PROJECTION WEEKLY
Price projection according to Almazov's theory, Bitcoin should at least touch $140,000, before pulling back or continuing to go long if its dimensionality decreases.
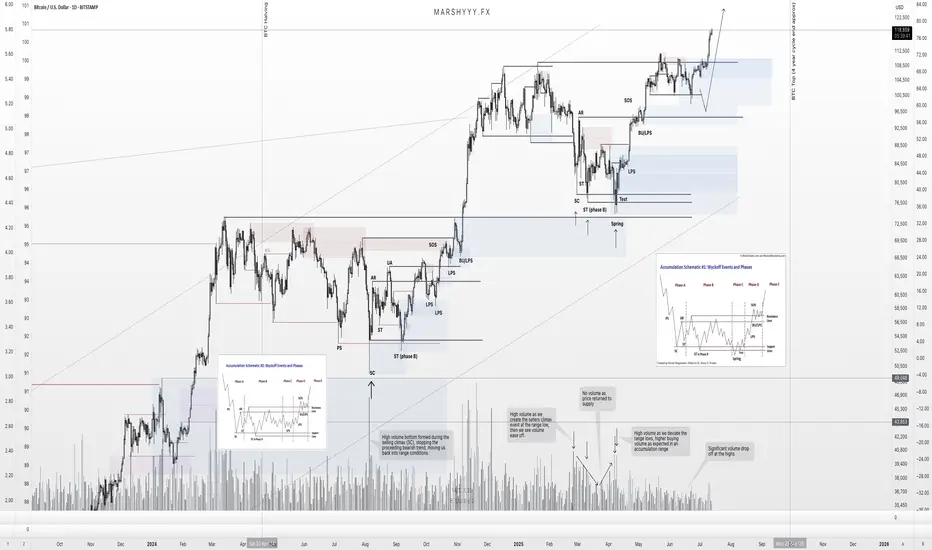
BTC – Textbook Pullback. New ATHs. What’s Next?Back in mid-June, I published a BTC update calling for a local correction into HTF demand while most were screaming bear market and waiting for deeper breakdowns.
Price action played out exactly as forecasted.
BTC swept the $100k swing low, front-ran my first demand zone by $400, and launched into a powerful reversal — just like it did back in April, where it also front-ran the key HTF demand before rallying.
That move took us straight into new all-time highs (ATHs) — now trading comfortably around $118k.
🧠 What Happened?
✅ Liquidity sweep of the prior low
✅ Front-run demand zone (perfect HTF structure)
✅ Strong bullish reaction and higher high
✅ Confluence from USDT.D rejection at 5.25%
✅ Alts showing signs of strength as BTC rallies
The entire setup aligned perfectly across BTC, USDT.D, TOTAL, and OTHERS.D — all of which I’ve been tracking in tandem.
🔮 What Now?
With BTC now in price discovery, I expect continuation higher — but not without the possibility of a short-term pullback.
📉 A potential retest of the $108k zone isn’t off the table. This level aligns with:
- Prior breakout structure
- Range high retest
- Local demand before continuation
But even if we go straight up — I remain HTF bullish into the final phase of this cycle, supported by:
- USDT.D structure still bearish
- BTC.D showing signs of distribution
- ETH.D and OTHERS.D gaining momentum
- Altseason rotation already starting to pick up
🧭 The Macro Outlook
The 4-year cycle projection still points to a Q3 2025 top — likely between August late and September based on historical cycle timing, but this could deviate.
That gives us a window of 2–3 months for this final leg to unfold — and it’s already in motion.
Stay focused. Stick to your plan. Ride the trend, don’t chase it.
Let me know what levels you're watching next, and whether you think we get that $108k retest — or we go vertical from here.
1D:
3D:
4D:
1W:
1M:
— Marshy 🔥
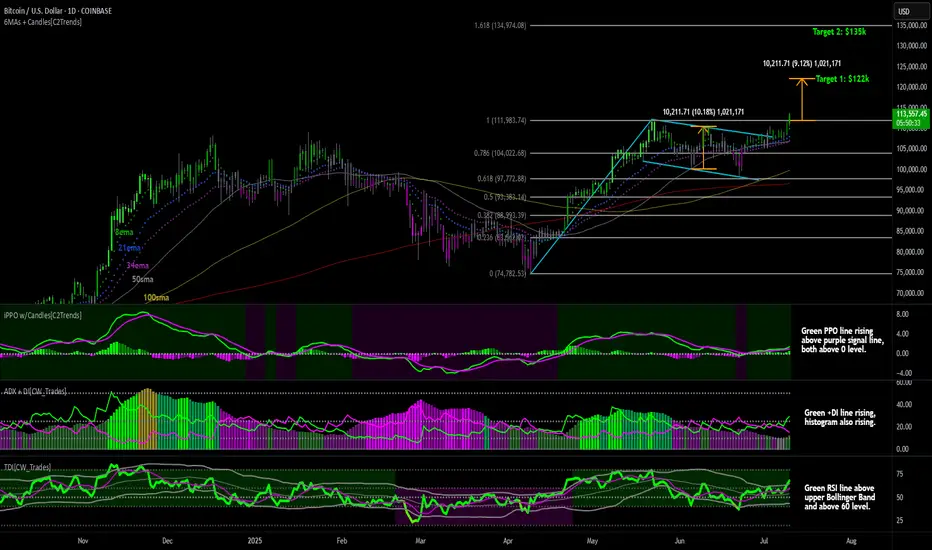
Bitcoin New All-Time HighNew all-time high for Bitcoin above $113k and is now in uncharted territory.
First price target I'm watching from here is $122k which is based on the range that we saw price make in the blue flag pattern that formed during the consolidation phase. I took the price difference between the high and low in the flag and projected it out from the previous resistance level at $112k which gives a target of $122k. Second price level I'm watching is $135k which is the 1.61 fibonacci extension level based on the April low to the recent resistance level at $112k made in May.
Lower price indicators are now all bullish:
The PPO indicator show the green PPO line rising above a rising purple signal line, with both lines having held above the 0 level during consolidation. This indicates intermediate to longterm bullish price momentum.
ADX indicator shows the green +DI line rising above a declining purple -DI line and the histogram bars are rising. This indicates increasing bull trend strength.
The TDI indicators shows the green RSI line above the upper Bollinger Band, and above the horizontal 60 level and is showing bullish trend strength.
New all-time highs generally attract more buyers looking to ride the strength.
Giddy Up.
July 7 Bitcoin Bybit chart analysisHello
This is Bitcoin Guide.
If you "follow"
You can receive real-time movement paths and comment notifications on major sections.
If my analysis was helpful,
Please click the booster button at the bottom.
Here is the Bitcoin 30-minute chart.
There is no separate Nasdaq indicator announcement today.
I think the Nasdaq lower gap section retracement will be the focus.
Recently, sideways movement or adjustments have been coming out before the trend,
So I proceeded safely in preparation for variables.
*When the blue finger moves
Bidirectional neutral
Short->long switching or 2nd section long waiting strategy
1. $109,380 short position entry section / cut-off price when orange resistance line is broken
2. $108,997.8 long position switching / cut-off price when purple support line is broken
3. $109,610.9 long position 1st target -> Top 2nd target -> Good 3rd target
It seems important whether the purple support line is broken from the current position. If the first section at the top touches 108,997.8 dollars and comes down,
it may become a vertical decline section.
If it comes down right away, it is a long-waiting strategy in the final second section,
and if it deviates from the bottom section today
(6+12 pattern)
because it is a full candle when the gap section is touched,
it may fall to 107,484 dollars indicated at the very bottom.
I have important work to do tomorrow,
so I will take a day off and come back on Wednesday.
Please use my analysis so far for reference and
I hope you operate safely with principle trading and stop loss prices.
Thank you.

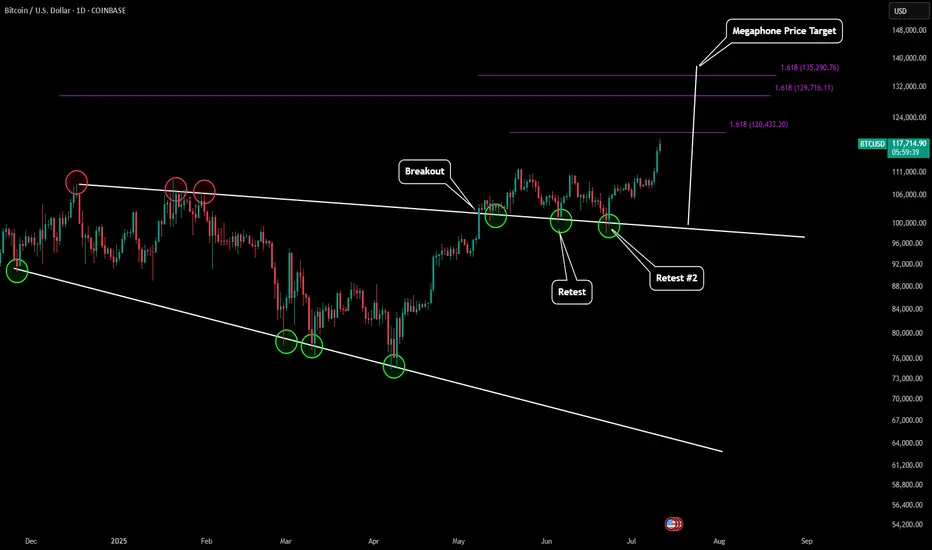
BTC - Next ATH Upside Price Targets After outlining the last low for BTC (which can be found here):
Now BTC is skyrocketing to new all time highs. Based on predictive Fibonacci modeling and also our price target of our macro megaphone pattern we can estimate where BTC's next top might be.
Our first target is just slightly above $120k. This would be our extension target of our most recent LFT trend.
If we take a look back at our last mid-macro trend it would give us an extension target slightly below $130k.
Our final target would be $135-136k which would be from our last high to our last low of our mid-macro trend. This is also in alignment with the full measured move of our megaphone pattern.
As more candle structure form around these levels we will update this prediction with even more precise targets. Happy All Time High everyone!
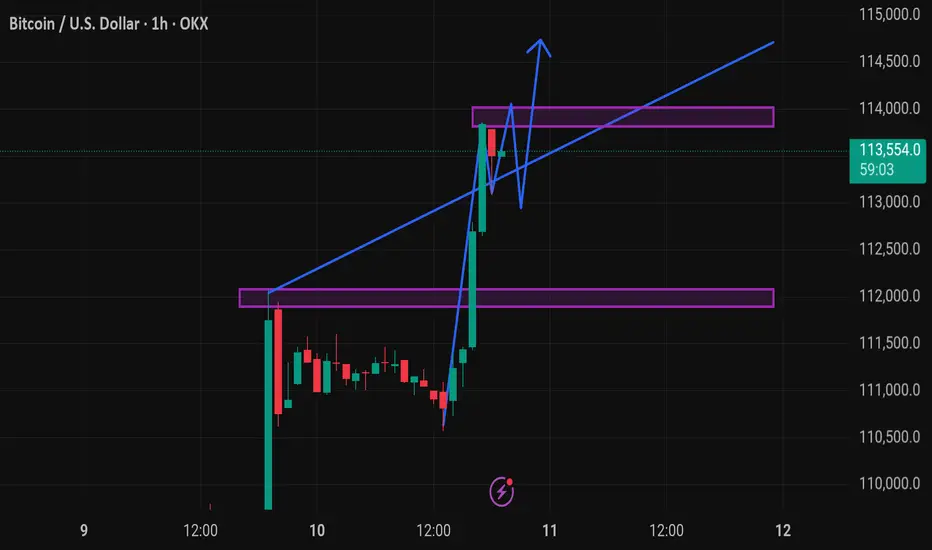
Btcusd techinical analysis.This chart represents the Bitcoin (BTC) / USD price action on a 1-hour timeframe, with technical analysis indicators suggesting a bullish outlook.
Key Elements in the Chart:
1. Current Price:
BTC is trading at $113,506.5, up +1.98% on the 1-hour chart.
2. Support and Resistance Zones:
Support Zone (purple box around ~$112,000): Recently tested and held, now acting as a potential base.
Resistance Zone (purple box around ~$113,800 to ~$114,000): Price is currently consolidating just below this zone.
3. Trendline:
A rising blue trendline is acting as dynamic support, showing upward momentum.
4. Projected Price Action (Blue Arrow Path):
The blue path suggests a potential bullish breakout from the resistance zone.
Implies consolidation, retest of support/trendline, and continuation upward—a common bullish flag or pennant pattern.
---
Interpretation:
The chart setup is bullish, expecting:
Retest of support near $113,200–$113,400
Break above the $114,000 resistance
Potential rally continuation beyond $114,000 (toward $115,000 or more)
Caution:
If BTC fails to hold the trendline or drops below the support zone (~$112,000), this bullish setup may be invalidated.
Would you like a trading strategy (e.g., entry/exit levels or risk management) based on this setup?
BITCOIN Epic Breakout! Buy!
Hello,Traders!
BITCOIN is trading in an
Uptrend and the coin made
An epic bullish breakout
Of an ATH level of 112k$
Which reinforces our bullish
Bias and we will be expecting
A further bullish move up
Buy!
Comment and subscribe to help us grow!
Check out other forecasts below too!
Disclosure: I am part of Trade Nation's Influencer program and receive a monthly fee for using their TradingView charts in my analysis.

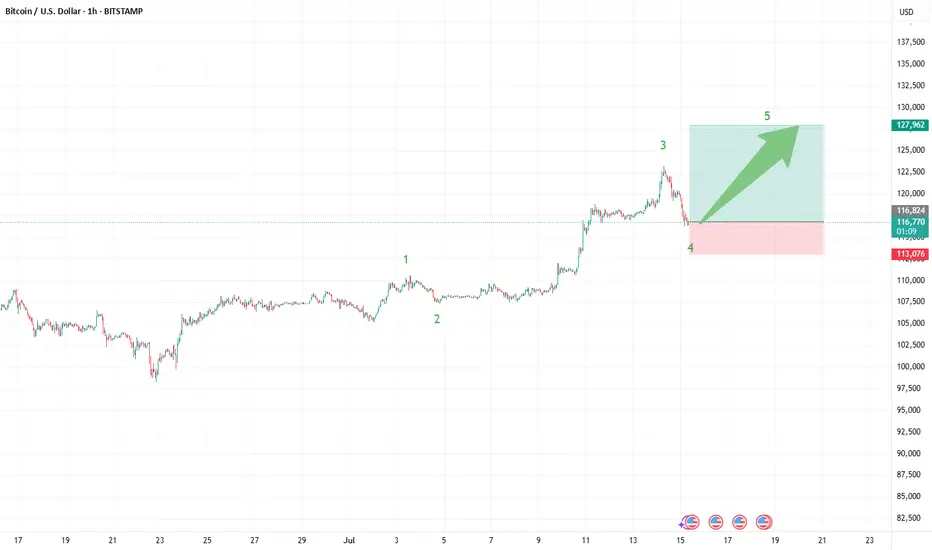
Bitcoin (BTCUSDT): Trade Wave 5—Next Stop $127,000?Bitcoin’s current structure is lining up for a classic Elliott Wave fifth wave scenario, and the setup could offer a high-reward trade as we look for a measured push toward the $127,000 area. Here’s what’s standing out in the recent price action:
What the Current Structure Shows (Primary Scenario)
Wave 4 Correction Complete: After peaking in wave iii near $124,000, BTC pulled back and has potentially completed a wave iv correction. Price respected the Fibonacci retracement zones bouncing near the 38.2% retracement at $117,116.
Preparing for Wave 5: With support confirmed, price action is stabilizing and looks primed for a final motive push—wave 5—to the upside. The target projection for wave 5 is around $127,000, in line with both the 61.8% extension of the previous swing and the common equality projection for wave 5 vs. wave 1 when wave 3 is extended.
Why the Count Is Labeled This Way
The advance from early July kicked off with impulsive movement, subdividing cleanly into smaller waves that align with classic Elliott structure.
Wave iii is the clear standout—steep, extended, and carrying most of the move’s energy, which checks the box for a strong third wave.
The cluster of Fibonacci and previous resistance/support near $127,000 offers strong technical confluence for the next objective.
Trade Setup: Riding Wave 5 to $127,000
Entry Zone: Consider longs on breakouts above the current consolidation, ideally after confirmation of support holding near $117,100–$116,000.
Stop Loss: Place stops just below $113,300 (the 61.8% retracement), or tighter for risk management depending on your position size and timeframe.
Target: $127,000—where wave 5 projects to equal the length of wave 1 and aligns with multiple Fibonacci targets.
What to Watch Next (Confirmation or Invalidation)
Confirmation: An impulsive move above the interim high at $120,000–$121,000 with strong volume would confirm wave 5 is underway and that bulls have regained control.
Invalidation: A break below $110,500 would invalidate this setup and suggest a more complex correction is taking shape.
Final Steps: Monitor for impulsive character in the rally—wave 5s can sometimes truncate, so don’t get complacent at resistance.
Alternate Count
If price fails to hold support and breaks down, BTC could still be in an extended or complex fourth-wave correction—possibly a running flat or triangle—before wave 5 eventually resumes.
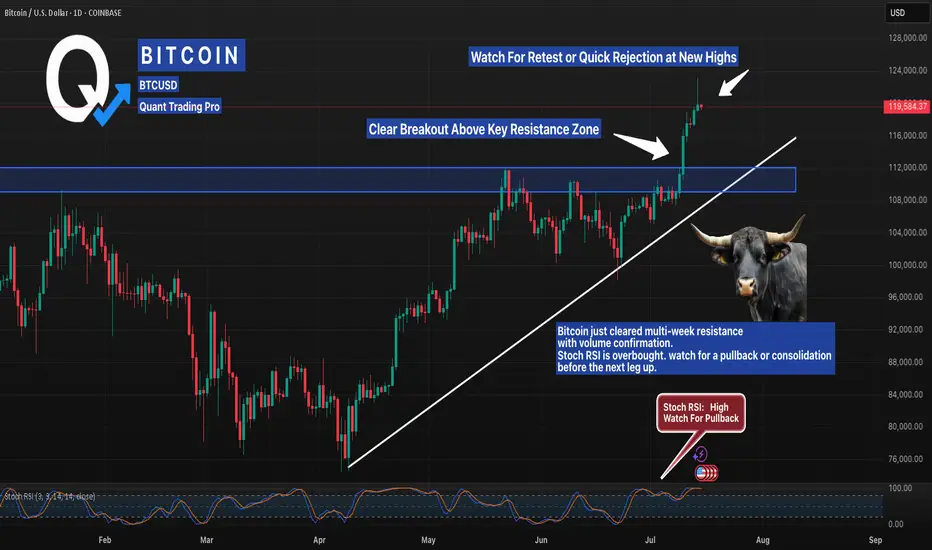
Bitcoin Just Shattered Resistance — Is a Pullback Coming Next? Bitcoin has exploded past a multi-month resistance zone with authority, confirming a breakout that’s been building for weeks. This move aligns perfectly with the rising trendline, signaling strong bullish structure. But here’s the catch — the Stochastic RSI is flashing overbought levels, a classic sign that momentum could be topping out short-term.
Smart traders are now watching two key scenarios: either we see a healthy pullback into the breakout zone (around $112K) for a textbook retest, or bulls keep control and push price into parabolic territory. If this level holds as new support, it could become the launchpad for the next major leg up.
Breakout traders, backtest your pullback strategies and manage risk — the next move could define the rest of the month.
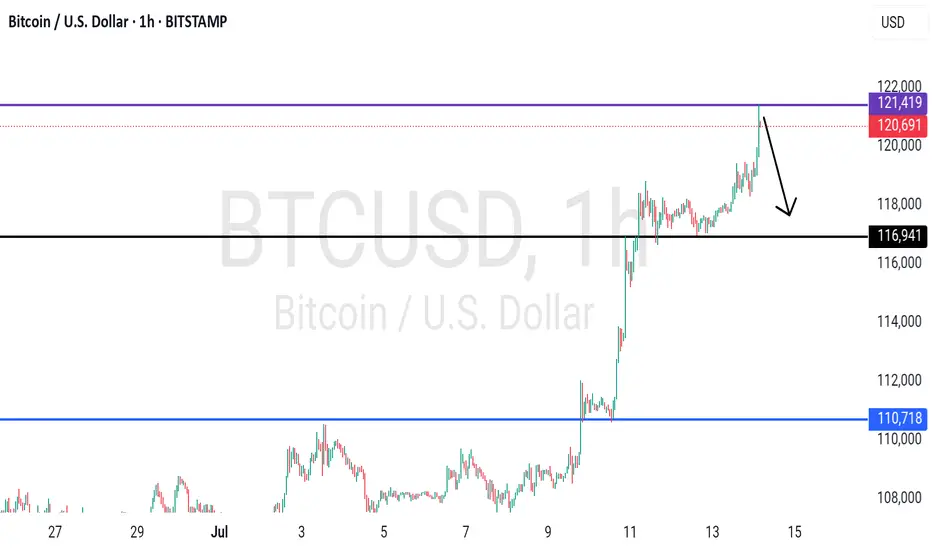
BTCUSDT - high placed? What's next??#BTCUSDT.. .A very reasonable high are placed so far.
That is around 120-121k
I'd market hold it in that case drop expected.
Good luck
Trade wisely

BTC bullish scenario - short term bearishMapping out BTC sideways consolidation that could wreak havoc on ALTS.
Looking at the daily chart, this consolidation is still bullish as BTC price action is still likely respecting this ascending channel.
However, each move down on BTC could mean a significant dump on alt coins.
IMO, based on how the chart looks, BTC price still needs to come and test the bottom and coincidentally there is a huge FVG left when BTC rose impulsively. In all likelihood, I am expecting at the very least for a quick wick down to fill the gap before BTC can then start some bullish price action.

BTCUSD: Next Move Is Down! Short!
My dear friends,
Today we will analyse BTCUSD together☺️
The recent price action suggests a shift in mid-term momentum. A break below the current local range around 118.878 will confirm the new direction downwards with the target being the next key level of 118.470.and a reconvened placement of a stop-loss beyond the range.
❤️Sending you lots of Love and Hugs❤️

Bitcoin Long: Expects New High; Target 124,632Over in this video, I update on the Elliott Wave counts for Bitcoin and explain why I think that Bitcoin is going higher for a wave 5 of 3 of 5.
The stop loss will be below the wave 4 and given some leeway, will be around 115,900. There are 2 Take profit targets:
1. 119,251, and
2. 124,632
I made it known that my personal preference is $124,632 but note that once a new high is made, this wave counts will already be validated even if it then drops to our stop.
I talk about the possibility of trailing the stop once a new high is reached but commented that every trader must trade based on their own style and risk preference.
Finally, Good luck in your trading!

BTC/USD 1H chart short-term🔻 Trend:
• Currently visible inheritance channel - confirmed by the yellow inheritance trend (decreasing peaks).
• The price tests resistance in the area 117.564 - possible to break out, but requires confirmation of the volume.
⸻
📊 levels of support and resistance:
• resistance:
• 117,564 (here we are now - resistance test)
• 117,939
• 118,206 (key level - potential breaking from the channel)
• Support:
• 117,205 - a recent hole, valid short -term
• 116,905
• 116,680 - deeper support, possible target with further decline
⸻
📉 Macd:
• The histogram begins to decrease, but the MacD line and the signal line still below zero → still weakness.
• Possibility to build a base for reversing the trend, but there is no clear signal intersection.
⸻
📉 RSI (Relative Strength Index):
• RSI below 50, but it starts to reflect slightly.
• MA RSI is still falling → no strong growth dynamics.
⸻
🔍 Applications:
• The downward trend still dominates, but the price is trying to pierce local resistance (117.564).
• If it breaks above 117,939–118,206 and persists, a possible change in the direction at a short interval.
• If he rejects the resistance - a quick descend to 117.205 or lower (116,900-116,680).
⸻
⚠️ Signals for observation:
• Closing the candle 1h above 118.206 - Bullly Breakout.
• Rejection of level 117.564 and descent below 117,200 - confirmation of further decline.
• MacD and RSI - 50 - potential change of direction.

BITCOIN ABOUT TO BLOW UP OR TOP NEAR? Read my thoughts below Definitely Bitcoin looks strong compared to the rest of the crypto market.
we have been consolidating on top of the previous all time highs, and that is bullish, now price has broken out from its resistance and strong support remains around 108K area.
If momentum continues, 120K could be strong target, and if broken 135K is next by end of July.
BUT... Predictions is only in our minds, we need to look at Daily, Weekly and Monthly open and closes to determine bullishness or either momentum to the Upside, Distribution or Downside.
The fact that Bitcoin is making new ATH and the media is silent is a good thing.. But right now is trying to break the long top trendline that goes from 2017 top.
To me distribution and consolidation before the last leg makes sense. but nothing really does, markets can remain unpredictable and crazy more than you stay solvent. So if you are trading the move, use stop loss depending on your time horizon and timeframe.. AND DONT TRY TO PREDICT TOPS unless you are going for quick scalps or you might burn your money away.
Bitcoin H1 | Bullish uptrend to extend higher?Bitcoin (BTC/USD) could fall towards a pullback support and potentially bounce off this level to climb higher.
Buy entry is at 116,469.00 which is a pullback support.
Stop loss is at 115,000.00 which is a level that lies underneath a swing-low support and the 23.6% Fibonacci retracement.
Take profit is at 119,095.85 which is a resistance that aligns with the 61.8% Fibonacci projection.
High Risk Investment Warning
Trading Forex/CFDs on margin carries a high level of risk and may not be suitable for all investors. Leverage can work against you.
Stratos Markets Limited (tradu.com ):
CFDs are complex instruments and come with a high risk of losing money rapidly due to leverage. 63% of retail investor accounts lose money when trading CFDs with this provider. You should consider whether you understand how CFDs work and whether you can afford to take the high risk of losing your money.
Stratos Europe Ltd (tradu.com ):
CFDs are complex instruments and come with a high risk of losing money rapidly due to leverage. 63% of retail investor accounts lose money when trading CFDs with this provider. You should consider whether you understand how CFDs work and whether you can afford to take the high risk of losing your money.
Stratos Global LLC (tradu.com ):
Losses can exceed deposits.
Please be advised that the information presented on TradingView is provided to Tradu (‘Company’, ‘we’) by a third-party provider (‘TFA Global Pte Ltd’). Please be reminded that you are solely responsible for the trading decisions on your account. There is a very high degree of risk involved in trading. Any information and/or content is intended entirely for research, educational and informational purposes only and does not constitute investment or consultation advice or investment strategy. The information is not tailored to the investment needs of any specific person and therefore does not involve a consideration of any of the investment objectives, financial situation or needs of any viewer that may receive it. Kindly also note that past performance is not a reliable indicator of future results. Actual results may differ materially from those anticipated in forward-looking or past performance statements. We assume no liability as to the accuracy or completeness of any of the information and/or content provided herein and the Company cannot be held responsible for any omission, mistake nor for any loss or damage including without limitation to any loss of profit which may arise from reliance on any information supplied by TFA Global Pte Ltd.
The speaker(s) is neither an employee, agent nor representative of Tradu and is therefore acting independently. The opinions given are their own, constitute general market commentary, and do not constitute the opinion or advice of Tradu or any form of personal or investment advice. Tradu neither endorses nor guarantees offerings of third-party speakers, nor is Tradu responsible for the content, veracity or opinions of third-party speakers, presenters or participants.

BTC is on track!This is what four month for Bitcoin can look like and you really think 230k in October 2025 is far-fetched?? You better rethink that.

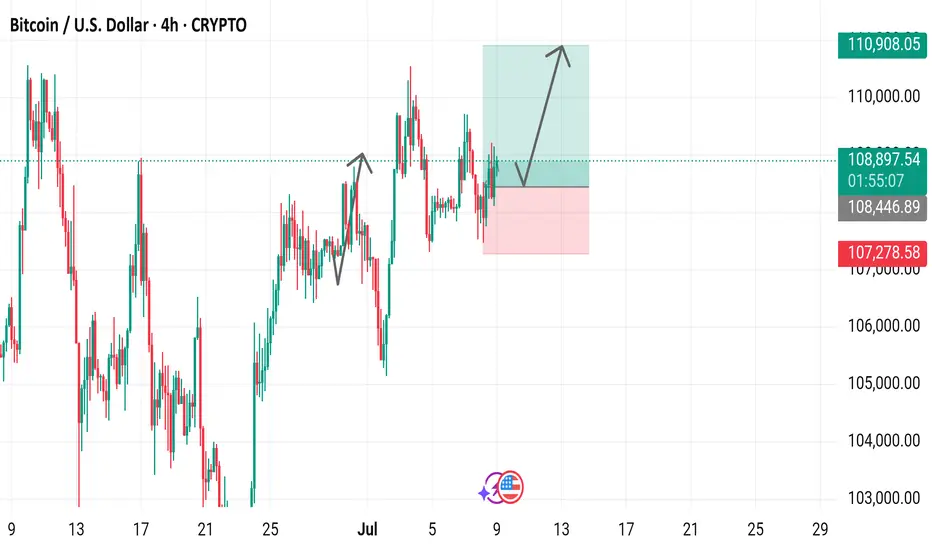
Bitcoin / U.S. Dollar 4-Hour Chart (BTCUSD)4-hour candlestick chart displays the price movement of Bitcoin (BTC) against the U.S. Dollar (USD) from late June to early July 2025. The current price is $108,895.04, with a 24-hour change of +$619.70 (+0.57%). Key levels include a support zone around $107,278.58 and a resistance near $110,908.05. The chart highlights recent price action, including a potential upward trend indicated by a green shaded area, with buy and sell signals marked at $108,895.04.
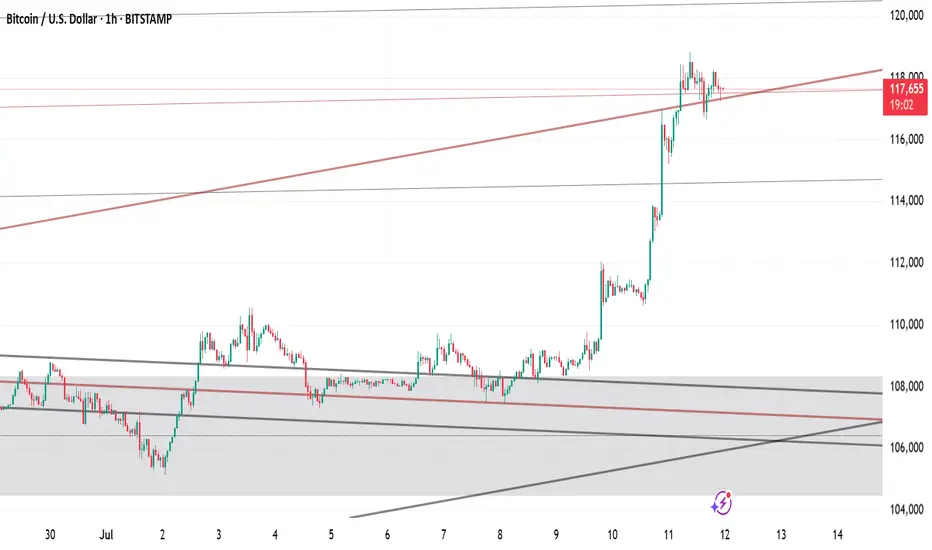
BTC/USD Today: Momentum Builds Toward the Next BreakoutBITSTAMP:BTCUSD Today: Momentum Builds Toward the Next Breakout
Previously on BTC...
1. Double Top Pattern and Target Hit
The chart shows a classic double top (early 2025), a bearish reversal pattern. Once the neckline broke, the price plunged and nailed the technical target (red arrow)—as if Bitcoin had read the textbook.
2. Trendline Break = Game Changer
After bottoming out, BTC broke through a downward sloping trendline, triggering a strong bullish move. This breakout signaled a trend reversal, and the market responded accordingly.
3. Perfect Pullback
Once the breakout played out, the price retraced back to previous resistance, now turned support. This “perfect pullback” is the kind of thing that makes technical analysts smile in their sleep.
4. Bull Trend Confirmation
The successful retest of support confirmed that Bitcoin had shifted from neutral/bearish into a full-on bull trend. Buyers stepped back in with confidence.
📊 BTC/USD – Current Outlook
Bull Flag Forming
Currently, price action is consolidating into a bull flag, a continuation pattern often seen mid-rally. If it breaks out to the upside, the projected target sits near $120,000 .
🚀 Bullish Catalysts:
- Strong structural trend: Higher highs and higher lows are still intact.
- Post-halving momentum: Historically, Bitcoin tends to go beast mode 6–12 months after each halving—and we’re right in that sweet spot.
- ETF inflows : Institutional capital continues pouring into Bitcoin ETFs, adding steady buying pressure.
- Supply crunch: With more BTC leaving exchanges, sell-side liquidity is drying up. Hodlers are hodling.
- Technical setup: A confirmed breakout from the bull flag could trigger a powerful leg higher.
⚠️ Risks and Levels to Watch:
A breakdown of the bull flag could send BTC back toward the $98k–91k range.
Macro headwinds (rate hikes, economic slowdown, dollar strength) could still rain on crypto’s parade.
🧠 Conclusion
This chart paints a textbook bullish setup for Bitcoin. The double top is in the rearview mirror, the trendline breakout gave us the green light, and now the bull flag is loading the next move.
If the breakout happens, the next destination could be $120,000.
It’s one of those “don’t blink” moments—BTC might just be stretching before its next sprint.

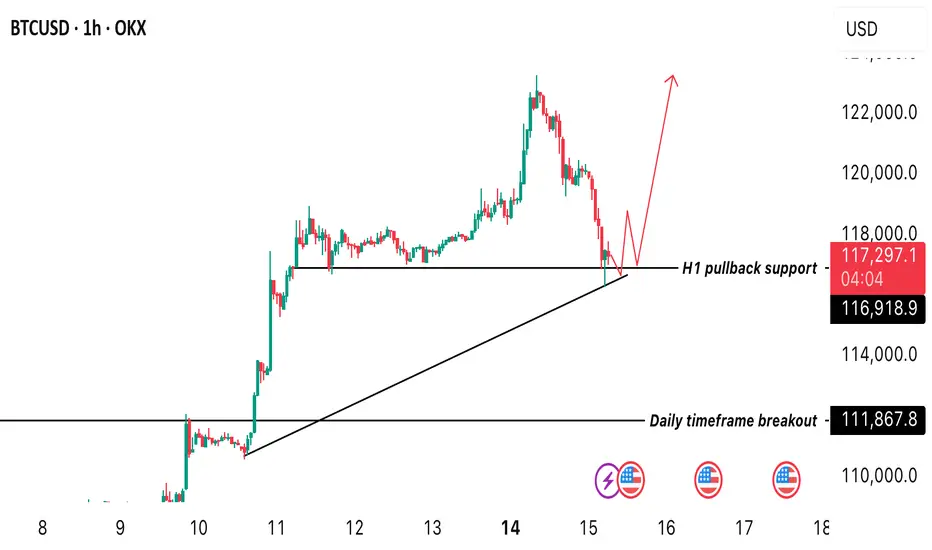
BTC at pullback support in H1 timeframe! Possible rebound?BTC reacted a pullback support of 117,140 this is a crucial point where we look forward to seeing a rebound. We anticipate a bullish rally from this week. Keep an eye at this level as the week progresses. A rebound indicates possible gains. A break below might take us back to 110k level.
Bitcoin still a long: Target remains at $124,632This is an update to the wave counts for Bitcoin. We are in the final wave 5 of 5 of 3 and the target remains at around $124,632.
The stop can be adjusted to around $120,433, below the wave 2 of 5 of 3.
