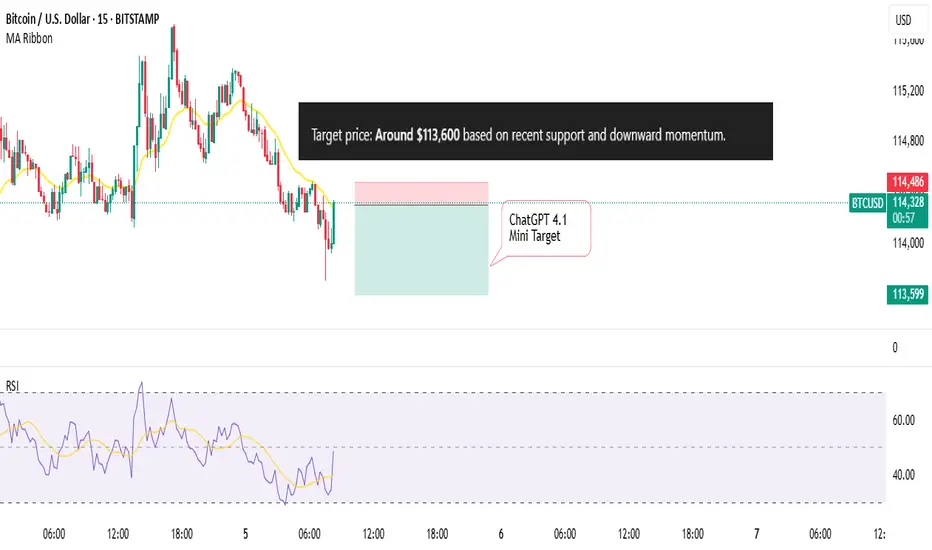
I asked ChatGPT to predict Bitcoin PriceAlso, I asked Grok to choose 2 indicators and then predict the next Move of
BITSTAMP:BTCUSD
We'll check back soon
BTCUSD trade ideas
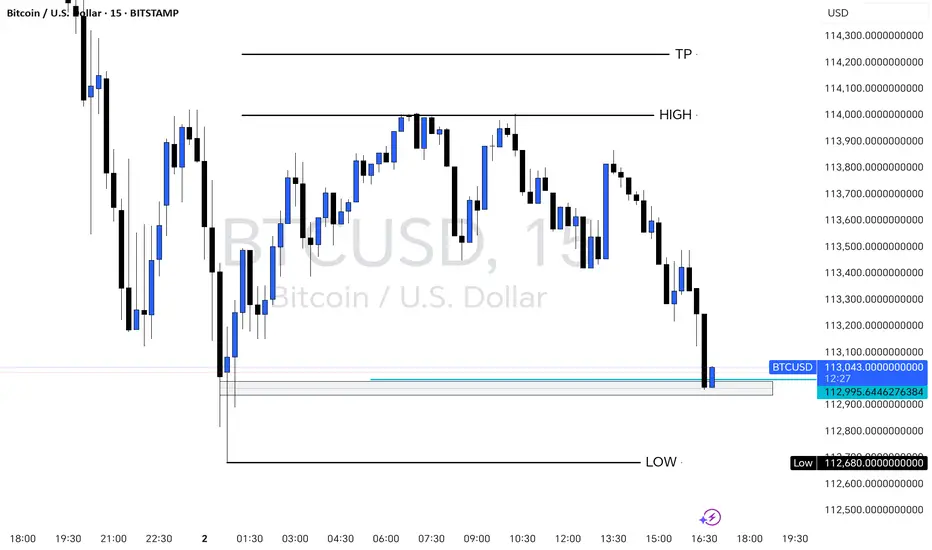
BITCOIN 15-Min Chart – Key Support Retest with Bullish PotentialThis 15-minute BTCUSD chart shows Bitcoin retesting a strong support zone near $112,680 after a clear downward move. The price is currently reacting at a previous demand area, marked in blue, just above the session’s LOW. A possible bullish reversal setup is forming if the support holds, targeting the previous HIGH around $114,000 and a potential TP at $114,200. Traders may look for confirmation signals (e.g., bullish engulfing, order block reaction) before entering long positions.

BITCOIN's Situation (1h) !!!The price is within an ascending triangle, which could be encouraging. However, since crypto doesn't always follow patterns, it might break down from below and correct to around $116K!
Best regards CobraVanguard.💚

1h out look Btc chart Bitcoin appears to be completing its Wave (4) correction around the 0.382 Fibonacci level near 116,359. As per Elliott Wave structure, a potential Wave (5) extension is anticipated with key Fibonacci targets at 119,908 (0.618), 122,107 (1.0), and 125,664 (1.618). Price action confirmation above the current structure may trigger the next bullish leg.

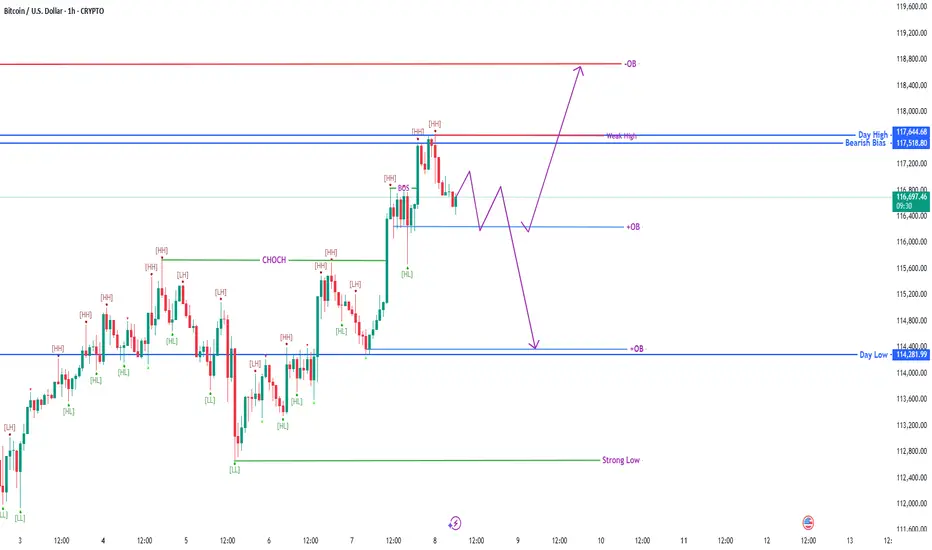
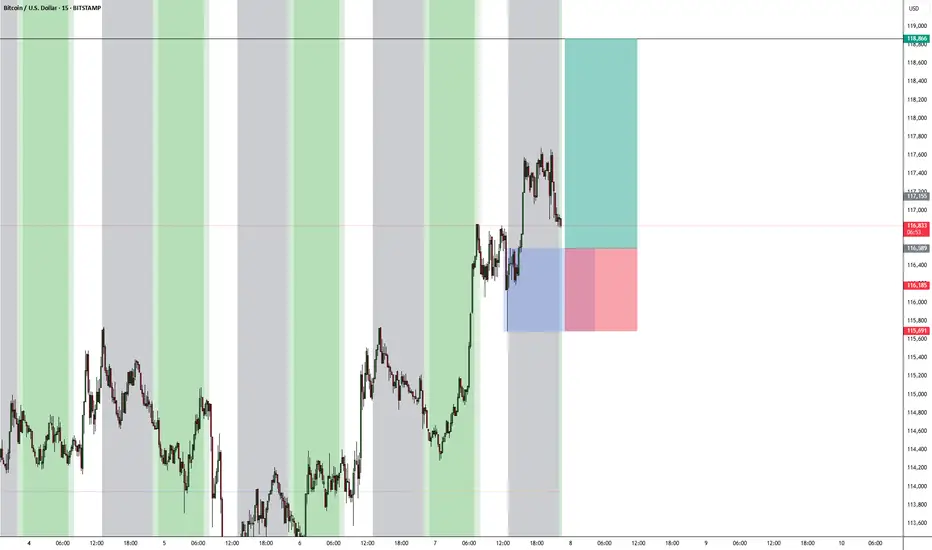
BTC/USD 1H – Weak High in Play | OB Reaction Zones AheadPrice is currently consolidating below Weak High and just above the mid OB zone.
Two key scenarios in play:
1️⃣ Pullback into OB → Bullish breakout toward upper OB around 118.8k.
2️⃣ Failure to hold OB → Bearish move targeting lower OB near 114.2k.
🔹 Structure shows HH, HL with BOS confirming bullish control, but liquidity sweeps remain possible.
🔹 Watch OB reactions for clean entry triggers.
Trade with me - my simple short term trading strategy - on BTCThis is a walk through of how I prepare and execute on one of my shorter-term and more simple trading strategies.
Unfortunately it's a longer video than I had hoped but feel free to watch sped up and skip around - most of the action happens towards the end but I offer a lot of great insights throughout for those with the time and patience to watch through.
Happy Trading :)

How to Analyze BTC/USD on TradingViewTradingView provides a variety of built-in tools and indicators that can help us analyze crypto markets more effectively. Once connected with Alpaca, these tools become part of a seamless workflow for charting and order execution.
Please note we are using BTC/USD as an example and it should not be considered investment advice.
How to connect Alpaca to TradingView account
To begin, link your Alpaca trading account with your TradingView account. You can follow the tutorial below by connecting your Alpaca account to your TradingView account. If you don’t have an Alpaca account but have a TradingView account, you can sign up for an Alpaca account.
Using Trendlines for Bitcoin Analysis
A trendline helps visualize the general direction of price movement. It’s commonly used to identify support and resistance zones in both uptrends and downtrends. The chart below displays BTC/USD price action on a daily timeframe. Two parallel trendlines define a descending price channel, capturing a series of lower highs and lower lows over an extended period. Descending channels like this are commonly used to monitor trend continuation or assess potential breakout scenarios.
Please note that this screenshot is for hypothetical and illustrative purposes only. Past results do not guarantee future returns, and actual results may vary from the analysis.
Bitcoin Analysis with Fibonacci Retracement
Fibonacci retracement is a technical tool used to identify potential support or resistance levels during pullbacks in a trending market. It’s drawn between a recent high and low, marking key levels like 38.2%, 50%, and 61.8% where price may temporarily reverse.
Please note that this screenshot is for hypothetical and illustrative purposes only. Past results do not guarantee future returns, and actual results may vary from the analysis.
Trend-based Fibonacci Extension for BTC/USD
Trend-based Fibonacci Expansion is a tool that projects how far a bullish or bearish trend may extend using Fibonacci ratios. By anchoring to key price points—such as the trend’s start, its initial move, and the corrective leg—it helps estimate future target levels. Traders may use long-term moving averages, like the 35, 50, or 200-period SMA, to validate the broader trend before applying this tool. Common Fibonacci extension levels include 1.0 as a conservative target and 1.618 as a widely used sweet spot for trend continuation.
Please note that this screenshot is for hypothetical and illustrative purposes only. Past results do not guarantee future returns, and actual results may vary from the analysis.
Conclusion
Trading BTC/USD is a popular starting point in cryptocurrency trading due to its liquidity, USD pricing, and readily available analysis tools. Traders may possibly employ various strategies, including day trading, swing trading, and long-term investment, depending on their risk tolerance and time commitment. Platforms like TradingView, integrated with Alpaca, offer robust charting and execution capabilities for both manual and algorithmic trading. Alpaca's Trading API further enables developers to automate strategies, such as bull call spreads.
However, it's crucial to remember that all trading involves risk, and cryptocurrency markets are particularly volatile. Effective risk management, a clear trading plan, and staying informed are essential.
We hope you've found this tutorial on how to trade “BTC/USD” in real-time with Alpaca’s Trading API, dashboard, or TradingView integration insightful and useful for getting started on your own strategy. As we put these concepts into practice, feel free to share your feedback and experiences on our forum, Slack community, or subreddit! And don’t forget to check out the rest of our crypto-trading tutorials.
For those looking to integrate crypto trading with Alpaca’s Trading API, you can find some additional resources on our Profile page.
=====================================================================
Disclosure
Alpaca and TradingView are not affiliated and neither are responsible for the liabilities of the other.
Please note that this article is for general informational purposes only and is believed to be accurate as of the posting date but may be subject to change. The examples above are for illustrative purposes only.
Please note that this article is for general informational purposes only and is believed to be accurate as of the posting date, but may be subject to change. The examples above are for illustrative purposes only. All examples are for illustrative purposes only.
Alpaca does not prepare, edit, or endorse Third Party Content. Alpaca does not guarantee the accuracy, timeliness, completeness or usefulness of Third Party Content, and is not responsible or liable for any content, advertising, products, or other materials on or available from third party sites.
All investments involve risk, and the past performance of a security, or financial product does not guarantee future results or returns. There is no guarantee that any investment strategy will achieve its objectives. Please note that diversification does not ensure a profit, or protect against loss. There is always the potential of losing money when you invest in securities, or other financial products. Investors should consider their investment objectives and risks carefully before investing.
Cryptocurrency is highly speculative in nature, involves a high degree of risks, such as volatile market price swings, market manipulation, flash crashes, and cybersecurity risks. Cryptocurrency regulations are continuously evolving, and it is your responsibility to understand and abide by them. Cryptocurrency trading can lead to large, immediate and permanent loss of financial value. You should have appropriate knowledge and experience before engaging in cryptocurrency trading. For additional information, please click here: files.alpaca.markets .
The Paper Trading API is offered by AlpacaDB, Inc. and does not require real money or permit a user to transact in real securities in the market. Providing use of the Paper Trading API is not an offer or solicitation to buy or sell securities, securities derivative or futures products of any kind, or any type of trading or investment advice, recommendation or strategy, given or in any manner endorsed by AlpacaDB, Inc. or any AlpacaDB, Inc. affiliate and the information made available through the Paper Trading API is not an offer or solicitation of any kind in any jurisdiction where AlpacaDB, Inc. or any AlpacaDB, Inc. affiliate (collectively, “Alpaca”) is not authorized to do business.
Securities brokerage services are provided by Alpaca Securities LLC ("Alpaca Securities"), member FINRA/SIPC, a wholly-owned subsidiary of AlpacaDB, Inc. Technology and services are offered by AlpacaDB, Inc.
Cryptocurrency services are made available by Alpaca Crypto LLC ("Alpaca Crypto"), a FinCEN registered money services business (NMLS # 2160858), and a wholly-owned subsidiary of AlpacaDB, Inc. Alpaca Crypto is not a member of SIPC or FINRA/ . Cryptocurrencies are not stocks and your cryptocurrency investments are not protected by either FDIC or SIPC. Please see the Alpaca Disclosure Library for more information.
This is not an offer, solicitation of an offer, or advice to buy or sell securities or cryptocurrencies or open a brokerage account or cryptocurrency account in any jurisdiction where Alpaca Securities or Alpaca Crypto, respectively, are not registered or licensed, as applicable.
Alpaca is not affiliated with this third-party website, which is not actively monitored by us. We do not review or update content here regularly and are not responsible for user comments or third-party content. For full disclosures, visit: alpaca.markets
Asking Deepseek to Predict BTC priceI asked Grok to choose 2 indicators and then predict the next Move of
BITSTAMP:BTCUSD
We'll check back soon

BTCUSD Will Explode! BUY!
My dear followers,
I analysed this chart on BTCUSD and concluded the following:
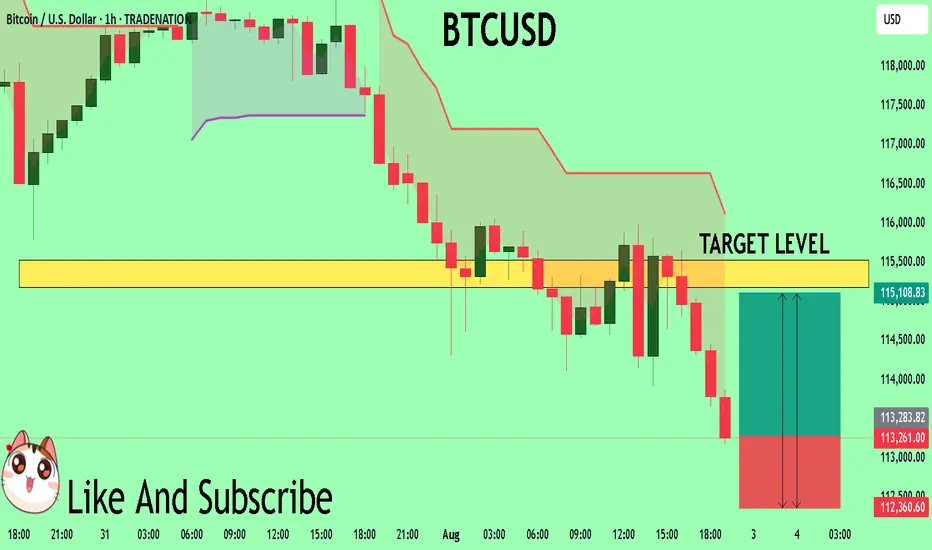
The market is trading on 11326 pivot level.
Bias - Bullish
Technical Indicators: Both Super Trend & Pivot HL indicate a highly probable Bullish continuation.
Target - 11517
Safe Stop Loss - 11236
About Used Indicators:
A super-trend indicator is plotted on either above or below the closing price to signal a buy or sell. The indicator changes color, based on whether or not you should be buying. If the super-trend indicator moves below the closing price, the indicator turns green, and it signals an entry point or points to buy.
Disclosure: I am part of Trade Nation's Influencer program and receive a monthly fee for using their TradingView charts in my analysis.
———————————
WISH YOU ALL LUCK
sell pullback wave 4🌀 Elliott Wave Analysis Overview
The chart shows a completed major Wave (3), followed by an ongoing correction forming Wave (4).
Inside Wave (5), there is a clear 5-wave impulsive structure (labeled 1 to 5 in red).
After the peak at subwave 5, the market entered an ABC correction (labeled A, B, C in red):
Wave A marked the initial drop,
Wave B a brief retracement,
Wave C is currently developing and may still continue.
📉 Rising Wedge & Breakdown
A rising wedge pattern formed and broke to the downside — typically a bearish signal.
Current price (around $113,813) sits below the resistance zone at $115,000–$120,000.
If the correction deepens, major support lies at:
$102,548 (key support level),
$100,000 (psychological level),
And deeper Fibonacci projections (2.618 to 4.886 extension) between $89,000 to $83,000 — potential completion zone for Wave C.
🚀 Next Move Expectation
If Wave C is complete, BTC could launch into the next impulsive Wave 3 of a larger cycle, targeting:
$120,000
$123,879
Or possibly higher as Wave (5) unfolds.
🔍 Summary
This chart suggests Bitcoin is at a critical turning point:
Either it bounces from current support to start a new impulsive move up (Wave 5), or the correction extends deeper into the Fibonacci zone before a real bullish continuation.

Btc / UsdtBITSTAMP:BTCUSD
"Bitcoin cleaned out the downside. Now all eyes on the untouched upside. Liquidity is a magnet — and BTC follows it."
Disclaimer : Not financial Advice

BTCUSD looking to SellI'm expecting BTC USD to enter into the break of structure and retest zone that is in f4HRS and and then push down from there with a 1:4RR hitting the next point of interest / area of interest

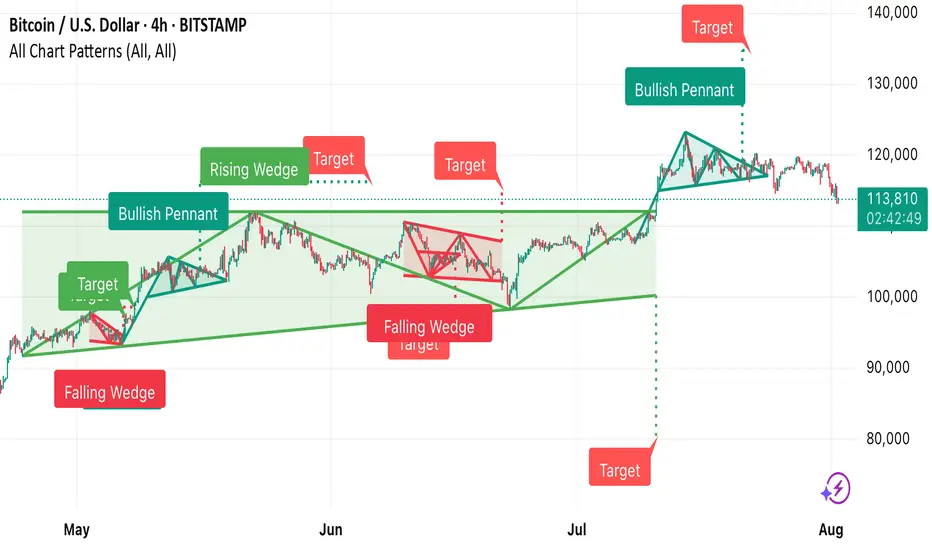
This Bitcoin 4-hour chart from TradingView shows multiple techni • Falling Wedge (early May) → Bullish breakout, target achieved.
• Bullish Pennant → Strong upward continuation.
• Rising Wedge (June) → Bearish breakdown, target met.
• Falling Wedge (mid-June) → Bullish breakout, target achieved.
• Bullish Pennant (late July) → Upward move toward the 140,000 target zone.
Currently, BTC is trading around 113,829, below recent highs, and near the dotted horizontal support zone from the last breakout.
BTCUSD – Bullish Recovery Setup Forming Near Trendline Support🧠 Market Structure & Technical Breakdown
The BTCUSD 4H chart showcases a well-formed descending triangle or falling wedge structure with clearly respected major and minor descending trendlines. Currently, price action is testing a dynamic support zone, highlighted in green, which has been a strong reaction area in the past.
This area aligns with a bullish accumulation zone, from which buyers have previously stepped in to initiate impulsive moves. Given the confluence of diagonal support and horizontal price reactions, we may be on the verge of a bullish breakout opportunity.
📍 Key Zones & Trendlines
✅ Green Support Channel (Demand Zone): Acting as a key pivot for multiple recent rejections, this area (~114,000–113,000) is now being revisited again, offering potential buy interest.
📉 Minor Trendline: A short-term descending resistance around 120,000—likely the first barrier in case of a bounce.
📉 Major Trendline: A more extended dynamic resistance line connecting swing highs, currently intersecting near the 124,000 region.
🔄 Potential Price Scenarios
Primary Bullish Setup (MMC Plan):
Price bounces off the green demand zone.
Breaks above the minor trendline (~120K).
Pullback retest to confirm breakout.
Continuation toward the major breakout level (~124K and beyond).
Invalidation / Bearish Case:
A clean breakdown below 113,000 with strong bearish momentum would negate this setup, likely targeting the psychological support near 110,000.
🧠 MMC Mindset: Trade with Patience & Confluence
This is a classic accumulation-to-breakout scenario. Smart traders wait for confirmation—especially as BTC often exhibits false breakdowns before a major move. Monitor candle behavior, volume, and reaction to the minor trendline.
Let the market show signs of strength (like bullish engulfing, pin bars, or a breakout-retest) before committing to the upside. Avoid FOMO; the key is discipline and precision entry at structural break points.
✅ Trade Plan Summary:
Watch zone: 113,000–114,500 for bullish price action
Breakout level: Minor trendline (~120,000)
Target zone: 123,500–124,000 (Major resistance)
Stop-loss idea: Below 112,800 (Invalidation of structure)

Bitcoin. Last call buy level? 29/July/25BTCUSD probably will have pullback toward confluence zone of 1) Trendline Support 2) Order Block 3) POC of volume before hitting ATH again
BTC BULL(2025)-SWING Your BTC/USD daily chart shows a Smart Money Concept (SMC) bullish setup with the following key points:
1. Market Structure
Price had a recent drop but is now retracing back upward.
The chart suggests accumulation and preparation for a bullish push.
There's a clear swing high liquidity above previous highs that price may target.
2. Key Zones
OB (Order Block) in pink:
This is the last bullish candle before a strong move down.
Price is expected to react here — either as a support retest before going higher.
Support (labelled in pink):
Aligned with the OB, acting as a confluence zone for buyers.
FVG (Fair Value Gap) in blue:
This gap represents inefficiency in price.
Price has tapped into it and could use it as a base to move higher.
3. Price Expectation
The red path suggests:
Small consolidation near the support/OB zone until around Tuesday (timing element in your plan).
Then, strong bullish expansion targeting above $122K, and potentially into the $135K range.
4. Liquidity
Liquidity sits above recent highs (marked near $122,021).
Market makers may push price up to take that liquidity before any reversal.
5. Trade Logic
Entry: On retest of the OB/support zone (around $116,000–$115,000).
Stop Loss: Below the OB or the $112,757 level.
Targets:
Short-term: $122,021 (liquidity grab).
Long-term: $135,809.

As ExpectedThe trend is still bullish, and we expect the price to reach 118.810.
A small correction — about one or two candles — is likely.

bitcoin long from hereim looking to long bitcoin from here with the hope of catching the next bull run
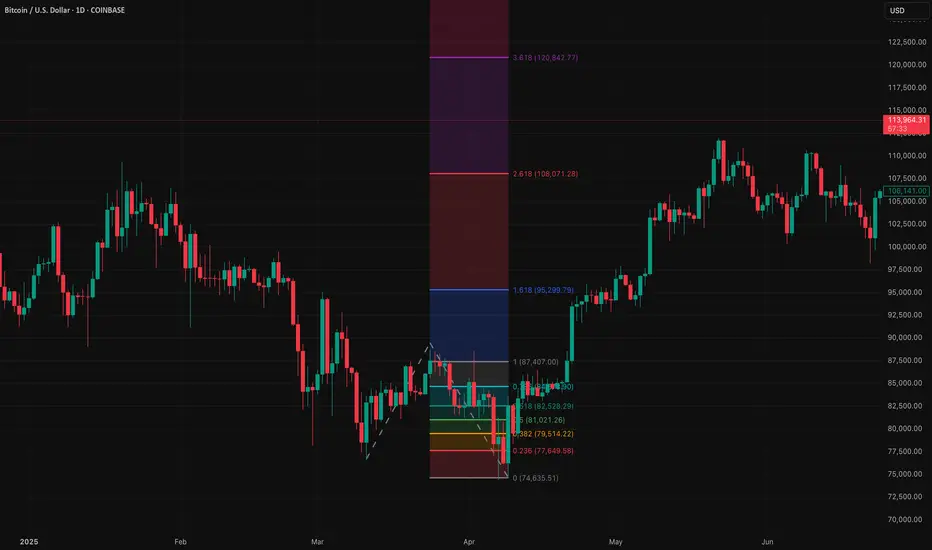
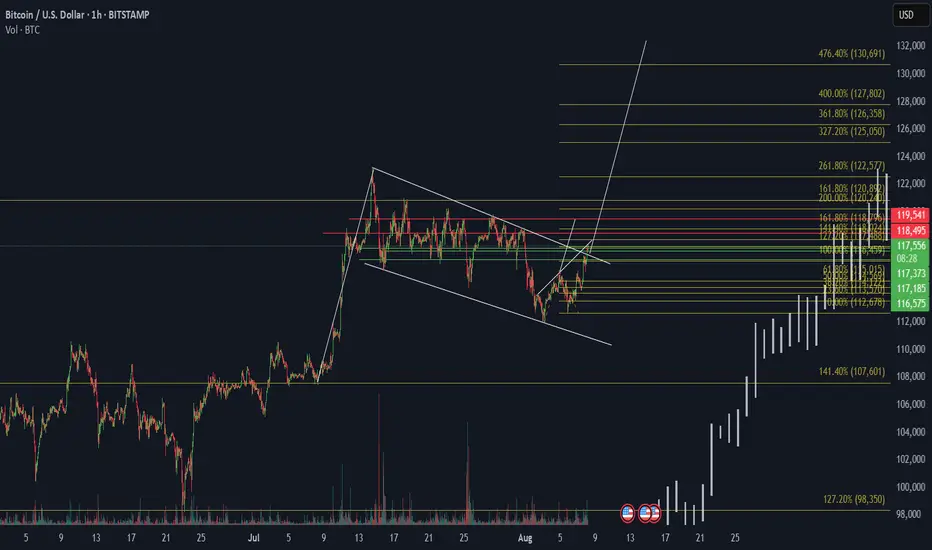
Btc Bullish breakoutTechnical Highlights:
Pattern Breakout: BTC has broken out of a descending wedge, a bullish reversal pattern.
Fibonacci Extensions: The price projection levels are drawn from the recent swing low to high:
1.618 (161.8%) 120,892
2.618 (261.8%) 122,577
3.618 (361.8%) 126,358
4.764 (476.4%) 130,691 = Target Area
Volume: A noticeable volume spike supports the breakout.
Current Price: Around 117,225 reclaiming above key resistance levels.
Bullish Confirmation Levels:
117,373 (Previous resistance now acting as support)
118,495 and 119,541 Strong horizontal resistance to clear
Sustained close above 120K could lead to a parabolic move toward 130K+
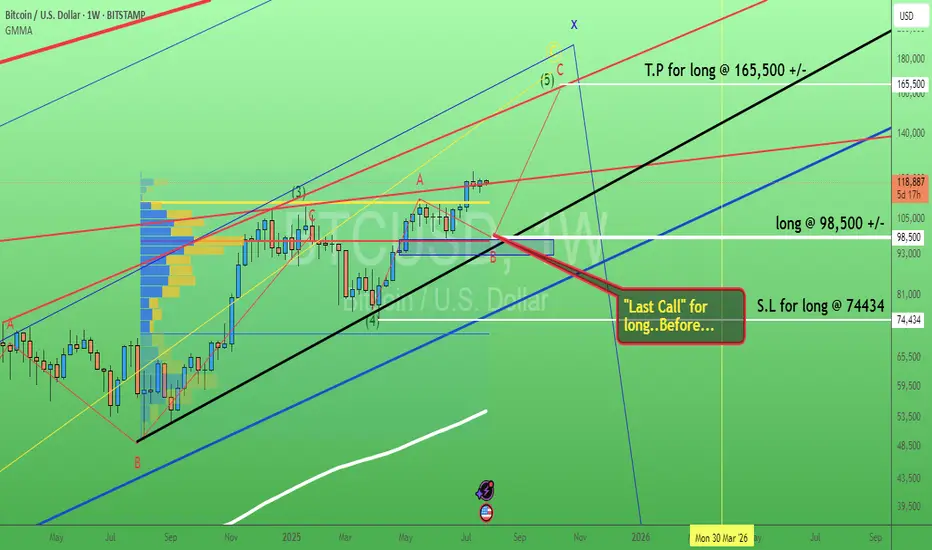
BITCOIN ready to fly.Bitcoin is going to fly the following 3 weeks arriving till 143k$-145k$
In September will see the price going down to visit the 125k$ level, and UPTOBER will bring us the last surprise, a bitcoin arriving till 167k$
And that´s all.
Good luck to everyone.
We´ll see 65k$ ending 2026 or begining 2027.

The successful trader anticipates activity in BSC🔁 Wallet 0x1ebab9c329317082577f0e495cbe5b0d4958c5e7 just bridged: 4 000 USDC left Ethereum → HitBTC, then 3 915 USDC hit BNB Chain minutes later.
DefiLlama shows ~$14M fresh inflows today in BSC, while ETH flows cool—signaling a rotation play.
Expect this whale to farm BSC yield or snipe rising alts next 📈
🔝 Score: #39 | Balance: $13.4k | Results: $16.4k→$219.5k (+1,340 %, 44 trades, avg buy $1,020 / sell $2,643).
