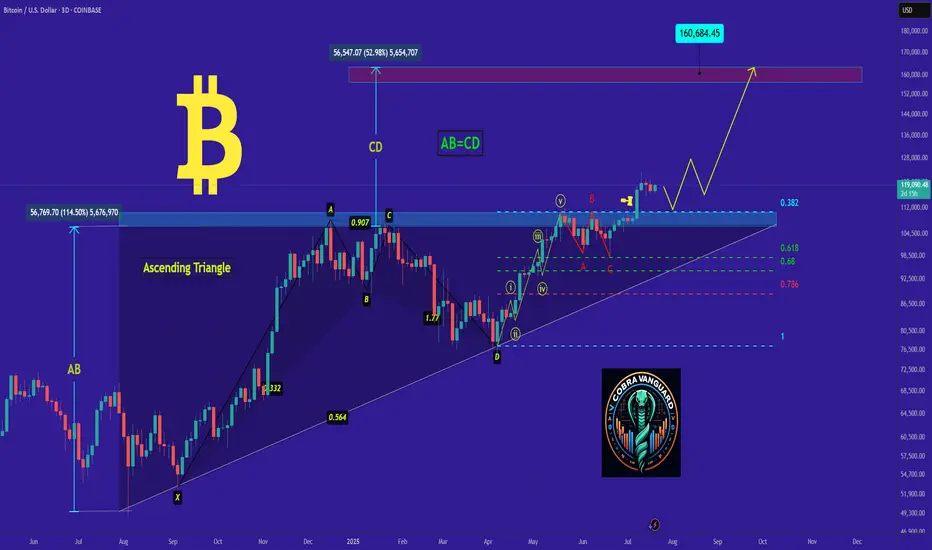
𝐛𝐢𝐭𝐜𝐨𝐢𝐧's Situation, A Comprehensive Analysis !!!As I said, Bitcoin broke the triangle, and now with a slight price correction, it could surge to $160,000, and you still think I'm joking!!
Previous analysis
BTCUSD trade ideas
BTC 4H – Dance with the 200MA
Bitcoin continues its strong relationship with the 200MA.
Each time price dips below it, fear spikes — but bounces off key Fib levels have followed, with price then riding higher alongside the 200MA.
Right now, price is caught between the 200MA and a nearby Fib level.
Here’s what could happen next:
– Price flips the Fib into support, ideally with help from a rising 200MA.
– Price waits for the 200MA to catch up, and they break the Fib together.
– Or, we get another panic dip, and the bounce comes after another test from below.
Whichever path it takes, we’ll be here watching it unfold.
Always take profits and manage risk.
Interaction is welcome.

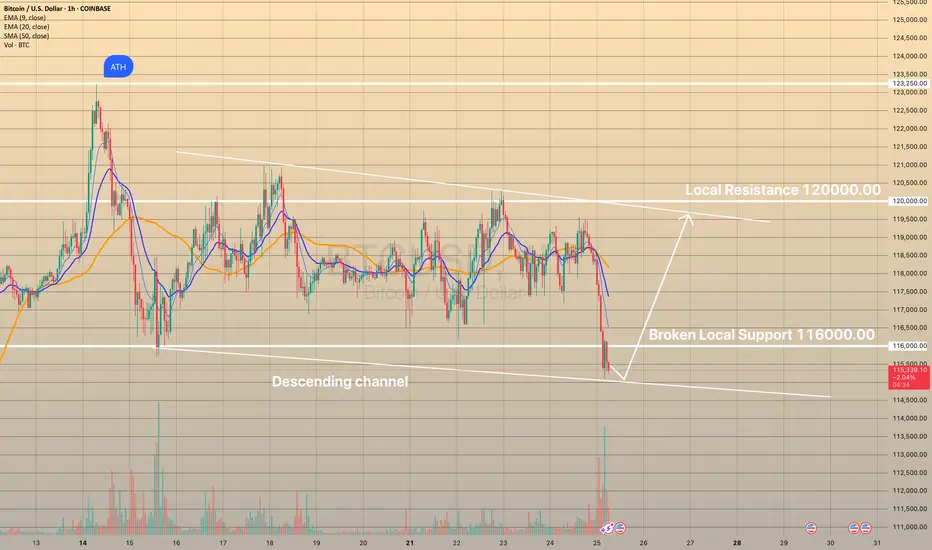
BTCUSD DROPPED BELOW LOCAL SUPPORTBTCUSD DROPPED BELOW LOCAL SUPPORT📉
Today bitcoin dropped below the level of 116,000.00 on high volume. However, the price didn't go somewhere far downwards and consolidates slightly below this level. Presumably, descending channel may be formed.
What is a descending channel?
A descending channel is a bearish chart pattern formed by two downward-sloping parallel trendlines connecting lower highs and lower lows in a pair’s price, indicating a consistent downtrend. It shows sellers are in control, with prices declining within a defined range.
Here I presume the price to rebound from lower border of the descending channel with possible movement towards upper border slightly below the 120,000.00 level.
Bullish bounce?The Bitcoin (BTC/USD) is falling toward the pivot and could bounce to the 1st resistance.
Pivot: 111,241.55
1st Support: 98,383.98
1st Resistance: 127,752.45
Risk Warning:
Trading Forex and CFDs carries a high level of risk to your capital and you should only trade with money you can afford to lose. Trading Forex and CFDs may not be suitable for all investors, so please ensure that you fully understand the risks involved and seek independent advice if necessary.
Disclaimer:
The above opinions given constitute general market commentary, and do not constitute the opinion or advice of IC Markets or any form of personal or investment advice.
Any opinions, news, research, analyses, prices, other information, or links to third-party sites contained on this website are provided on an "as-is" basis, are intended only to be informative, is not an advice nor a recommendation, nor research, or a record of our trading prices, or an offer of, or solicitation for a transaction in any financial instrument and thus should not be treated as such. The information provided does not involve any specific investment objectives, financial situation and needs of any specific person who may receive it. Please be aware, that past performance is not a reliable indicator of future performance and/or results. Past Performance or Forward-looking scenarios based upon the reasonable beliefs of the third-party provider are not a guarantee of future performance. Actual results may differ materially from those anticipated in forward-looking or past performance statements. IC Markets makes no representation or warranty and assumes no liability as to the accuracy or completeness of the information provided, nor any loss arising from any investment based on a recommendation, forecast or any information supplied by any third-party.

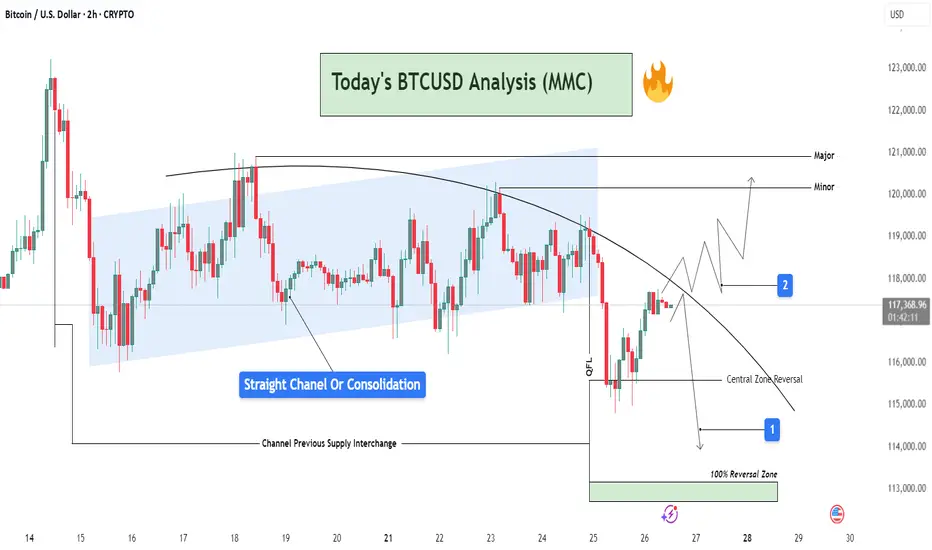
BTCUSD Analysis : Channel Break + QFL Setup | Structure Analysis📊 Chart Overview
This 2H BTCUSD chart reveals a comprehensive view of market behavior transitioning from a phase of consolidation into a potential breakout or further rejection. The price action is analyzed inside a parallel channel, transitioning into a curved resistance path, which is currently governing the market structure.
🔵 Phase 1: Consolidation Inside a Straight Channel
Price has respected a clear ascending channel (highlighted in blue) from July 16 to July 24.
This phase shows a range-bound movement with defined supply and demand zones.
Labelled as “Straight Channel or Consolidation”, this represents a potential accumulation/distribution zone.
The Channel Previous Supply Interchange marks an important S/R flip zone, now serving as a key reference for future reactions.
🔻 Phase 2: Break of Structure & Curved Resistance
Price broke down below the channel support and is now respecting a downward curved trendline.
This indicates a shift in momentum from neutral to bearish, forming lower highs.
A sharp drop occurred post-channel exit, marking a QFL (Quasimodo Failure Level) area—hinting at smart money involvement or liquidation hunt.
🔁 Reversal Scenarios & Key Levels
There are two possible future paths visualized:
🟥 Scenario 1: Bearish Continuation
Price respects the curved trendline, failing to break resistance.
A rejection near the current region (~117.5k) could lead price back toward:
Central Zone Reversal near 115,000 USD
Further into the 100% Reversal Zone (green zone) near 113,500–114,000 USD
Ideal for short entries after clear rejection confirmations.
🟩 Scenario 2: Bullish Breakout
Price breaks and sustains above the curved resistance.
Temporary resistance seen at Minor level (~120,000 USD), followed by Major resistance near 121,000 USD.
This scenario requires bullish volume and reclaim of structure, invalidating the short bias.
🧠 Strategic Viewpoint & Trade Mindset
Market is at a decision point—either confirming a bearish rejection from dynamic resistance or invalidating it for a bullish reversal.
Patience is key; wait for either:
A failed breakout attempt (short opportunity), or
A confirmed breakout and retest (long opportunity).
Use lower timeframes (15m–1h) for execution once direction is confirmed.
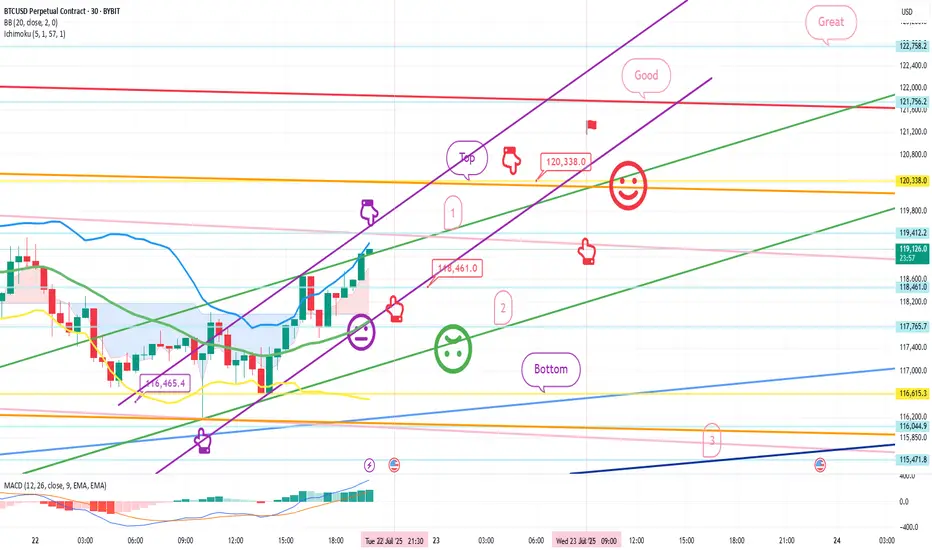
July 22 Bitcoin Bybit chart analysisHello
It's a Bitcoin Guide.
If you "follow"
You can receive real-time movement paths and comment notifications on major sections.
If my analysis was helpful,
Please click the booster button at the bottom.
This is Bitcoin's 30-minute chart.
Nasdaq indicators will be released at 9:30 in a little while.
Although Bitcoin's mid-term pattern is broken,
it looks like a strong upward trend based on signals and candlestick positions.
In the case of Nasdaq, the 6-hour and 12-hour charts MACD dead cross is in progress,
and even if there is no plunge and only a sideways movement,
it seems likely that today's strategy will be successful.
In the bottom left, from the analysis article on the 18th,
the final long position entry point of $116,465.4 Bottom
is connected as is.
*Red finger movement path
One-way long position strategy
1. $118,461.9 long position entry section / green support line breakout, stop loss price
2. $120,338 long position 1st target -> Good, Great in order of target price
See the 1st section at the top as a touch section for an upward wave rather than a short position entry,
and if this section breaks through right away, an upward trend can be connected.
If the purple parallel line support line is maintained without breaking away,
there is a possibility of a vertical rise.
If the top section is touched,
after the first liquidation,
it would be good to use the 1st section to re-enter a long position.
The 2nd section at the bottom is important,
and if it is pushed to this section according to the movement of Nasdaq today,
it can fall strongly.
Please check the real-time support line shape.
From the breakout, Bottom -> 3 sections are open.
If you touch the 3rd section after tomorrow, the mid-term pattern will be restored.
This is the 12+ day section.
Up to this point, I ask that you simply use my analysis for reference and use only.
I hope that you will operate safely with the principle of trading and stop loss.
Thank you.
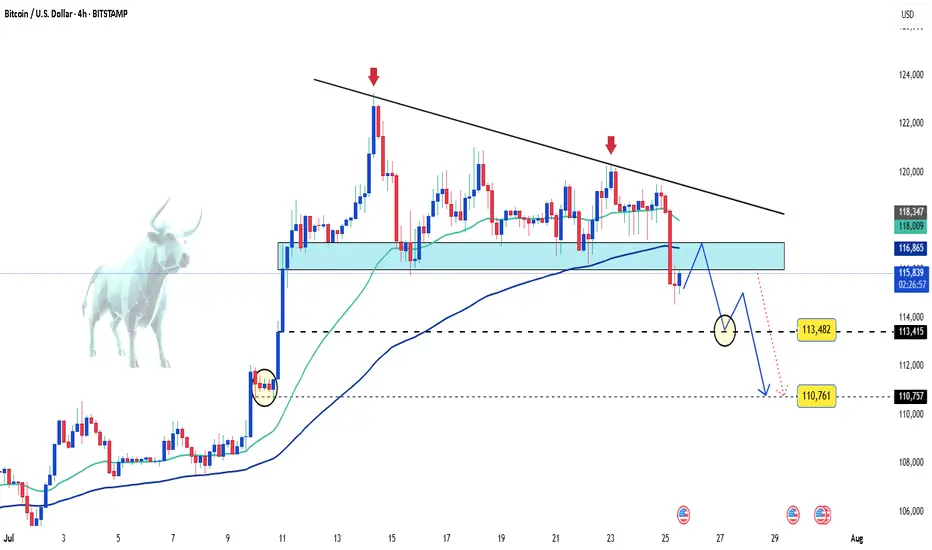
Bitcoin on the edge – Is a sharp drop coming?Bitcoin is keeping investors on edge as price action remains volatile and primed for an explosive move once news or capital flows ignite the market.
🌍 Latest market updates:
– Whales are back in accumulation mode, with on-chain data showing large wallets growing rapidly.
– The U.S. government has just transferred a significant amount of BTC to exchanges — is a dump coming?
– U.S. spot Bitcoin ETFs are witnessing record inflows after CPI came in lower than expected, fueling hopes that the Fed will pause further rate hikes this year.
📉 Technical outlook:
– On the H4 chart, BTC formed a tightening wedge pattern, which has now broken to the downside.
– A steep drop toward the 113,000 to 110,000 USD zone is entirely possible.
This looks like a classic break-retest setup — a golden window for strategic entries. If sell volume surges, it could be the perfect moment for bears to strike.
Stay sharp — and good luck!
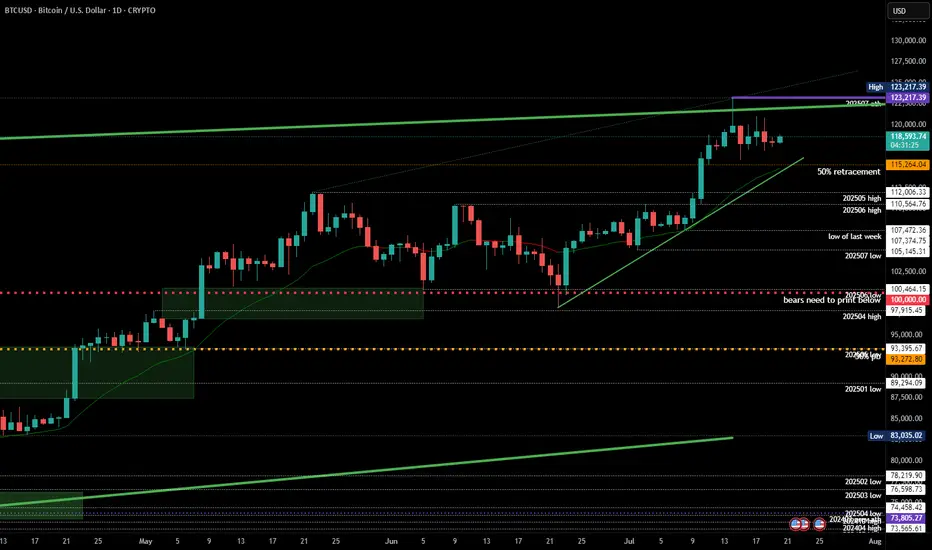
Healthy BTC Retrace in Trend Next Breakout Target 112K Then 122KBitcoin continues to respect the bullish market highlighted in our previous analysis, where the AB=CD structure pointed toward significant upside potential. The market has since retraced into a well defined re-accumulation zone, aligning precisely with prior expectations.
Price has held firmly above the round figure support ($100k), with the current structure confirming a healthy correction within trend.
As long as the re-accumulation zone between 104k–107k holds, momentum remains skewed to the upside. The projected 2.618 extension sits near the 122k mark, where the current setup aims to complete.
The broader structure still respects higher timeframe demand and ascending channel boundaries, keeping bullish continuation valid unless 100k decisively breaks. Watch for confirmation breakout above 112k to activate the next leg of the move.
If you found this analysis insightful, drop a like to support the work and leave a comment with your perspective whether you agree, disagree, or have an alternate scenario in mind. Let's grow together through collective insights.

BTCUSD What Next? BUY!
My dear friends,
Please, find my technical outlook for BTCUSD below:
The price is coiling around a solid key level - 11678
Bias - Bullish
Technical Indicators: Pivot Points High anticipates a potential price reversal.
Super trend shows a clear buy, giving a perfect indicators' convergence.
Goal - 11791
About Used Indicators:
The pivot point itself is simply the average of the high, low and closing prices from the previous trading day.
Disclosure: I am part of Trade Nation's Influencer program and receive a monthly fee for using their TradingView charts in my analysis.
———————————
WISH YOU ALL LUCK
#202529 - priceactiontds - weekly update - daxGood Day and I hope you are well.
comment: Prior weeks close was 24332 and this was it was 24386. Bulls need to continue with higher lows and bears need to break below 24000 for lower prices. Not more magic to.
current market cycle: bull wedge
key levels for next week: 24000 - 25000
bull case: Bulls are still in control until we print lower lows again. We have 2 potential bull trend lines close to the daily ema and that’s around 24200 and will be my line in the sand for bulls next week. Below, chances of 24000 go up big time. If we stay above 24300, there is no reason we can not test back up to 24500 and above that we will likely try 24700+ again.
Invalidation is below 24000
bear case: Bears need a lower low below 24000. That’s really all there is to it. As of now the selling on Friday was decent but it’s not enough to expect follow-through selling. Below 24000 I think we can test the 50% retracement at 23900 but I’d be surprised if we go lower. Only an event could trigger that. Lower targets would be as marked on the chart.
Invalidation is above 24749
short term: Neutral. I want follow-through selling but will likely won’t get it. It’s still a bull wedge until we have a daily close below 24000.
medium-long term from 2025-06-29: Bull surprise last week but my targets for the second half of 2025 remain the same. I still expect at least 21000 to get hit again this year. As of now, bulls are favored until we drop below 23000.
BTC/USD — Potential Bullish BreakoutBitcoin is currently retesting a key intraday level after pulling back from recent highs. If price continues to hold above this level, potential for break above previous highs.
As long as the structure holds and continue bullish momentum. However, if price slips back below the level with momentum, this scenario may be invalidated.
📌 Bias: Neutral to Bullish
📌 Timeframe: Intraday / Short-term
📌 Key Level to Watch: 118K
$BTCUSDT: Fictitious Fractal 136KSo. I see we are having a relatively difficult time.
My expectations are in this range for the next appx. 125 days - 365 days.
Downside: 68.6k-69.9k
Topside: 100k to 136k (round to 150k)
I drew this fractal by hand and I want to watch it closely.
I expect in the next few weeks we hit 100k and then do a nice rug to 69k range.
This is probably wrong.
I pretty much extrapolated the red brush circle into a weeks long fractal.
I am longing all the dips to 68k.
Enjoy.
Mr. Storm.


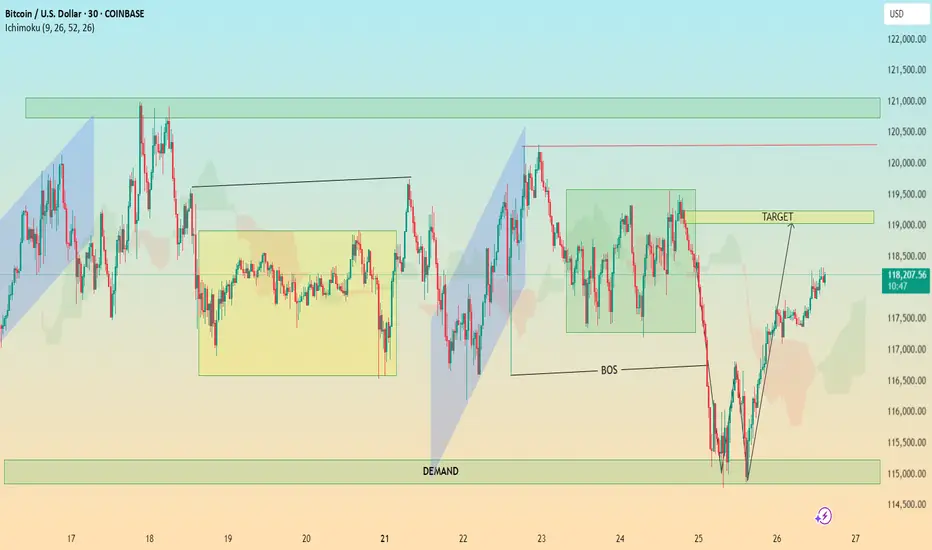
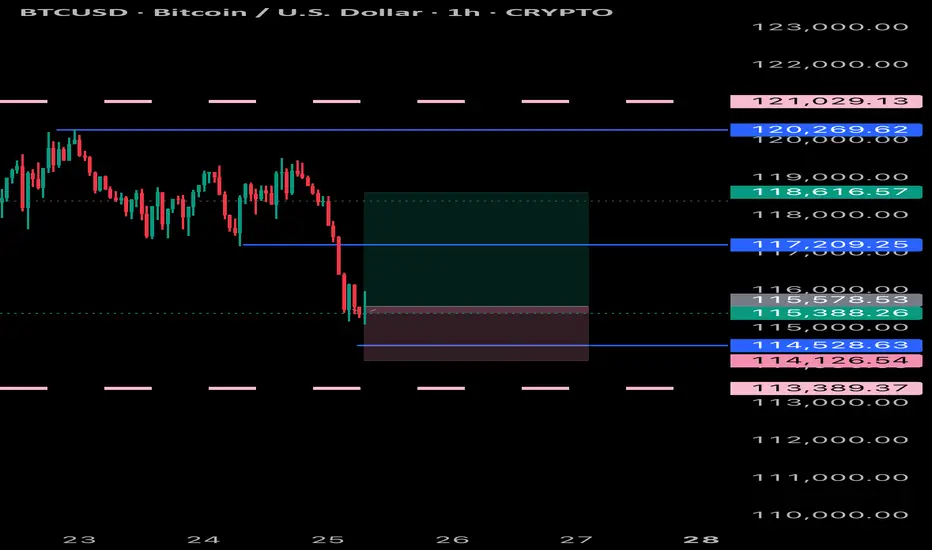
BTC In-Depth Technical Analysis: BTC/USD (30-Min Chart)🔍 In-Depth Technical Analysis: BTC/USD (30-Min Chart)
🟩 1. Demand Zone Reaction
Location: ~$114,500 – $115,500
Significance:
Price sharply reversed after a strong move into this demand zone.
This zone coincides with a liquidity grab below previous lows — textbook Smart Money trap.
Volume (if checked) would likely spike here, indicating institutional interest.
✅ Interpretation: Institutional demand stepped in, absorbing sell orders and triggering a reversal.
📉 2. Break of Structure (BOS)
Zone: Around July 24–25
Price broke below a key higher low, signaling temporary bearish structure.
However, this was quickly reclaimed after demand zone reaction — suggesting a fakeout BOS or a liquidity sweep.
✅ Interpretation: BOS caused shorts to enter, but reversal suggests a bear trap and continuation higher. The BOS served to fuel a more aggressive bullish rally.
🎯 3. Target Zone
Marked Target: ~$118,900–$119,200
Why This Area?
It aligns with a previous consolidation zone / supply before the sharp drop.
Also overlaps with Ichimoku cloud resistance and previous highs — strong confluence.
✅ Interpretation: Price is likely to face resistance here. If broken with strong momentum, bullish continuation to the next supply zone (~$121K) is possible.
⛓️ 4. Market Structure Analysis
Higher Lows Forming after demand reaction.
Price is forming a bullish market structure with an ascending wave pattern.
A break and retest of the $119K zone could lead to a mid-term rally.
Failure to break could result in:
A pullback to the $117,000 area
Or a deeper retest of the demand zone
✅ Trading Plan Options:
Bullish Bias: Buy pullbacks above $117,000 with $119,000 as target
Bearish Bias: Wait for strong rejection at $119,000 to short back to $115K
☁️ 5. Ichimoku Cloud Insight
Price has moved above the cloud, suggesting momentum shift to the upside.
The cloud is twisting bullish, supporting short-term bullish trend.
However, flat Kumo tops around $119K = likely rejection zone.
✅ Interpretation: Ichimoku confirms bullish potential, but price must close above the cloud + $119K zone to sustain trend.
📌 Key Takeaways for Publishing
Chart Idea Title:
“BTC/USD Demand Zone Reversal | Break of Structure & $119K Target in Sight”
Summary Description:
Bitcoin has reclaimed bullish momentum after a sweep into the $115K demand zone. A break of structure triggered shorts, but demand absorption led to a sharp reversal. Now, price is approaching the key $119K supply zone — a critical level that could determine if this is a short-term rally or the beginning of a new trend. Watch for either a clean breakout or a rejection for a possible retest of $117K or lower. Confluence from Ichimoku, BOS, and market structure support the analysis.
bitcoin technical chart movingwe are provide bitcoin next falling expected after big chance to buying level
Btcusd techinical analysis.Btcusd techinical analysis next move posibale at h1 time.not finchinal advice.

Reversal Zone: BTC Eyes $124.5K After Potential Liquidity SweepTechnical Analysis (4H Chart)
🔷 Pattern Overview:
Rising Channel: BTC is still respecting a long-term upward channel (black parallel trendlines).
Falling Wedge (Short-Term): Inside the channel, a falling wedge is forming—typically a bullish continuation signal.
The wedge is nearing completion, with a possible fakeout below support to the $110,500–$110,600 zone before a sharp rally.
✅ Price Expectation:
Bear Trap Likely: Price may dip to $110.5K support, triggering stop-losses.
Bullish Breakout Setup: If price rebounds strongly from $110K area, the wedge + channel pattern supports a move toward $124.5K–$125K.
Invalidation: Clean break below the channel and $110K could invalidate the bullish scenario.

bitcoin chart analysisbitcoin chart analysis on daily time frame
here a buy zone that indicated by box and line.
and on chart bitcoin bullish but lower time frame btc is berrish.
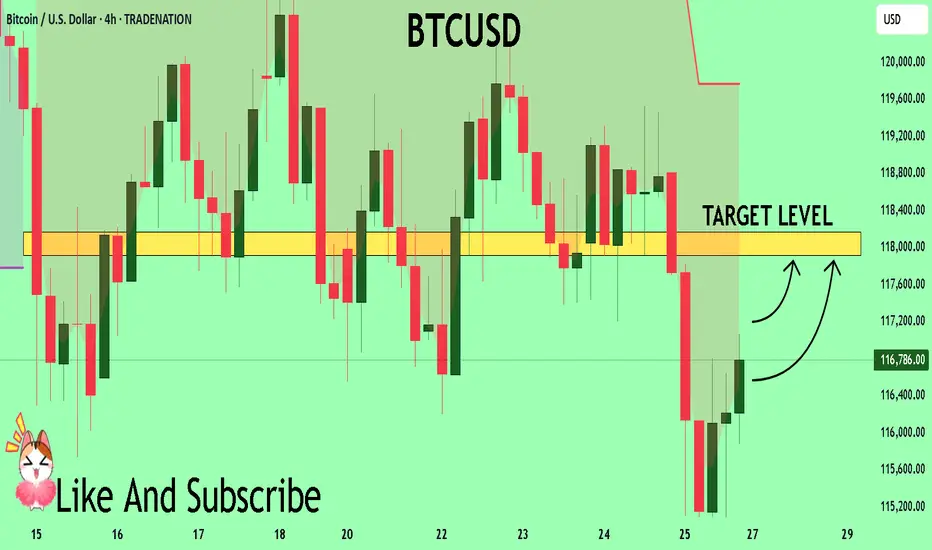
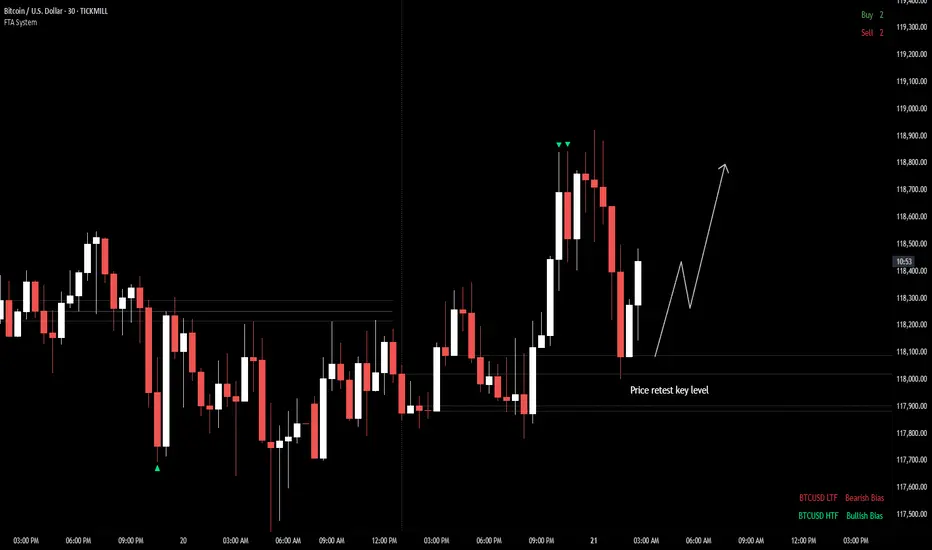
BTCUSD Key Supply Zone Rejection – Bearish Target Mapped BTCUSD Key Supply Zone Rejection – Bearish Target Mapped (Educational Breakdown)
⸻
🧠 Technical Analysis (1H Chart):
• Range Structure: BTCUSD is currently trading within a well-defined consolidation range between the Resistance Zone ($119,850–$120,591) and the Support Zone ($116,937).
• Volume Profile (VRVP): Volume is noticeably thick near the mid-range, suggesting accumulation/distribution behavior. Price is struggling to break above the value area high near $120K.
• Resistance Rejection: After testing the upper supply zone, price failed to sustain bullish momentum and is showing signs of exhaustion – a possible sign of institutional selling.
• Target Zone: If price rejects this resistance again, a strong move toward the target level of $117,260 is expected. This aligns with:
• Mid-range liquidity sweep
• Low-volume node (LVN) below current price
• Fair Value Gap fill near $117,200–$116,900
⸻
🧩 Key Concepts Highlighted:
• Support & Resistance Mapping
• Volume Profile Readings
• Institutional Order Flow Bias
• Target Projection using Smart Money Concepts
⸻
⚠ Educational Insight:
This setup is a perfect example of how to combine Volume Profile + Price Action to identify liquidity traps and smart entries. Always wait for confirmation near key zones — not every level breaks!
⸻
✅ Trade Plan (Not Financial Advice):
• Watch for bearish engulfing/rejection wick at resistance
• Short entry below $119,000 with SL above $120,600
• Target: $117,260 / Final TP: $116,937 zone

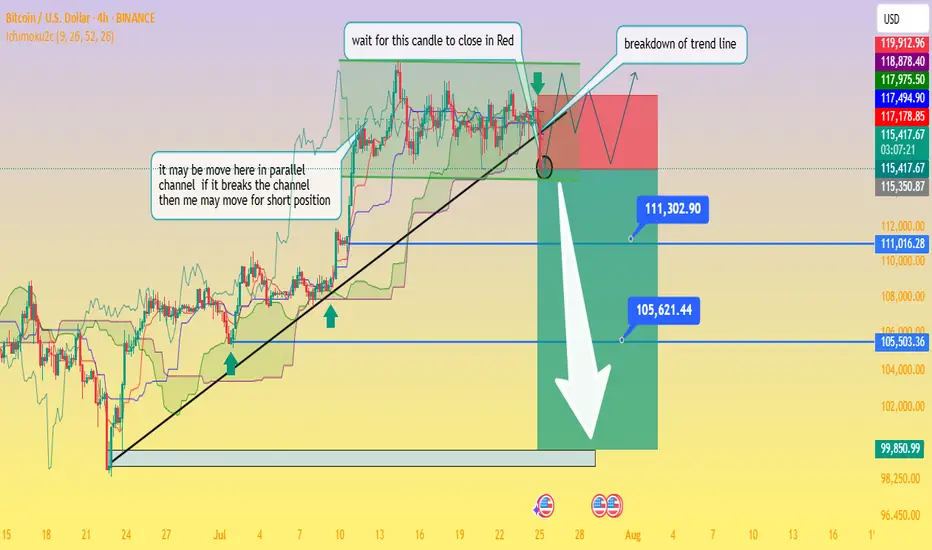
Critical Breakdown: BTC/USD Poised to Fall — Waiting on H4 CloseAnalysis of the BTC/USD 4‑Hour Chart
From the chart you provided, here's how the technical situation looks:
Ascending trendline support has been tested multiple times and was recently breached this afternoon, signaling a possible shift from the bullish setup to a bearish continuation.
The price is now trapped within a descending triangle formation beneath a well‑defined swing high resistance zone. This reflects indecision in the market, with neither buyers nor sellers in clear control
Business Insider
+15
Fxglory Ltd
+15
Bitcoin News
+15
.
Key levels to monitor:
Support zone: ~$115,500, extending down to ~$111,300 and ~$105,600 as deeper targets if bearish momentum strengthens.
Resistance zone: ~$119,000–120,000 area, forming strong overhead supply
Economies.com
DailyForex
Bitcoin News
.
The chart’s annotations align with a classic breakout strategy—with the caveat: wait for a confirmed close below the trendline before considering short positions (as noted in your “wait for this candle to close in red” comment).
Breakout confirmation would likely pave the way toward your indicated profit zones near ~$111k and ~$105k, with a larger potential down to ~$99.8k if further downside pressure builds.
🔍 What the Broader Market Signals
Technical sentiment from sources covering today’s analysis shows BTC/USD hovering just under $120,000, stuck within the defined range of $115.5k support to $120k resistance
Economies.com
.
While there’s still neutral momentum in indicators like RSI and MACD, the short-term direction leans bearish if the breakdown is confirmed on the H4 timeframe
Fxglory Ltd
.
Analysts emphasize that sustained movement above $116.5k could retarget resistance near $119–120k. A failure there and a move below $115.5k may thrust price deeper toward your downside zones
DailyForex
.
✅ Trading Strategy Overview
Scenario Trigger Target Levels
Bearish Breakdown H4 candle closes below trendline ~$115.5k $111.3k → $105.6k → possible $99.8k zone
Bullish Rejection Bounce back above ~$116.5k and trending above resistance $119k–120k retest, potential breakout if sustained
Neutral / Wait-and-see No decisive candle close yet Hold for confirmation
⛳ Final Thoughts
chart highlights a critical point: don’t act prematurely. Wait for a decisive H4 candle close below the trendline before committing to shorts. Confirmed bearish action around the breakout could open the path to the lower targets you identified. However, if price rebounds above support and climbs above $116.5k, a short-term retest of $119k–120k is still in range.
Traders should maintain prudent risk management—watching the unfolding price action around these pivot points without overreaching. Let me know if you'd like help crafting entry/exit zones or risk profiles for this setup!
BTCUSD BUYING can expect a bullish move from bitcoin as it has dropped a fair amount and can extract a reversal to the up side due to being oversold
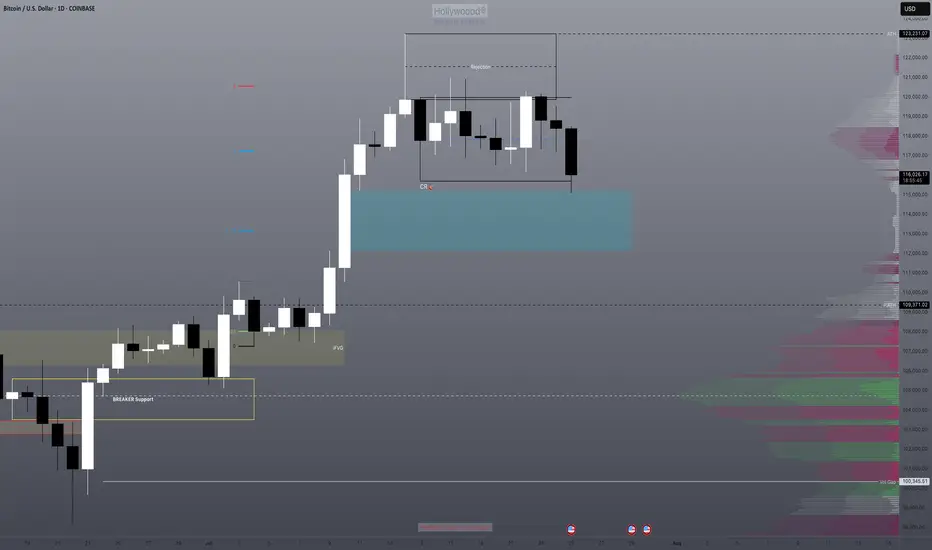
How far will Bitcoin drop? 115? 113? 110? Or even lower?Bitcoin has finally managed to break out of the range after nearly two weeks. Now we need to see whether this breakout gets confirmed or not, and if it does, what volume of selling it will face.

Will the low of this BTC zone be used as a buy point?We have an imbalance high being tested. We know that this also represents the consolidation range low where both TPs and long entries will be triggered.
Will this be enough to send us back bullish or will be need further correction of the imbalance? I think there's a high probability of this with DXY also running into it's daily bearish imbalance range.