CHECK BTCUSD SIGNAL READ CAPTAINShort (sell)
Entry Point: Around 118650 118050
Stop Loss: Around 120550
🎯 Target Levels
Take Profit 1:
116400
Take Profit 2:
114100
Last Target:
111900
BTCUSD trade ideas

BTCBTC is still bullish, it needs correction and next reaction is above 120K.
Disclosure: We are part of Trade Nation's Influencer program and receive a monthly fee for using their TradingView charts in our analysis.

Bitcoin sell now for 4h time frame trend reversal Bitcoin sell now for 4h time frame trend reversal From here

BITCOINBTC is showing strong bearish momentum. Price has broken below key support and is forming lower highs and lower lows, indicating continuation of the downtrend.
Until we see a clear reversal pattern or reclaim of resistance levels, I expect further downside.

BTC/USD POTENTIAL SELL OPPORTUNITY!A sell opportunity is what we envisage in this market from the H4 timeframe.
After the new high was made, the market formed a bearish flag pattern like pattern. We’re looking for to selling from the current market price. Our target profit is $111,000

BTC/USD Today: Momentum Builds Toward the Next BreakoutBITSTAMP:BTCUSD Today: Momentum Builds Toward the Next Breakout
Previously on BTC...
1. Double Top Pattern and Target Hit
The chart shows a classic double top (early 2025), a bearish reversal pattern. Once the neckline broke, the price plunged and nailed the technical target (red arrow)—as if Bitcoin had read the textbook.
2. Trendline Break = Game Changer
After bottoming out, BTC broke through a downward sloping trendline, triggering a strong bullish move. This breakout signaled a trend reversal, and the market responded accordingly.
3. Perfect Pullback
Once the breakout played out, the price retraced back to previous resistance, now turned support. This “perfect pullback” is the kind of thing that makes technical analysts smile in their sleep.
4. Bull Trend Confirmation
The successful retest of support confirmed that Bitcoin had shifted from neutral/bearish into a full-on bull trend. Buyers stepped back in with confidence.
📊 BTC/USD – Current Outlook
Bull Flag Forming
Currently, price action is consolidating into a bull flag, a continuation pattern often seen mid-rally. If it breaks out to the upside, the projected target sits near $120,000 .
🚀 Bullish Catalysts:
- Strong structural trend: Higher highs and higher lows are still intact.
- Post-halving momentum: Historically, Bitcoin tends to go beast mode 6–12 months after each halving—and we’re right in that sweet spot.
- ETF inflows : Institutional capital continues pouring into Bitcoin ETFs, adding steady buying pressure.
- Supply crunch: With more BTC leaving exchanges, sell-side liquidity is drying up. Hodlers are hodling.
- Technical setup: A confirmed breakout from the bull flag could trigger a powerful leg higher.
⚠️ Risks and Levels to Watch:
A breakdown of the bull flag could send BTC back toward the $98k–91k range.
Macro headwinds (rate hikes, economic slowdown, dollar strength) could still rain on crypto’s parade.
🧠 Conclusion
This chart paints a textbook bullish setup for Bitcoin. The double top is in the rearview mirror, the trendline breakout gave us the green light, and now the bull flag is loading the next move.
If the breakout happens, the next destination could be $120,000.
It’s one of those “don’t blink” moments—BTC might just be stretching before its next sprint.

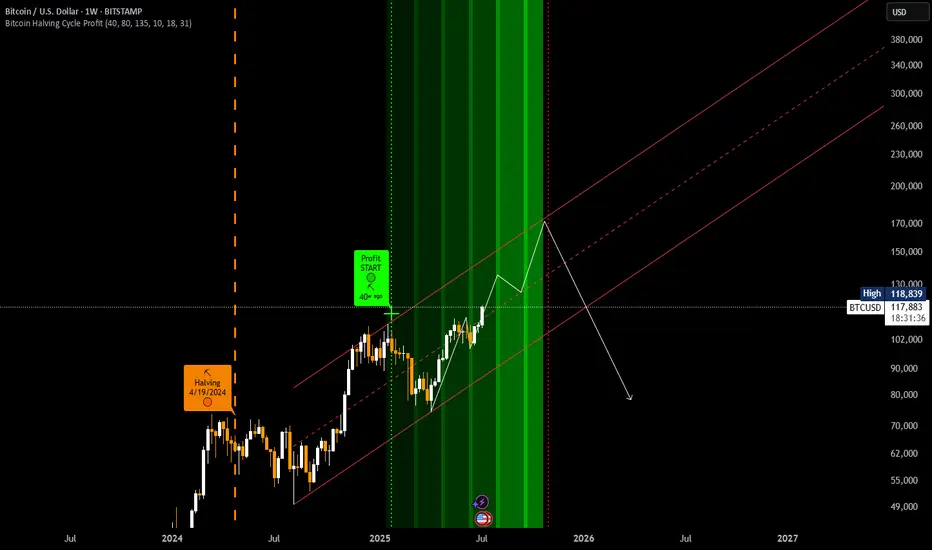
20 year long BTC analysisTaking into account the halvening and the recent bullish news of countries and big companies wanting to establish a BTC reserve. I think we can see some crazy cycles in the future.
These entities are most likely planning to hold for a minimum of 20 years. And countries won't be shy to print some extra dough for it. Some may see it as an opportunity to finally get rid of their national debt.
As long as fiat exists BTC will most likely keep going up. Its that simple.

BitcoinBitcoin has fallen below the support area, resulting in the expected quick decline. The price is currently testing the resistance area and must reclaim this level; otherwise, we may see downward movement again. The key level to reclaim is between $106,800 and $107,000.

July 18 Bitcoin Bybit chart analysisHello
It's a Bitcoin Guide.
If you "follow"
You can receive real-time movement paths and comment notifications on major sections.
If my analysis was helpful,
Please click the booster button at the bottom.
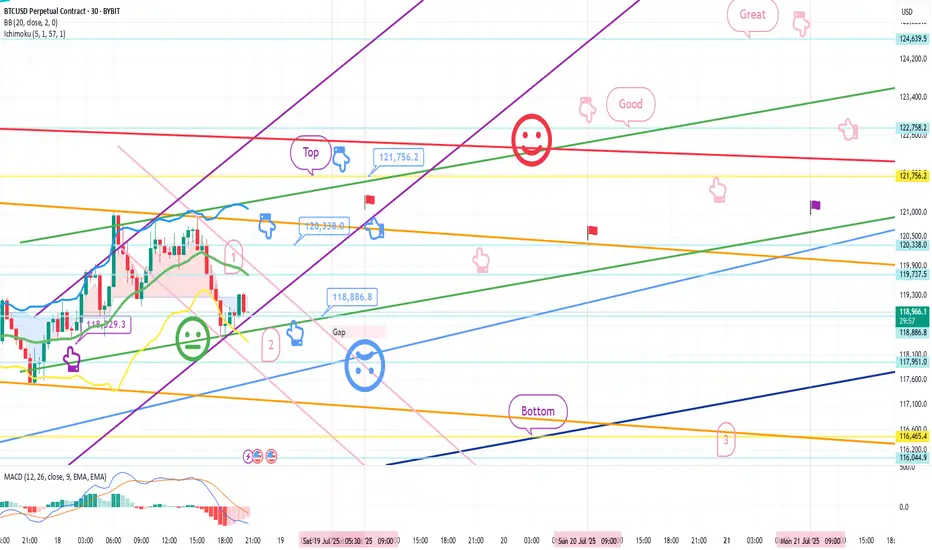
Bitcoin 30-minute chart.
There is no Nasdaq indicator announcement today.
The mid-term pattern was broken in the morning wave,
but I proceeded as safely as possible.
At the bottom left, I connected the final long position switching section in the analysis article on the 15th with a purple finger.
*When the blue finger moves,
Bidirectional neutral
Short->Long or long waiting strategy
1. Short position entry section of $120,338 / Stop loss price when orange resistance line is broken
2. Long position switching of $118,886.8 / Stop loss price when blue support line is broken
3. Long position 1st target of $121,756.2 -> Target price in the order of Good and Great
If it falls immediately from the current position or
touches the top once and falls, it is a vertical decline condition.
If it falls immediately, it is the final long waiting in section 2.
(When the sky blue support line breaks, the stop loss price is the same)
From the sky blue support line break, the 6+12 section is where the mid-term pattern is restored,
and it is roughly the bottom section.
If the strategy is successful, I have left a simulation with a pink finger on the right,
so please check the switching and profit-taking section,
and operate safely in each position, long, short, and no position, based on whether the purple support line breaks from the current position.
From the green support line break, the low point of today's daily candle is broken,
so it would not be good for a long position, right?
Up to this point, please use my analysis article only for reference and use,
and operate safely with principle trading and stop loss price.
Thank you.
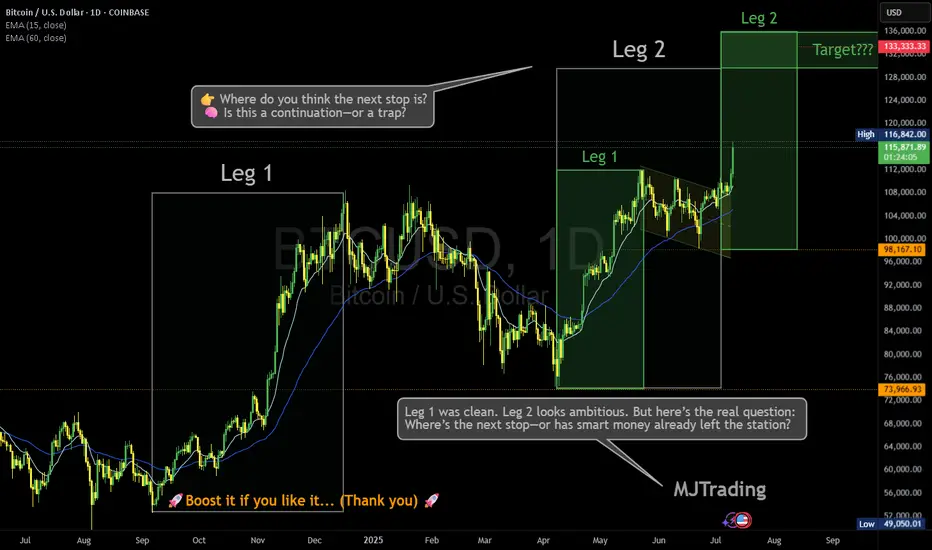
Where is the next stop? 133,333?Leg 1 was clean. Leg 2 looks ambitious. But here’s the real question: Where’s the next stop—or has smart money already left the station?
BTC just sliced through both EMAs with conviction, now hovering above $116K. Volume’s decent, sentiment’s euphoric… but is this rally genuine markup, or a cleverly disguised distribution phase?
🔍 Price targets like $133K are seductive—but what if consolidation isn’t horizontal anymore?
Vertical consolidation is real. And it’s where retail gets baited hardest.
📊 Leg 2 might still play out—but don’t ignore the possibility that this is the final markup before a liquidity sweep.
👉 Where do you think the next stop is? 🧠 Is this a continuation—or a trap?
Drop your guess...
Who has entered here:?
Who can let the winners run in this situation:
#MJTrading #ATH
#Bitcoin #BTC #CryptoTrading #SmartMoney #MarketStructure #WyckoffMethod #LiquiditySweep #DistributionPhase #TechnicalAnalysis #TradingView #CryptoChart #PriceAction #EMA #Consolidation #CryptoStrategy #TrendReversal #CryptoCommunity
Last chance to make profit from BTC with buying positionBullish flag
Strong resistance breakout
2 bull points
Position trade spot buying
Bitcoin completing timecycle on oct 2025 after that it would be 4th time if market again crash for around 70%
Manage your risk in both future and spot trading
Note: NO analysis would 100% profitable trading is the game of probability and risk management so follow your trading plan with proper risk reward and win rate.

BTC - HYPERBOLIC FINISH This box here where we right shit in, what it really worth? You will never understand technical analysis if you think reading words in a little box mean something. BTC , next top mid frame with a throw over of center to $164,000. Then consolidation around the core to $138,000, then the hyperbolic finish to $187,500+. Nuf said. Good luck. Volatility will be high, but mainly move in one direction. Murrey Math, ( Which trading view wont let me display because its an unpublished indicator , Elliott Wave, Kumar Wave being used for this forecast.

BTCUSD Long📈 Scenario Outlook:
Bias: Bullish
Preferred Play: Long setups are favorable as long as price holds above 116,600 demand.
BTC is expected to push through the intermediate supply zones and potentially attempt a full retracement toward the previous CHOCH high at 123,231.
📌 Key Zones ("Your Borders"):
🟢 Demand Zone (Support)
Zone: 116,600 – 117,600
This is a well-marked reaccumulation zone, aligned with previous demand and the CHOCH origin. Price respected this level multiple times, showing it as a valid base for long entries.
As long as BTC holds above this zone, the bullish thesis remains valid.
🔴 Supply Zones (Resistance Targets)
First Supply: 119,000 – 120,000
Aligned with the 50% retracement level (11964.22) from the previous high to low swing.
Expect short-term reaction here; however, this level may not hold if momentum continues building.
Upper Supply Zone: 121,500 – 123,200
This is the final major resistance before revisiting the previous high at 123,231.
A sweep or rejection from here could form a double top or distribution structure, depending on macro factors and volume.

BTC Long and ShortFor chart pattern, TP1 Reahced , mostly will go TP 2.Target swing high (TP 2) and Counter for swing low,after reaching TP2. What do you think guys

SellRejection Level
Daily Volume
Market Structure Shift
London US Session
Trend Line Break
Untapped Order Point

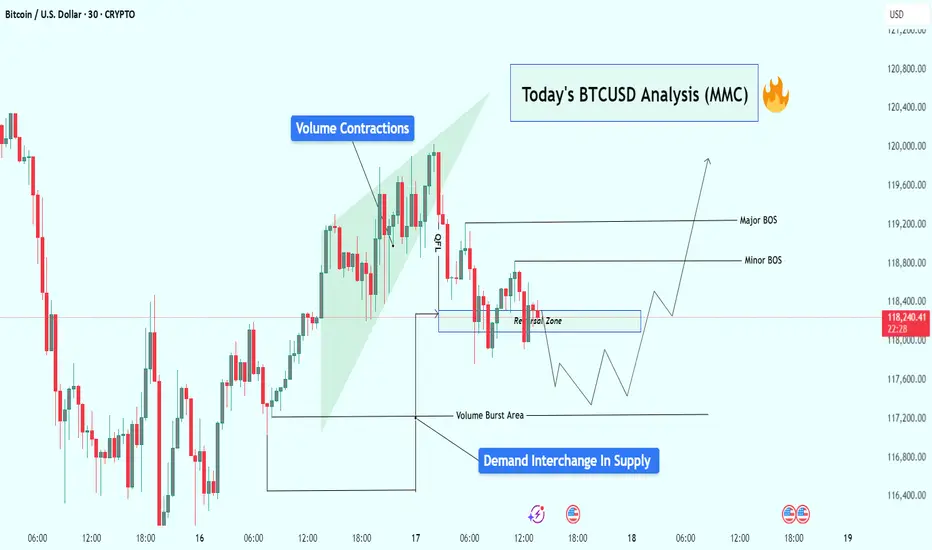
BTCUSD Analysis : Reversal Brewing from Volume Burst Demand Zone🧠 Overview:
Bitcoin is currently showing signs of a potential bullish reversal, following a classic Market Maker Cycle (MMC) pattern. The price action has been clean, respecting both volume dynamics and structural levels, setting the stage for a possible breakout above key areas of interest.
Let’s dive into the detailed breakdown:
🔍 Key Technical Elements:
1️⃣ Volume Contractions – Early Sign of Momentum Shift
At the top left of the chart, we observe a sharp upward move, followed by volume contraction within a rising wedge. This typically represents:
Absorption of orders
Reduced volatility
Market indecision
This kind of structure often precedes a reversal or aggressive breakout, depending on how price behaves near liquidity zones.
2️⃣ Fakeout/Trap Above – Classic MMC Manipulation Phase
After the rising wedge formed, BTC experienced a quick fakeout (stop hunt) just above the highs, then dropped sharply. This was the manipulation leg — a clear signal that liquidity above the wedge was taken and smart money is now repositioning.
🧠 Market makers love to trap breakout traders before moving the opposite way. The drop confirms manipulation is complete.
3️⃣ Reversal Zone + Demand Interchange into Supply
Price then entered a marked reversal zone which was previously an area of demand — now interchanging into supply. This zone is critical because:
It aligns with volume burst zones
It acted as support turned resistance
Multiple rejections confirm order flow shift
This tells us smart money is now testing this area to accumulate or trap sellers.
4️⃣ Volume Burst Area – Institutional Involvement Confirmed
We can clearly identify a Volume Burst Area, where price spiked with strong momentum — this is not retail trading. This zone is now being revisited for a potential bullish re-accumulation.
Expect reaction from this area, as it likely contains unmitigated buy orders from institutions.
5️⃣ Break of Structure (BOS) Mapping:
Minor BOS: Breaks short-term lower highs, showing early intent.
Major BOS: Breaks significant structure, confirming shift in trend direction.
A successful retest of demand and then break of both BOS levels will likely lead to a strong bullish continuation.
📈 Trade Plan & Potential Price Path:
There are two potential bullish entry strategies forming:
✅ Scenario 1: Clean Breakout Plan
Price holds the current reversal zone
Breaks Minor BOS, then Major BOS
Retest of BOS confirms continuation
📍 Target: $119,600+
✅ Scenario 2: Liquidity Sweep Entry
Price dips lower into Volume Burst Area
Sweeps liquidity below and prints a bullish reaction
Enters from discount zone
Same upside targets apply
🧠 This would be a smart money entry — entering from the lowest point of pain for retail traders.
🧵 Final Thoughts:
BTC is setting up beautifully for a reversal continuation pattern within the MMC framework. We’ve seen:
📉 Initial drop (accumulation phase)
🎭 Fake breakout (manipulation phase)
📈 Upcoming expansion (breakout phase)
All signs point to a high-probability move upward, especially if price confirms with BOS + retest. Be patient, wait for price action to align with structure and volume clues.
BUYRejection Level
Daily Volume
Market Structure Shift
London US Session
Trend Line Break
Untapped Order Point

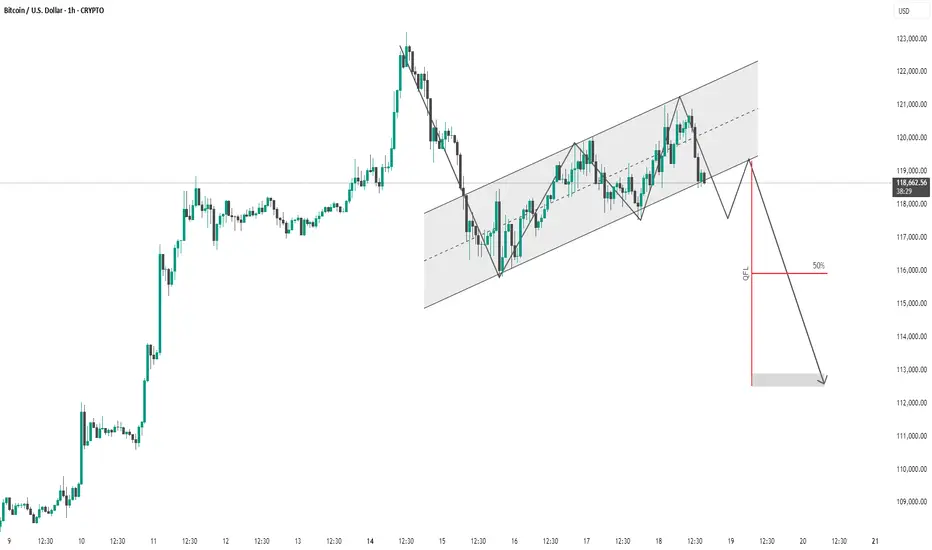
BTC #1-hour chart of Bitcoin (BTC/USD)This is a 1-hour chart of Bitcoin (BTC/USD) with a clear bearish outlook indicated by the analysis:
Key Observations:
Rising Channel:
Price has been moving inside an ascending channel.
Currently testing the lower boundary, suggesting potential for a breakdown.
Price Projection:
A sharp drop is anticipated after breaking the channel, supported by the downward black arrows.
The analyst anticipates a retest of the lower boundary followed by a rejection and continuation downward.
QFL Strategy Reference:
"QFL" (Quick Fingers Luc strategy) is marked with a red line, identifying a key support zone that price may break below.
50% level (retracement or zone midpoint) is noted for confluence.
Target Zone:
Final target appears to be in the $112,500 – $113,000 range.
Summary:
The chart presents a bearish thesis expecting BTC to break the ascending channel and fall toward a previous demand zone marked by the QFL level. The structure supports a short setup if the lower trendline fails to hold.
Risk Note: This is a speculative forecast; always confirm with volume, broader market context, or confirmation patterns.
thank u
BTC intra?
Hi
Do you know?
www.investopedia.com
If your initial plan is BUY.. whatever reasons: Fundamental/ outlook buy
We'll take this trade; reason
Two Yeses : Outlook BUY Pattern BUY
How will it react?
Answer: I don't know
High probability : Yes
Where do you enter? Your preference
wait retrace or now... just
If you wait.. might not get the ticket
If calculate between entry and stop loss: pips
And divide by what you re risking in $ to pips
All the best

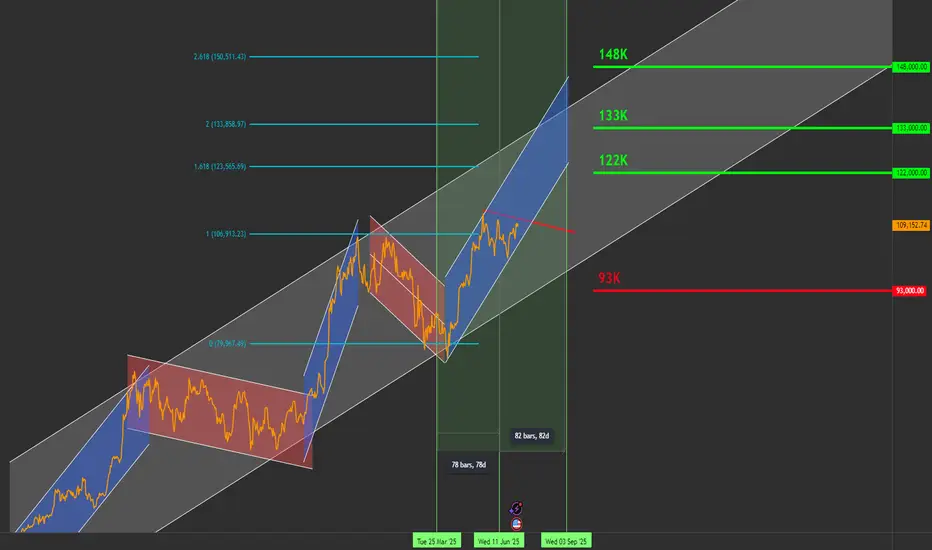
Bitcoin Roadmap to $144K by September – Daily Chart Breakout SetHello traders,
I'm sharing my current outlook on Bitcoin using the daily timeframe. Price is ~109K below a key descending trendline (in red), which has defined the structure since 21 May.
🔍 Key Levels to Watch:
Resistance: $111,000
Support: $91,000
Current Price: ~$109,000
⚡ Breakout Scenario:
If Bitcoin closes above $111K on the daily chart, backed by strong volume (ideally 30% above the 20-day average), I expect the next targets to unfold as:
✅ $122,000
✅ $133,000
✅ $144,000
🗓️ Target date for $144K: Around 22 September 2025
This projection is based on a pivot structure I’m tracking:
🟢 25 March 2025: Pivot low at ~$84K
🔴 12 June 2025: Pivot high
🟡 Expected pivot high: ~4 September 2025 (if symmetry holds)
This pattern suggests a 1-2-3 formation that could lead to a breakout move.
🧯 Failure Scenario:
If BTC fails to break out, I’m watching for a pullback toward the $91K support zone.
🛑 Current Stance:
I’m not in a position yet. Waiting for a daily candle close above $111K with volume confirmation and momentum indicators.
📣 Stay Updated
I’ll be sharing daily updates as the price action evolves.
Follow me here on TradingView, and feel free to share your analysis or ask questions in the comments!
🏷️ Hashtags:
#BTCUSD #BitcoinAnalysis #CryptoTrading #BTC #TechnicalAnalysis #SwingTrade #BreakoutSetup
Let me know your comments.
BTC Next Move within 11-15 DaysBTC will hit $62,528.74 Within 11-15 Days
The historical trend suggests that once Bitcoin (BTC) surpasses the $50,000 threshold, it typically enters a bullish phase, experiencing significant gains. This observation is based on past market behavior, where crossing this key price point has often led to increased investor confidence and subsequent price surges.

Bitcoin Strategic Compression Beneath the Cloud Gate.⊣
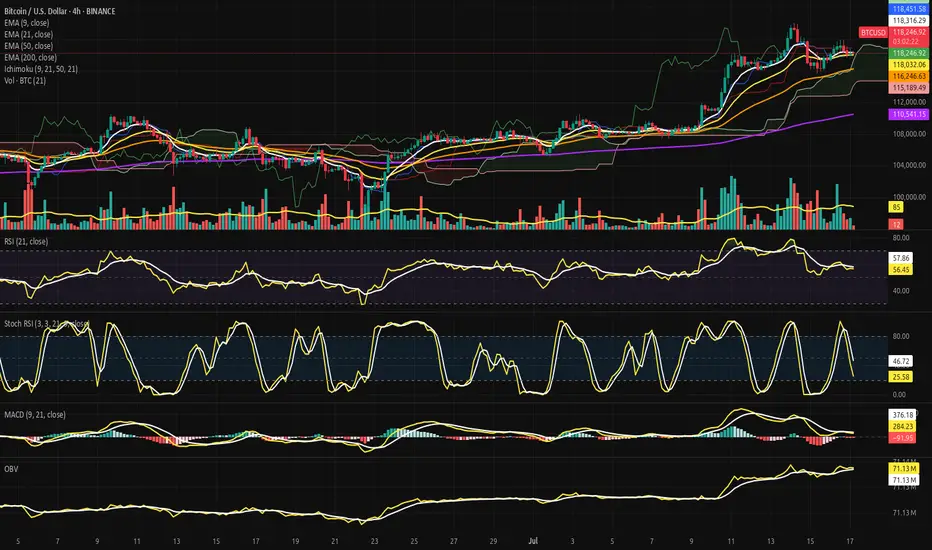
⟁ BTC/USD - BINANCE - (CHART: 4H) - (July 17, 2025).
◇ Analysis Price: $118,099.62.
⊣
⨀ I. Temporal Axis - Strategic Interval – (4H):
▦ EMA9 - (Exponential Moving Average - 9 Close):
∴ EMA9 is currently positioned at $118,286.83, marginally above the current price of $118,099.62;
∴ The slope of the EMA9 has begun to turn sideways-to-downward, indicating loss of short-term acceleration;
∴ The price has crossed below EMA9 within the last two candles, suggesting an incipient rejection of immediate bullish continuation.
✴️ Conclusion: Short-term momentum has weakened, positioning EMA 9 as immediate dynamic resistance.
⊢
▦ EMA21 - (Exponential Moving Average - 21 Close):
∴ EMA21 is measured at $118,018.67, positioned slightly below both price and EMA9, indicating a recent tightening of trend structure;
∴ The slope of EMA21 remains positive, preserving the medium-range bullish structure intact;
∴ EMA21 has been tested multiple times and held as support since July 15 - confirming tactical reliability as dynamic floor.
✴️ Conclusion: EMA21 stands as a critical pivot zone; any sustained breach would denote structural stress.
⊢
▦ EMA50 - (Exponential Moving Average - 50 Close):
∴ EMA50 is currently located at $116,240.85, well below current price action;
∴ The curve maintains a healthy positive inclination, affirming preservation of broader intermediate trend;
∴ No contact or proximity to EMA50 over the last 20 candles - indicating strong bullish detachment and buffer zone integrity.
✴️ Conclusion: EMA50 confirms medium-term bullish alignment; not yet challenged.
⊢
▦ EMA200 - (Exponential Moving Average - 200 Close):
∴ EMA200 stands at $110,539.69, forming the base of the entire 4H structure;
∴ The gradient is gradually rising, reflecting accumulation over a long time horizon;
∴ The distance between price and EMA200 reflects extended bullish positioning, yet also opens risk for sharp reversion if acceleration collapses.
✴️ Conclusion: Long-term structure remains bullish; early signs of overextension exist.
⊢
▦ Ichimoku Cloud - (9, 21, 50, 21):
∴ Price is currently above the Kumo (cloud), placing the pair within a bullish regime;
∴ Tenkan-sen (conversion) and Kijun-sen (base) lines show narrowing separation, suggesting momentum compression;
∴ Senkou Span A > Span B, and the cloud ahead is bullishly twisted, though thinning - indicating potential vulnerability despite structural advantage.
✴️ Conclusion: Bullish regime intact, but loss of momentum and cloud compression warrant caution.
⊢
▦ Volume + EMA21:
∴ Current volume for the latest candle is 3 BTC, compared to the EMA21 of 84 BTC;
∴ This indicates an extremely low participation phase, often associated with distribution zones or indecisive consolidation;
∴ Previous impulsive candles (July 15) reached well above 100 BTC - the current contraction is stark and strategically significant.
✴️ Conclusion: Absence of volume threatens trend continuation; energy depletion apparent.
⊢
▦ RSI - (21) + EMA9:
∴ RSI (21) is positioned at 55.73, marginally above neutral zone;
∴ EMA 9 of RSI is 57.71, crossing downward against RSI - bearish micro signal;
∴ No divergence is present versus price action - oscillator confirms current stagnation rather than exhaustion.
✴️ Conclusion: RSI losing strength above neutral; lacks momentum for breakout, but no capitulation.
⊢
▦ Stoch RSI - (3,3,21,9):
∴ %K is 21.44, %D is 45.34 - both pointing downward, in deacceleration phase;
∴ Recent rejection from overbought zone without full reset into oversold - signaling weak bullish thrust;
∴ Historical cycles show rhythmical reversals near current levels, but only with supportive volume, which is absent now.
✴️ Conclusion: Short-term momentum failed to sustain overbought breakout - micro-correction expected.
⊢
▦ MACD - (9, 21):
∴ MACD line is at -104.80, Signal line at 268.16 - large separation, histogram deeply negative;
∴ The bearish crossover occurred with declining volume, implying fading momentum rather than aggressive sell-off;
∴ No bullish divergence formed yet - continuation of correction remains technically favored.
✴️ Conclusion: MACD confirms trend exhaustion; no reversal in sight.
⊢
▦ OBV + EMA 9:
∴ OBV is 71.13M, perfectly aligned with its EMA9 - indicating equilibrium in volume flow;
∴ No directional bias in accumulation or distribution - flatlining suggests passive environment;
∴ Prior OBV uptrend has stalled since July 15 - reinforcing narrative of hesitation.
✴️ Conclusion: Institutional flow is neutral; no aggressive positioning detected.
⊢
🜎 Strategic Insight - Technical Oracle: The current price structure presents a classic post-impulse compression configuration within a preserved bullish environment. Despite the higher timeframe alignment, multiple short-term indicators exhibit tactical dissonance and signs of momentum decay. This inconsistency reflects a market caught between structural optimism and tactical hesitation.
♘ Key strategic signals - Structural Alignment:
∴ All major EMA's (9, 21, 50, 200) remain stacked in bullish order with no bearish crossovers imminent;
∴ Price remains above the Ichimoku Cloud and above EMA50 - both confirming structural dominance by buyers.
♘ Momentum Degradation:
∴ RSI (21) is drifting below its EMA9, weakening the momentum required for further upside continuation;
∴ Stochastic RSI has rolled over aggressively, failing to reach oversold before reversing - mid-cycle weakness is confirmed.
♘ Volume Collapse:
∴ The current volume profile is critically weak - 3 Bitcoin against an average of 84 Bitcoins (EMA21);
∴ Price attempting to sustain above EMA's with no conviction signals distribution or passivity.
♘ MACD & OBV:
∴ MACD histogram remains deep in negative territory, and no bullish crossover is visible;
∴ OBV is flat - neither accumulation nor distribution dominates, leaving directional thrust suspended.
✴️ Oracle Insight:
∴ The technical field is Structurally Bullish, but Tactically Compressed.
∴ No breakout should be expected unless volume decisively returns above baseline (84 Bitcoins EMA);
∴ Below $117,800, the structure risks transition into a corrective phase;
∴ Above $118,450, potential trigger zone for bullish extension if accompanied by volume surge.
♘ Strategic posture:
∴ Wait-and-observe regime activated;
∴ No entry condition satisfies both structure and momentum at present;
∴ Tactical neutrality is advised until confirmation.
⊢
∫ II. On-Chain Intelligence - (Source: CryptoQuant):
▦ Exchange Reserve - (All Exchanges):
∴ The total Bitcoin reserves held on all exchanges continue a sharp and uninterrupted decline, now at ~2.4M BTC, down from over 3.4M in mid-2022;
∴ This downtrend has accelerated particularly after January 2025, with a visible drop into new lows - no accumulation rebound observed;
∴ Historically, every prolonged depletion of exchange reserves correlates with structural bullish setups, as supply becomes increasingly illiquid.
✴️ Conclusion: On-chain supply is structurally diminishing, confirming long-term bullish regime intact - mirrors technical EMA alignment.
⊢
▦ Fund Flow Ratio - (All Exchanges):
∴ Current Fund Flow Ratio stands at 0.114, which is well below historical danger thresholds seen near 0.20-0.25 during local tops;
∴ The ratio has remained consistently low throughout the 2025 uptrend, indicating that on-chain activity is not directed toward exchange-based selling;
∴ Spikes in this indicator tend to precede local corrections - but no such spike is currently present, reinforcing the notion of non-threatening capital flow.
✴️ Conclusion: Capital is not rotating into exchanges for liquidation - volume weakness seen in 4H chart is not linked to sell intent.
⊢
▦ Miners' Position Index - (MPI):
∴ The MPI sits firmly below the red threshold of 2.0, and currently ranges in sub-neutral levels (~0.5 and below);
∴ This suggests that miners are not engaging in aggressive distribution, and are likely retaining Bitcoin off-exchange;
∴ Sustained low MPI readings during price advances confirm alignment with institutional and long-term accumulation behavior.
✴️ Conclusion: Miner behavior supports structural strength - no mining-induced supply pressure present at this stage.
⊢
🜎 Strategic Insight - On-Chain Oracle:
∴ Across the three strategic indicators, no on-chain evidence supports short-term weakness;
∴ Supply is declining - (Exchange Reserve ↓);
∴ Funds are not preparing for exit - (Flow Ratio stable);
∴ Miners are not selling - (MPI subdued).
✴️ This constellation reinforces the thesis of Structural Bullishness with Tactical Compression, and suggests that any pullback is not backed by foundational stress.
⊢
𓂀 Stoic-Structural Interpretation:
∴ The multi-timeframe EMA stack remains intact and aligned - (9 > 21 > 50 > 200);
∴ Price floats above Ichimoku Cloud, and above EMA21 support, confirming elevated positioning within a macro bull channel;
∴ On-chain metrics confirm supply contraction, miner retention, and absence of fund rotation toward exchanges - structure remains sovereign;
∴ RSI - (21) slips under its EMA9 with low amplitude, indicating absence of energetic flow;
∴ Stoch RSI fails to reset fully and points downward - suggesting premature momentum decay;
∴ MACD histogram remains negative, while volume is significantly beneath EMA baseline (3 BTC vs 84 BTC);
∴ Price faces resistance at Kijun-sen ($118.451), acting as tactical ceiling; no breakout signal detected.
⊢
✴️ Interpretatio Finalis:
∴ Structural integrity remains unshaken - the architecture is bullish;
∴ Tactically, however, the battlefield is fogged - silence reigns in volume, hesitation in oscillators;
∴ A true continuation requires volume resurrection and resolution above $118,450. Until then, neutrality governs the edge.
⊢
⧉
Cryptorvm Dominvs · ⚜️ MAGISTER ARCANVM ⚜️ · Vox Primordialis
⌬ - Wisdom begins in silence. Precision unfolds in strategy - ⌬
⧉
⊢