Analysis Btc 120K!Based on momentum and other technicals BITSTAMP:BTCUSD Is having some problems being in a Low volume node needing to through FVG in 15 min, 4 hr time frame. My personal bias is long but we have to break structure.
BTCUSD trade ideas

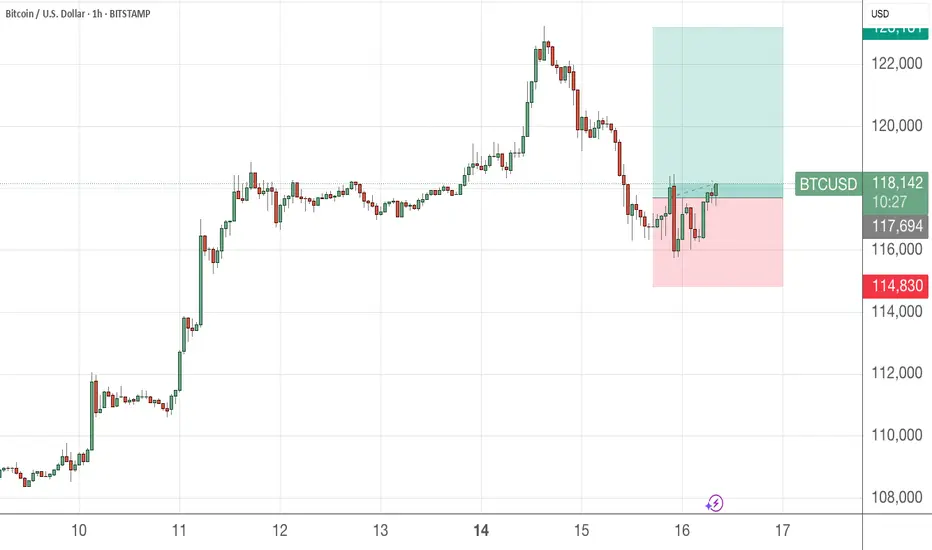
Bitcoin long from 114kWaiting for cme gap to close at that region.
We also have a fvg . Looking for longs.
Continuation higher is a must.

Bitcoin Price Prediction and TimelineThe Chart clearly shows everything. 100 days remain until the top. about 240000-260000

Bitcoin: Boundaries of Progression (Dual Aspect)Structure Source
Modification:
Extending fibonacci ratios: x.146 and x.886 to define missing levels (Fibs express probabilistic "layers")
Dual top curves to define boundaries if price continues traveling further up with its distinctive progression.

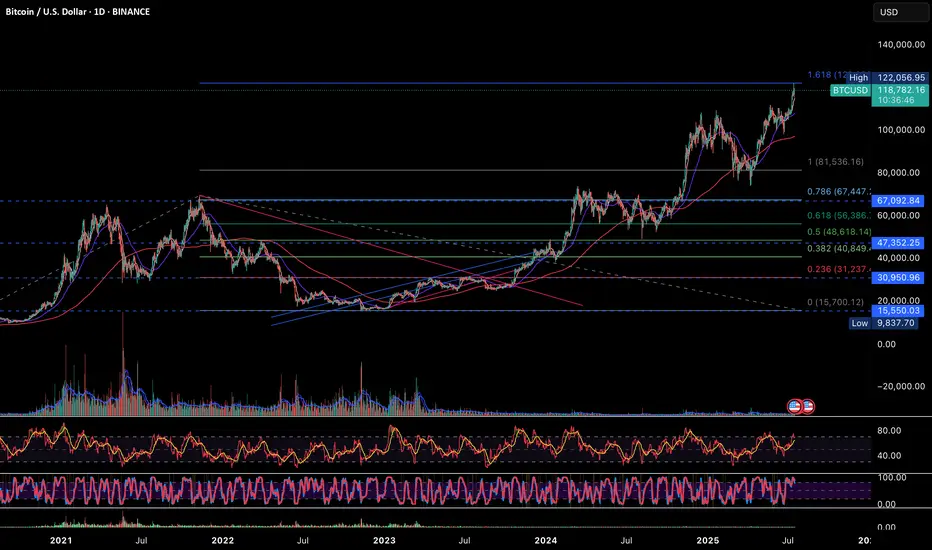
BTC Hits Predicted 1.618 Fibonacci Target at $122K — What’s Next🎯 BTC Hits Predicted 1.618 Fibonacci Target at $122K — What’s Next?
📅 Posted on: July 16, 2025
📍 Ticker: BTCUSD (BINANCE)
✍️ Author: @darwas121
⸻
🔹 Summary
In October 2023, I shared a long-term bullish projection for Bitcoin (BTC/USD) targeting the 1.618 Fibonacci extension level — projected around $122,000. As of today, BTC has successfully hit this target, validating the Fibonacci-based wave structure and bull market thesis. Now the key question is — what’s next?
⸻
🧠 Prediction Recap (Oct 2023)
• ✅ Projected rally continuation based on wave structure + Fibonacci expansion
• ✅ Long-term target: $122,056 (1.618 Fib level)
• ✅ Based on swing low near $15,550 and prior ATH structure
• ✅ Conditions: Confirmed breakout above $81,500
⸻
🔍 Current Technical Analysis (1D Chart)
💰 Price Action
• Current Price: $118,701
• Recent High: $122,056 (exact 1.618 Fib hit)
• Structure: Parabolic breakout from previous consolidation range
🔺 Fibonacci Levels
Level Price (USD)
0.236 31,237
0.382 40,849
0.5 48,618
0.618 56,386
0.786 67,092
1.0 (ATH Zone) 81,536
1.618 ✅ 122,056 (Hit)
📉 RSI & Momentum
• RSI is hovering in the overbought zone (>70), signaling potential cooling-off
• Stochastic RSI also indicates overextension — a pause or retracement could follow
• No bearish divergence yet, but watch closely
📊 Volume Trends
• Volume has tapered during this leg up — possible early sign of buyer exhaustion
• Previous volume clusters between $56k–$67k now act as strong support
⸻
⚠️ What to Watch Next
Risk Factors Notes
Overbought RSI Suggests short-term pullback risk
Weakening Volume Caution: Less conviction in highs
Parabolic Structure Vulnerability Break could mean fast correction
⸻
🧭 My View & Strategy
🔹 Short-Term: ⚠️ Cautious
• Book partial profits if holding from lower levels
• Watch for reversal candles near $122k zone
• RSI divergence or low-volume rally = yellow flag
🔹 Mid-Term: 🔼 Bullish
• Buy-the-dip zones: $67k (0.786) and $56k (0.618)
• Any correction into these zones may offer re-entry
🔹 Long-Term: 🔼 Strong Bullish
• BTC is in confirmed macro uptrend
• Sustained close above $122k opens price discovery zone
• Next logical Fib projection zones: $135k–$150k
⸻
📌 Key Levels
• Support: $81,536 / $67,092 / $56,386
• Resistance: $122,056 → Break = price discovery
• Invalidation Zone: Breakdown below $81,000 on volume
⸻
📣 Conclusion
The technical roadmap laid out in 2023 has now played out — Bitcoin has achieved its 1.618 Fibonacci extension target. We are now at a critical inflection point. If BTC consolidates well here and maintains volume, the next leg could launch us into new all-time highs beyond $135,000.
🛑 But caution is warranted — overbought signals + weak volume could bring a healthy correction first. Stick to your risk plan. Let the market come to you.
⸻
💬 Feel free to share your views or ask for updates in the comments.
🔔 Follow me for more swing-to-position analysis using volume, fibs & structure.
📊 Chart shared below for reference.
#Bitcoin #BTCUSD #Crypto #TechnicalAnalysis #Fibonacci #PriceTargets #CryptoForecast #ParabolicMove #BTC
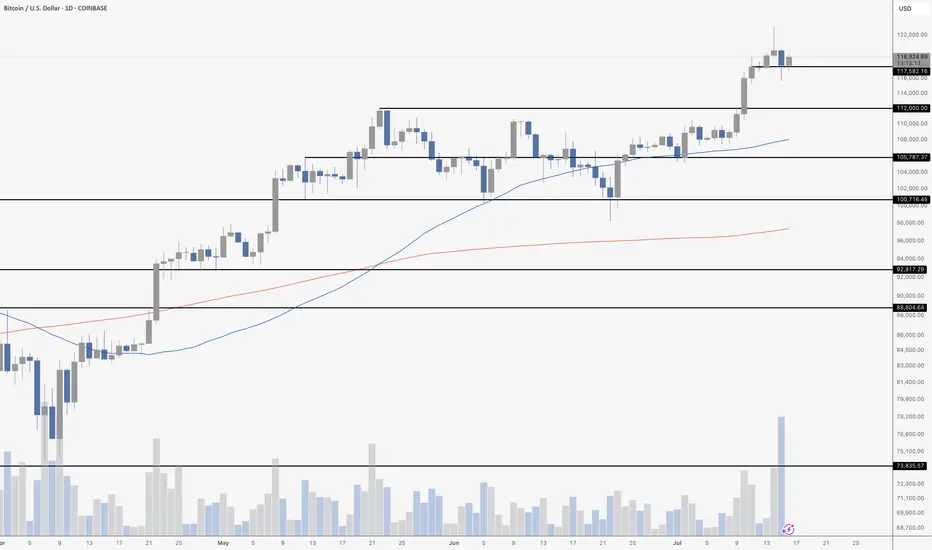
Bitcoin Dips On High VolumeThe Bitcoin daily chart paints a nuanced picture following Tuesday’s pullback – which came on the highest volume day since the $74K bottom in mid‑April, specifically on Coinbase. But notably, that surge in volume was primarily driven by selling, not buying – a key detail that shifts the tone of the candle.
Despite the aggressive downward move, price found support around $116,000 and recovered into the close, finishing the day above $117,000. However, the heavy sell volume behind that move suggests it wasn’t just a casual dip – it was real distribution.
That said, bulls showed resilience on Wednesday, pushing price back toward $119,000 and defending the key $116,000–$118,000 zone. If Bitcoin can maintain this level and digest the selloff without rolling over, it may absorb the supply and build a base for continuation.
But traders should stay cautious – high‑volume sell days near local highs can sometimes mark short‑term tops or signal a shift in momentum. The $112,000 breakout zone remains the critical downside level to watch if the current range fails.
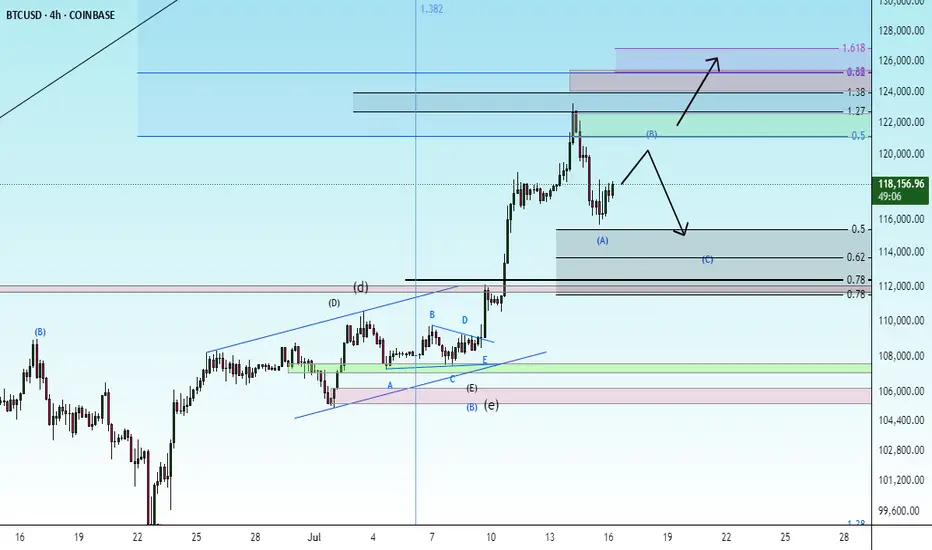
correctionGiven the completion of the current upward trend, the corrective pattern is expected to move along the specified path and go to the specified Fibonacci levels. Then the continuation of the upward trend will be possible.
BITCOIN High after High going for the Cycle Top!Bitcoin (BTCUSD) made a new All Time High (ATH) today, just north of $123000 and shows absolutely no signs of stopping there!
The brilliantly structured 2.5-year Channel Up (blue) that has been dominating the entirety of the current Bull Cycle since the November 2022 market bottom, has been on its latest Bullish Leg since the April 07 2025 rebound on the 1W MA50 (blue trend-line).
The 1W MA50 has been the Cycle's natural Support level since the March 13 2023 bullish break-out, never broken after, just like it has been for the 2019 - 2021 Bull Cycle (excluding of course the Black Swan event of the March 2020 COVID crash).
In fact the similarities of the whole 2022 - 2025 Cycle are strong with the 2018 - 2021 Cycle. Similar Bear Cycles of -80% on average, followed by strong Lower Highs break-outs and subsequent consolidations within the 0.786 - 0.618 Fibonacci range, takes us to today with the April 2025 1W MA50 bounce resembling the July 2021 one.
Eventually, that Bullish Leg led to the Cycle's Top a little above the 1.618 Fibonacci extension. The market seems to be only one step away of completing that past pattern and if it does, BTC may hit $170000 before the Cycle peaks.
Do you think that is a likely scenario after today's new fresh ATH? Feel free to let us know in the comments section below!
-------------------------------------------------------------------------------
** Please LIKE 👍, FOLLOW ✅, SHARE 🙌 and COMMENT ✍ if you enjoy this idea! Also share your ideas and charts in the comments section below! This is best way to keep it relevant, support us, keep the content here free and allow the idea to reach as many people as possible. **
-------------------------------------------------------------------------------
💸💸💸💸💸💸
👇 👇 👇 👇 👇 👇

Adding a bit more to BTCUSDPlease see day and 1H chart , all bullish
This digital asset whether you believe it is productive and generates cash flow or not, please put 1-3% of your capital to it. Buy and keep long term , avoid trading unless you like volatility.
BTC 1W RSIThe BTC 1W RSI is on the verge of breaking above the down sloping trend. Once above it, the sky is the limit. The question is, when will it happen and how high will it go?
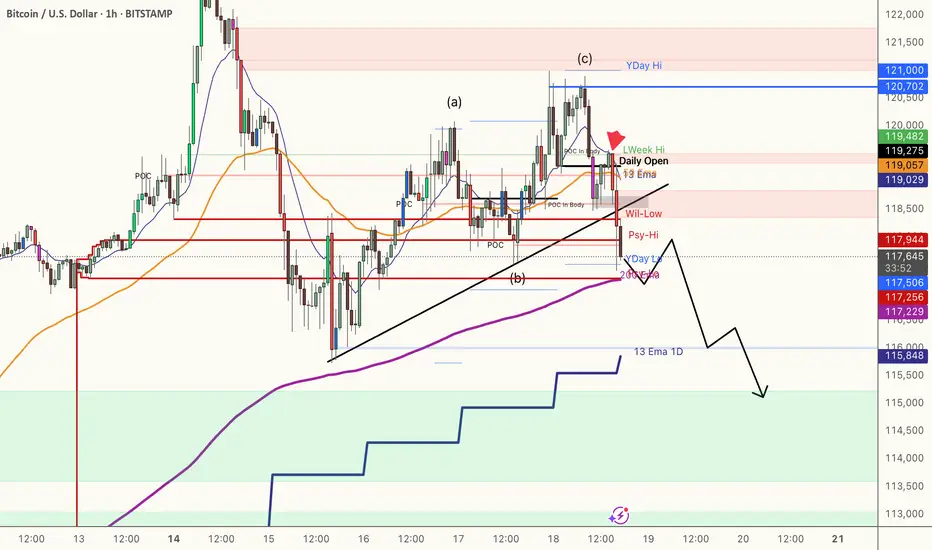
BTCUSD - Smart Money Trap Before the Next Move?1. Market Structure & BOS (Break of Structure):
We can observe multiple BOS levels around July 10–12, signaling a strong bullish transition.
2. Break of Structure (BOS)
Definition: BOS occurs when price breaks above a previous swing high with conviction.
Application on Chart: The BOS on July 11 marked the continuation of bullish market structure.
This indicated strong buying pressure, often driven by institutional order flow.
📉 3. Fair Value Gap (FVG)
Definition: A Fair Value Gap is an inefficiency or imbalance in the market where price moves too quickly, skipping potential orders.
On Chart: The FVG is present between July 11–12.
Expectation: Price often returns to these zones to “rebalance” or mitigate orders before continuing the trend.
Educational Note: FVGs act as magnet zones and are often used to identify entry points or liquidity pools.
💧 4. Liquidity Sweep
Definition: A liquidity grab occurs when price spikes above a recent high or low to trigger stop-loss orders before reversing.
On Chart: Just above resistance, a liquidity grab took place.
Purpose: Institutions often sweep liquidity before large moves to fill larger orders.
🔹 Resistance & Supply Zone:
The resistance area between 122,150–123,500 has held firmly, causing a notable correction.
This region aligns with institutional order blocks, suggesting potential smart money selling.
🔹 Support & Demand Zone:
The nearest support zone lies at 115,984, marked by previous consolidation and BOS.
Price is likely to revisit this zone, acting as a retest for demand re-entry, providing a strong buy-side opportunity if confirmed.
🔹 Current Price Action:
BTC is consolidating around 119,253, with a possible liquidity sweep above short-term highs.

Bitcoin Forecast 🔁 I use a unique time-based cycle method built around the universal law of 3-6-9:
3 = Impulse wave
6 = Correction
9 = Cycle end
we are at the higher time frame cycle 9
each cycle of the 3, 6 ,9
contain a smaller one 3 ,6 , 9
This isn’t just about charts — the number 9 governs all natural cycles:
Pregnancy, learning, lunar cycles, economic growth, etc.
---
🗓️ These are the key monthly turning points I track every year:
> Jan 8 – Feb 7 – Mar 6 – Apr 5 – May 5 – Jun 4 – Jul 2 – Aug 1 – Aug 31 – Oct 30 – Nov 29 – Dec 6
📍 This month, July 2nd was a critical time pivot. From there, Bitcoin entered a new time cycle.
📌 Time Is More Powerful Than Price
Most traders focus on price action, waves, or indicators…
But the reality? Time is the real market driver.
⏳ Entry signals based on time outperform those based on price.
Why? Because price is a reaction — time is the cause.

BTCUSD shortAfer breaking the corrective ABC structure, we will at least move bearish forward the previous low. We could see a bigger corrective structure
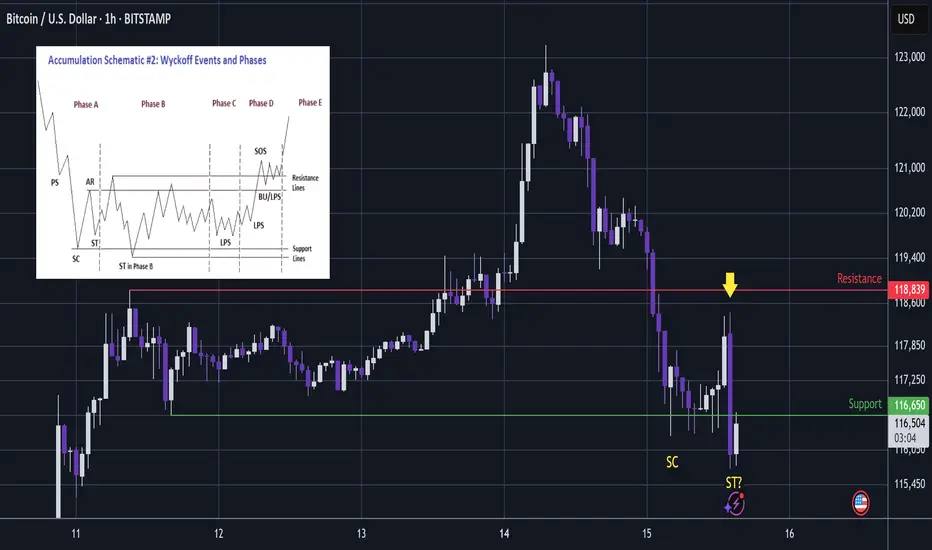
BTC - Capitulation. Now Time For A Bounce?Whenever there is a big impulsive rally, dumb money will come rushing in to buy.
And thus we can somewhat expect the market maker to print a shakeout for them to exit at best price and dumb money to carry the bags at worst price.
...
In this area we have multiple charts providing the liquidity zones for the shakeouts:
The upside shakeout (long wick) printed on TOTAL through ATH:
...
Before I make the next point, lets see the design of the chart bots 10 years ago in 2015.
Notice that the high and low of the trading range is set by the impulsive high then initial slump:
That sets the trading range.
Once set; the chart bots then print a liquidity sweeping slightly higher high...
Which slumps back to liquidity sweep the lows of the trading range.
From there the next wave up begins.
...
Now notice in these charts from the last 2 days, that the trading range was similar to that of 2015.
But once the range was set; rather than printing a simple slightly higher high, the more evolved chart bots printed a wild impulsive move up to draw in buyers.
This then became a very impulsive smackdown.
...
Although going on a wild journey, the price is effectively similar to the pattern of 2015; liquidity sweep at the highs and now it is below the low.
Notice on these 2 charts from the last two days that the support that Bitcoin has hit today was the obvious trading range low - similar to 2015.
And so the question is now; whether it will also be a liquidity sweep at the lows and a bounce will follow?
Notice on the chart, there was a big smackdown and then we have had another fast smackdown (arrow) to take price beneath the lows.
This looks very much like a fear test - where the chart bots try to sell you another immediate capitulation, but yet the price holds in the zone of higher liquidity below support.
Wyckoff would call these 2 lows SC Selling CLimax and ST Secondary Test.
The selling climax completes the real bearish wave down.
Secondary Test is the probe into higher liquidity which is a fear test to scare longs away.
...
So if we consider that history may not repeat, but it does rhyme then there will likely be a bounce in this area - as the market maker gets best price for their short positions while dumb money panic sell their long positions at a loss.
Not advice
BTCUSD | 1W Time Frame | BITSTAMP ExchangeI have been using curve analysis for Bitcoin on the weekly time frame for a long time, employing two indicators: My BTC Log Curve and Bitcoin Logarithmic Growth Curves, of course, with my own custom settings to achieve maximum harmony with price movements. I recommend that to gain a precise understanding of Bitcoin curve analysis, you search for and study it, and make use of the two free indicators mentioned above.
Bitcoin finally managed to break free from the curve floor in the second week of September 2023, initiating a logical and gradual upward trend. Currently, it is supported by a significant level around $84,000 (keeping in mind that this rate will gradually increase due to the market's floating nature). However, the most critical price ceiling for Bitcoin in the current bullish market trend is approximately $154,000. Given the acceptable momentum of the current upward trend, reaching this price target seems reasonable. Nevertheless, we should anticipate a corrective reaction from the market, considering the historical behavior in this price range.
In summary, it can be stated that for mid-term holders, the price target of $154,000 appears to be a realistic and attainable goal, while the price floor of $84,000 serves as a very suitable level for buying and re-accumulating.

"Bitcoin Bearish Setup: Breakdown Targeting 117,509"This Bitcoin (BTC/USD) 45-minute chart shows a bearish setup with key levels marked. After a breakdown from the support area, price is expected to drop. The suggested short entry is just below 119,639, with a stop loss at 120,984 and a target at 117,509. The chart highlights an order block, support area, and projected downward move.

Btcusd techinical analysis.Btcuad techinical analysis next move posibale at h1 time frame.not finchinical advice.

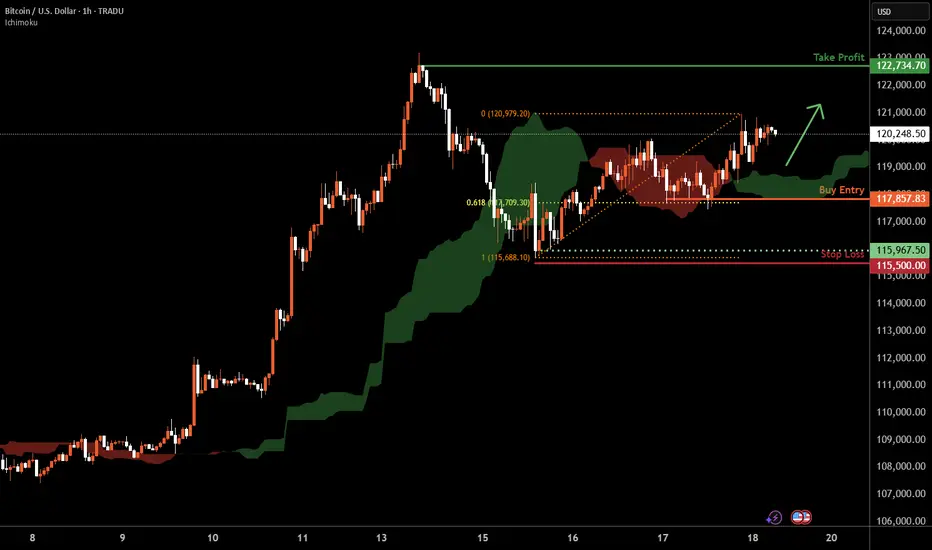
Bitcoin H1 | Falling toward a 61.8% Fibonacci supportBitcoin (BTC/USD) is falling towards a swing-low support and could potentially bounce off this level to climb higher.
Buy entry is at 117,857.83 which is a swing-low support that aligns with the 61.8% Fibonacci retracement.
Stop loss is at 115,500.00 which is a level that lies underneath a swing-low support.
Take profit is at 122,734.70 which is a swing-high resistance.
High Risk Investment Warning
Trading Forex/CFDs on margin carries a high level of risk and may not be suitable for all investors. Leverage can work against you.
Stratos Markets Limited (tradu.com ):
CFDs are complex instruments and come with a high risk of losing money rapidly due to leverage. 66% of retail investor accounts lose money when trading CFDs with this provider. You should consider whether you understand how CFDs work and whether you can afford to take the high risk of losing your money.
Stratos Europe Ltd (tradu.com ):
CFDs are complex instruments and come with a high risk of losing money rapidly due to leverage. 66% of retail investor accounts lose money when trading CFDs with this provider. You should consider whether you understand how CFDs work and whether you can afford to take the high risk of losing your money.
Stratos Global LLC (tradu.com ):
Losses can exceed deposits.
Please be advised that the information presented on TradingView is provided to Tradu (‘Company’, ‘we’) by a third-party provider (‘TFA Global Pte Ltd’). Please be reminded that you are solely responsible for the trading decisions on your account. There is a very high degree of risk involved in trading. Any information and/or content is intended entirely for research, educational and informational purposes only and does not constitute investment or consultation advice or investment strategy. The information is not tailored to the investment needs of any specific person and therefore does not involve a consideration of any of the investment objectives, financial situation or needs of any viewer that may receive it. Kindly also note that past performance is not a reliable indicator of future results. Actual results may differ materially from those anticipated in forward-looking or past performance statements. We assume no liability as to the accuracy or completeness of any of the information and/or content provided herein and the Company cannot be held responsible for any omission, mistake nor for any loss or damage including without limitation to any loss of profit which may arise from reliance on any information supplied by TFA Global Pte Ltd.
The speaker(s) is neither an employee, agent nor representative of Tradu and is therefore acting independently. The opinions given are their own, constitute general market commentary, and do not constitute the opinion or advice of Tradu or any form of personal or investment advice. Tradu neither endorses nor guarantees offerings of third-party speakers, nor is Tradu responsible for the content, veracity or opinions of third-party speakers, presenters or participants.

July 14 Bitcoin Bybit chart analysisHello
It's a Bitcoin Guide.
If you "follow"
You can receive real-time movement paths and comment notifications on major sections.
If my analysis was helpful,
Please click the booster button at the bottom.
This is a Bitcoin 30-minute chart.
There is no separate Nasdaq indicator announcement.
Nasdaq upper gap reversal condition and
Bitcoin is moving sideways after a sharp rebound until the afternoon.
I created today's strategy based on the vertical decline condition based on the 5-minute trend reversal in Tether Dominance.
On the lower left, I connected the long position entry section of 117,451.1 dollars that I entered on the 11th.
* In the case of the red finger movement path,
This is a one-way long position
current position chase purchase strategy.
1. Chasing purchase at 121,897.1 dollars / Stop loss price when the green support line is broken
2. 124,639.5 dollars long position 1st target -> Good, Great in order of target price
Since I left a simulation in the middle,
I think it would be good to use it for re-entry after liquidating the long position.
The movement within the 1st section at the top and the 2nd section at the bottom
is an extreme sideways movement, and from a long position,
if it succeeds in rebounding within the 2nd section, it becomes a strong upward condition.
From the 3rd section breakout today,
the low point is broken in the newly created weekly and daily chart candles this week,
so please note that the upward trend may be delayed.
The next support line is the Gap8 section created last week.
Up to this point, I ask that you simply refer to and utilize my analysis
and I hope that you operate safely with principle trading and stop loss prices.
Thank you.

Bitcoin’s Incoming Bear Market!🚀 Bitcoin’s Bullish Phase: The Final Push Before the Fall?
Bitcoin is currently in the parabolic uptrend phase of its halving cycle, with price action closely following historical patterns. Since the last halving on April 15, 2024, Bitcoin has mined approximately 42,480 blocks, pushing the market closer to the 70,000-block threshold where the trend historically reverses into a deep bear market.
Based on historical patterns, Bitcoin’s next major bull market peak is expected around 150,000 USD, approximately 70,000 blocks post-halving (projected for August 2025). However, investors must prepare for what follows—a severe bear market fuelled by miner capitulation.
🔥The 70,000-Block Bearish Reversal: Why It Happens Every Cycle
1. The Mining Difficulty Trap & Rising Costs
Bitcoin’s mining difficulty adjusts every 2,016 blocks (~2 weeks) to maintain the 10-minute block interval.
As BTC price surges in the bull market, more miners join the network, driving competition and difficulty higher.
This raises mining costs and squeezes profit margins, making it harder for smaller miners to stay afloat.
✅ Bull Market (~0-70,000 Blocks Post-Halving)
High BTC prices offset increased difficulty, allowing miners to hold rather than sell.
Low sell pressure from miners keeps Bitcoin in an uptrend.
❌ Bear Market (~70,000 Blocks Post-Halving)
After BTC peaks, prices decline but difficulty remains high.
Mining costs remain constant, while block rewards drop.
Weaker miners can’t afford to mine at a loss and are forced to sell their BTC holdings to cover operational expenses.
2. The Snowball Effect: How Miner Capitulation Triggers a Crash
Once inefficient miners begin selling, a chain reaction unfolds:
1️⃣ Bitcoin price starts declining after the cycle peak (~12-18 months post-halving).
2️⃣ Miners struggle to remain profitable due to high difficulty and lower block rewards.
3️⃣ Miners begin offloading BTC to cover expenses, increasing supply in the market.
4️⃣ More BTC supply leads to further price drops, triggering panic selling.
5️⃣ Additional miners shut down operations, selling off reserves, further flooding the market.
6️⃣ Capitulation accelerates, causing a cascading effect similar to leveraged liquidations seen in past bear markets.
🔄 This cycle repeats until enough miners exit, difficulty adjusts downward, and BTC stabilizes.
3. Historical Proof: How Miner Capitulation Has Marked Every Bear Market
Each Bitcoin bear market aligns with major miner capitulation events. Here’s how past cycles have played out:
📌 2012 Halving: Bull top in late 2013, miner capitulation in 2014, BTC fell -80%.
📌 2016 Halving: Bull top in late 2017, miner capitulation in 2018, BTC fell -84%.
📌 2020 Halving: Bull top in late 2021, miner capitulation in 2022, BTC fell -78%.
📌 2024 Halving: Expected bull top in late 2025, miner capitulation likely in 2026?, BTC decline TBD but estimated to be around -60%.
🔹 In all cases, BTC topped ~70,000 blocks after the halving, followed by a deep drawdown driven by miner capitulation.
🔹 The selling pressure from miners perfectly aligns with the start of major market crashes.
4. The Accumulation Phase: What Follows the Crash?
After miners capitulate and difficulty adjusts downward, Bitcoin enters a sideways accumulation phase (~140,000-210,000 blocks post-halving).
Weaker miners have already exited, reducing sell pressure.
Surviving miners adjust to lower rewards and stop mass selling BTC.
Smart money (whales & institutions) begin accumulating at undervalued prices.
The MVRV ratio drops below 1, signalling a market bottom.
Bitcoin stabilizes, setting the stage for the next bull cycle.
This predictable recovery cycle lays the groundwork for Bitcoin’s next exponential rally into the next halving period.
The Bitcoin Bear Market Prediction for 2025-2026
✅ Bitcoin is currently on track to peak near ~$150,000 around 70,000 blocks post-halving (August 2025).
✅ Following this, BTC is expected to enter its bear market, with prices potentially falling to ~$60,000 (by December 2026).
✅ The primary catalyst for this crash will be miner capitulation, just as it has been in every prior cycle.
Final Thoughts
If history repeats, the Bitcoin market is set to follow a sharp parabolic rise to ~$150,000 before undergoing a 70,000-block miner-driven selloff into a multi-month bear market. Investors should be aware of this pattern and plan accordingly.
Sources & Data Validation
The insights presented in this article are based on historical Bitcoin price cycles, on-chain analytics, and mining difficulty trends from various sources, including:
Blockchain Data (Glassnode, CoinMetrics)
Historical BTC Halving Data (Bitcoin Whitepaper, Blockchain Explorers)
Market Analysis Reports (Messari, Arcane Research)
Macroeconomic Influences (Federal Reserve Reports, Global Liquidity Cycles)
Disclaimer: Not an Investment Recommendation
This article is for informational purposes only and should not be considered financial or investment advice. Bitcoin and cryptocurrency markets are highly volatile, and past performance is not indicative of future results. Conduct your own research and consult with a financial professional before making any investment decisions.

BTCUSD H4 Potential DropHi there,
BTCUSD H4: As long as the 85,119.33 level holds, the overall trend remains bullish in a larger scope.
Currently, the price is trading below the diagonal dotted trendline. The further it stays below this trendline, the stronger the bears' position.
The level of 101,574.21 is open for a bias towards 93,511.35.
Happy Trading,
K.
Not trading advice.

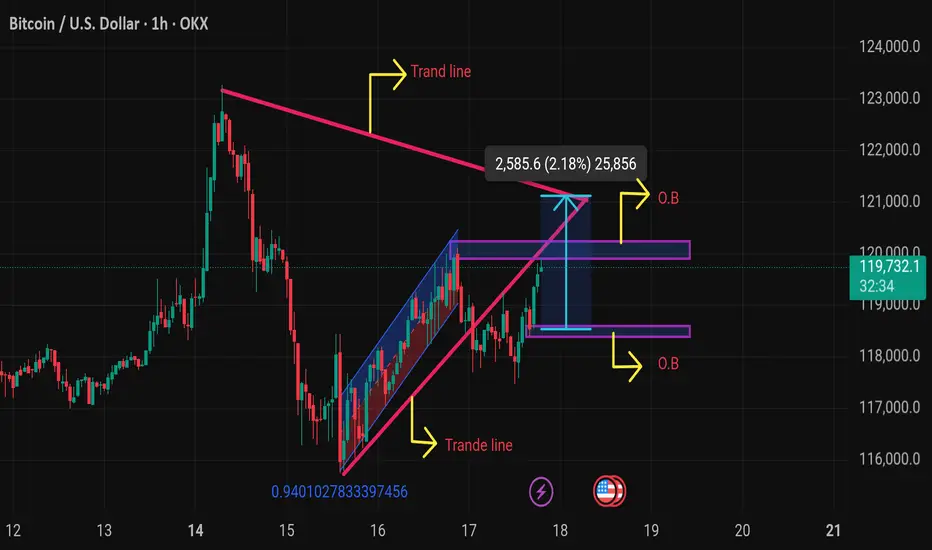
Btcusd techinical analysis.The chart shows a BTC/USD (Bitcoin vs. US Dollar) technical analysis on the 1-hour timeframe. Here's a detailed breakdown:
---
🔍 Chart Elements & Interpretation:
1. Trend Lines:
Upper Pink Trend Line: Acts as a resistance from a previous high.
Lower Pink Trend Line: Represents a support line from the recent upward trend.
Blue Channel: Shows a rising wedge or ascending channel (often a bearish reversal pattern).
2. O.B (Order Blocks):
Upper O.B Zone (~120,000–121,000): Potential supply zone or area of resistance.
Lower O.B Zone (~117,500–118,500): Possible demand zone or support.
3. Price Projection:
A measured move of 2,585.6 points (2.18%) is marked upward from the current breakout attempt.
4. Current Price:
BTC is trading at $119,771.8, with a +0.90% increase at the time of this chart.
---
🧠 Technical Outlook:
Bullish Case:
Breakout above the upper trend line and clearing the upper O.B could lead to a continuation toward 122,000+.
If BTC respects the demand zone and bounces, the uptrend may resume.
Bearish Case:
Failure to break above resistance or rejection at