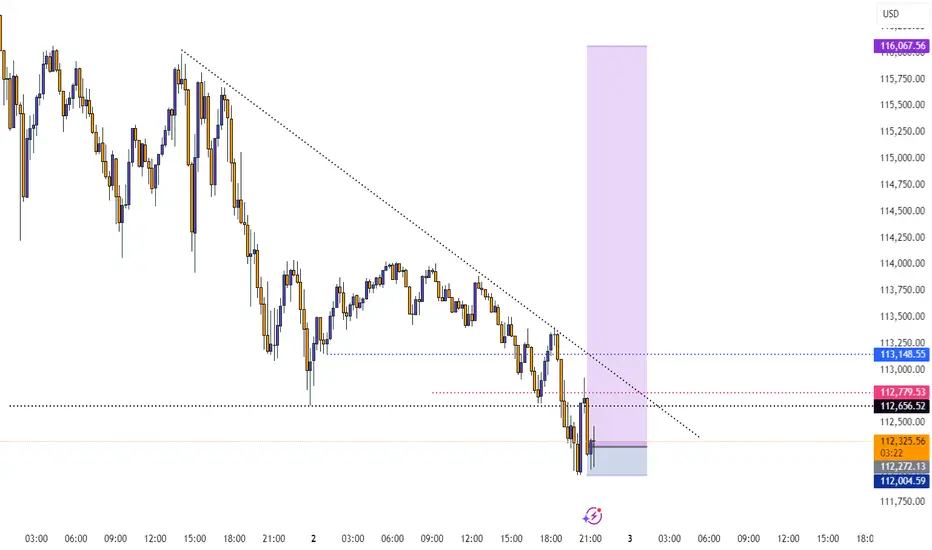
Btc outlook A simple outlook on Bitcoin
A corrective sell-off to gain some momentum.
The yellow zone is crucial and must hold without being broken.
BTCUSD trade ideas

Inflection Zone, Do or Die levelI've drawn up a couple of major pivot points that I expect BITSTAMP:BTCUSD to consolidate at before continuing either up or down.
The market is in my opinion currently feeling a little bit confused and not quite fearful yet but a little bit doubtful anyway. The melt up has been real, and for some painful, as directional movement is at most only half of what matters. So this injection of volatility is welcomed at least by me, and I've been fairly exposed to growth stocks in my port lately.
Based on fibonacci phi channels and other confluences of support locations, it looks like we've turned a corner and are on the way down, but I'd be surprised if we breached 107k and as shown, if that did happen, there is a LOT of underlying supply.
I don't know where we go from here but I wanted to point out this level highlighted in light blue, as its historically been a major line in the sand for BTC.


BTC/USD has formed a symmetrical triangle pattern on the 1-hour Price has broken downwards from the consolidation zone, signaling potential bearish momentum. If selling pressure continues, the projected target aligns with the measured move from the pattern’s height, indicating a possible decline toward the next major support zone. Traders should monitor volume for confirmation and manage risk accordingly.

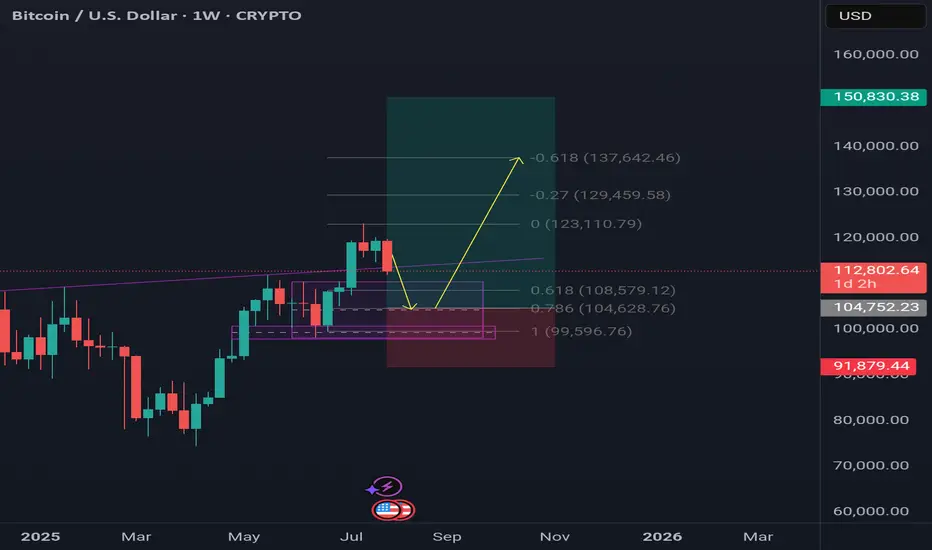
Bitcoin send it higher . I think btc will stop around 104k region amd then it will continue to give us another leg higher.It is not over yet , it still has to offer us another upside movememt.
Lets send it higher.
BTC/USD 1D Chart 🔼 Resistance:
• USD 123,263 - local peak, strong resistance (green line)
• USD 119,120 - level tested several times, recent reflection
• 116,224 USD - zone of previous consolidations
🔽 support:
• 110,945 USD - SMA #2 (movable average), tested in the past
• 107,804 USD - local hole
• USD 103,542 - strong support from the past (historical retention of declines)
⸻
📊 Technical indicators
📉 Trend:
• The yellow upward trend line has been broken - a potential bull weakness signal.
• The candle pierces the trend line from the bottom - it is possible to change the direction to a side or downward trend.
📈 Medium walking (SMA):
• The red SMA #1 line acted as dynamic resistance.
• The price is currently testing SMA #2 as support.
• SMA #5 (blue, approx. 98,600 USD) is very strong long -term support.
📉 Macd:
• The MacD line is below the signal line → Bear signal (Bearish).
• Red histogram - inheritance impetus is growing.
📉 RSI:
• RSI has fallen below the level of 50 → the advantage of supply.
• Currently, it is approaching the supply of supply overload (<30), which can herald the technical reflection.
⸻
🔮 Scenarios
✅ Scenario Bycza (Bullish):
• Maintenance of a price above 110.945 USD (SMA #2).
• Return above the trend line or testing USD 116,224 and piercing up.
❌ Bear scenario (Bearish):
• Loss of support to 110.945 USD → decrease to USD 107,800.
• If this does not keep the course, the next strong level is USD 103,500.
⸻
🧠 Applications:
• Short -term: the market looks weak, the candle breaks the upward trend.
• Medium -term: still in the game, but if it does not reflect from the current levels, a greater correction is possible.
• Commercial decisions: It is worth waiting for confirmation of the direction (reflection from support or continuation of declines).


BTC at Make-or-Break: Rejection or Liftoff to $130K?
Bias/Summary
BTC is at a critical zone between 109K–112K. Price is currently showing hesitation after initial rejection at the Yearly L3 (112K), and I’m leaning short unless we see a strong breakout and hold above that level. However, if bulls reclaim it, we could see a fast move to 130K before many can react.
Technical Context:
Yearly L3 sits around the $112K zone – a historically significant level.
Price faced rejection at $112K and is now hovering near $109K.
Lower timeframe showing indecision, possible bearish bias.
Watching for:
Rejection + lower high below $112K = short setup.
Clean breakout + retest of $112K = shift to long bias.
Trade Idea / Setup:
🟥 Scenario A – Short Bias (Current Leaning):
Entry: 110K–111.5K (if rejection confirms)
Stop Loss: Above 112.5K
Targets:
TP1: 104K
TP2: 99K
TP3: 94K
R:R: Up to 3.5:1 depending on entry and target
🟩 Scenario B – Breakout Long (Contingent Setup):
Entry: 113K+ (after breakout and solid retest)
Stop Loss: Below 111K
Targets:
TP1: 120K
TP2: 130K
R:R: ~3:1 or more if momentum confirms
Risk & Patience Reminder:
⚠️Let price lead. No breakout = no long. No clear rejection = no short. Wait for confirmation, and don’t force entries in the chop.
Patience > Prediction.
NFA. DYOR. Manage your risk.

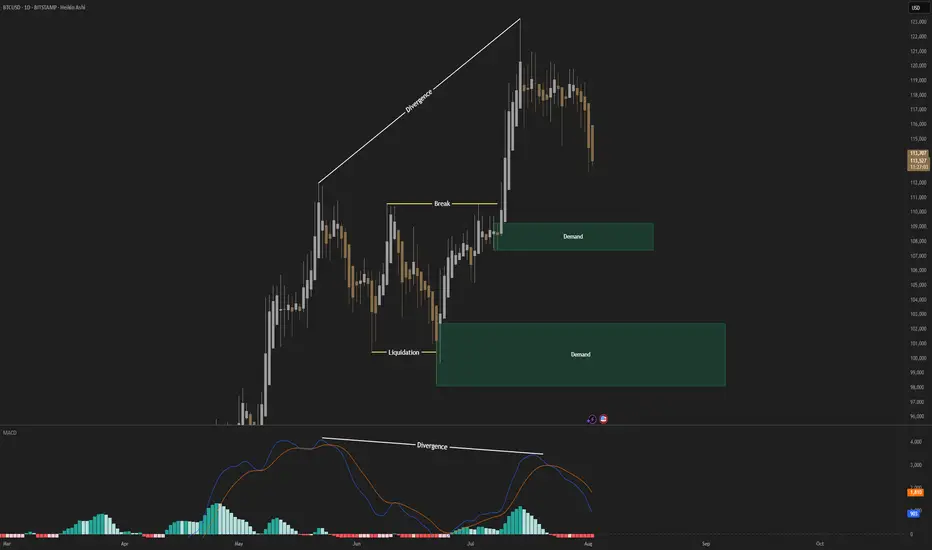
Downtrend to trendsupportHey guys, i this is my prediction for bitcoin. I believe it will drop to my trend support and become a resistance. If it goes below that it would turn into a ranged market and no longer be a trend anymore. Also, once the downtrend is over, it would hit my demand area. I do have some old analytics on this chart, i assumed it would be an uptrend a while ago, but as soon as it went beyond my buy area, i knew it might be a breakout.

"BTC Sweeps Liquidity – Eyeing 115K Reclaim?""BTC Sweeps Liquidity – Eyeing 115K Reclaim?"
🔍 Technical Analysis – BTC/USD
On the 1H chart, Bitcoin (BTC) is currently displaying a textbook smart money structure, with price action following key institutional footprints.
🔑 Key Observations:
Liquidity Grab at Weak Low
Price dipped below the local support (~112,500), sweeping sell-side liquidity and tapping into a possible reversal zone.
Rejection from Demand Zone (Support Area)
A strong reaction occurred right at the support level, suggesting buyer interest is still present.
Order Block & Fair Value Gap
A visible Fair Value Gap (FVG) sits above current price action, aligning with an Order Block near the 115,000 level — this is a key magnet for price to rebalance.
Target Zone
Immediate upside target is 115,000, where an order block lies. If price reaches that level, expect potential short-term resistance or reversal.
Break of Structure (BOS) Confirmations
Multiple BOS and CHoCHs indicate bearish-to-bullish attempts, but the current structure still needs confirmation above 113,500+ for bullish continuation.
🧠 Conclusion & Expectation:
BTC has swept liquidity to the downside and may now seek to fill the FVG and revisit the 115K order block. However, confirmation is required — watch for bullish engulfing candles, volume spikes, or a CHoCH above 113,500.
“Smart money doesn’t chase — it waits for liquidity, then repositions. BTC may be following the same script.”


BTC / BNB Buying opportunityBTC is near equal leg from all-time high, as the dollar index is pulling back, and BTCis on an Equal leg, along with BNB supporting upside possibility
BTC Entry: 111300
SL: 105100
Target: 124000
Risk: Reward - 1:2
BNB Entry: 720
SL: 660
Target: 900
Risk: Reward - 1:3
Watch my YouTube video for detailed analysis

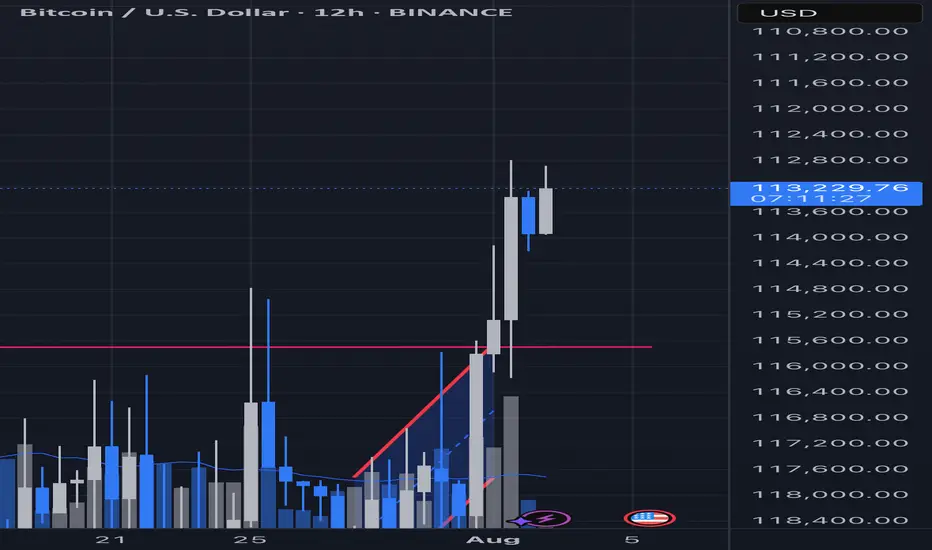
Bitcoin beginning a 12 hour reversal formation?(Inverse chart)I believe we are working on a top (bottom) of this 12 hour chart. If I am right this will result in a swing fail and begin a string reversal
btcwow...!!!!!!!
btc have negative divergence in weekly time and it can be start down trend or correction trend
this analyse is not 100% true but it can probebly

Corection?Frankly, I'm confused. The 4-hour trend is broken, and there's a possibility of a bad weekly candlestick... A correction down to the lower channel is likely for a while. Of course, 2% fluctuations are possible.

Bitcoin Structure in Stillness, Power in Silence, Just Control?⊣
⟁ BTC/USD - BINANCE - (CHART: H1) - (Aug 02, 2025).
◇ Analysis Price: $113,869.77.
⊣
⨀ I. Temporal Axis - Strategic Interval - (1H):
▦ EMA9 - ($113,889.32):
∴ The price is trading just below the EMA9, which acts as immediate reactive resistance;
∴ The short-term slope remains negative, with no breakout signal;
∴ Buyers are unable to push the price above this threshold, indicating technical weakness.
✴️ Conclusion: Momentum remains capped; the EMA9 has not been reclaimed.
⊢
▦ EMA21 - ($113,896.52):
∴ The EMA21 stands as a tactical compression line in this range;
∴ The close proximity of EMA9 and EMA21 forms a technical knot - indecision zone;
∴ Past rejections in this region reinforce it as a powerful barrier.
✴️ Conclusion: Mid-range resistance holds; continuation is blocked unless breached with volume.
⊢
▦ EMA50 - ($114,128.22):
∴ EMA50 defines the current macro resistance on the 1H chart;
∴ The price has yet to test this level directly after the last drop;
∴ For structural recovery, this line must be broken cleanly with follow-through.
✴️ Conclusion: Primary obstacle on the path to reversal - decisive zone.
⊢
▦ BB (21 + EMA9) - Status: Compression:
∴ Bands are tightening around the price, signaling low volatility;
∴ Price action is contained within the central channel;
∴ Indicates upcoming volatility spike - direction still unknown.
✴️ Conclusion: Volatility compression is active; no directional bias confirmed.
⊢
▦ Volume + EMA21 - (3.84 BTC):
∴ Trading volume remains below the EMA21 period average;
∴ No surge of bullish commitment visible;
∴ Momentum lacks conviction without participation.
✴️ Conclusion: Absence of volume undermines the strength of any move.
⊢
▦ RSI (21, 9) - (42.37):
∴ RSI hovers in the lower neutral band - weak momentum;
∴ Slight upward curve suggests a modest rebound;
∴ No divergence or strength signal confirmed.
✴️ Conclusion: Minor relief rally underway - structurally weak.
⊢
▦ MACD (9, 21, 9) - (MACD: -238.89 / Signal: -340.58):
∴ Bullish crossover confirmed, histogram positive;
∴ Both lines remain in bearish territory - (below zero);
∴ Trend momentum is building but not strong enough to reverse.
✴️ Conclusion: Technical rebound in play - not a structural shift.
⊢
▦ Stoch RSI (3, 3, 21, 9) - (%K: 58.90 / %D: 52.70):
∴ Positive crossover established and advancing in neutral-upper zone;
∴ No overbought signal;
∴ Possibility of further upside if confirmed with price action.
✴️ Conclusion: Oscillator supports continuation - contingent on volume.
⊢
▦ OBV (21, BB2) - (26.35K):
∴ OBV remains flat, indicating market indecision;
∴ No divergence with price movement;
∴ No fresh buying pressure detected.
✴️ Conclusion: Neutral volume behavior - flow not favoring bulls.
⊢
🜎 Strategic Insight - Technical Oracle:
∴ The 1H chart of (BTC/USD) reveals a battlefield sealed in compression and anticipation.
The price is locked beneath converging exponential resistances (EMA9, EMA21, EMA50), forming a triple entrenchment zone. None have been broken - each rejection reinforces the stronghold;
∴ The Bollinger Bands constrict like a ritual binding. Volatility is silent - too silent - awaiting the spark. Yet no participant steps forward with force; volume remains suppressed, showing that neither side has declared war;
∴ Momentum oscillators (RSI, Stoch RSI) hint at an upward drift, but these are echoes, not proclamations;
∴ The MACD crossover is not a trumpet - it is a murmur in the underworld, below the zero line, concealed from the living trend;
∴ The OBV confirms it: no one is entering the field with conviction. This is not a battlefield - it is a waiting room;
✴️ And yet, amidst this silence, the Code speaks:
∴ If the zone between ($114.1K and $114.6K) is breached with volume and confirmation, this will mark the first true structural challenge to the prevailing descent. If it fails - the repique folds into another trap, devoured by gravity.
⊢
∫ II. On-Chain Intelligence - (Source: CryptoQuant):
▦ Exchange Inflow Total + EMA9 - (All Exchanges) - (6.2K BTC):
∴ The total Bitcoin flowing into centralized exchanges remains subdued, with no signs of aggressive sell-side pressure;
∴ The EMA9 confirms a flat, low-intensity behavior, distinct from capitulation spikes;
∴ The absence of major inflows during price compression implies a strategic wait state.
✴️ Conclusion: No incoming threat detected - institutions are not preparing to sell.
⊢
▦ Exchange Netflow Total + EMA9 - (All Exchanges) - (-644.5 BTC):
∴ Netflow remains negative, indicating Bitcoin is being withdrawn from exchanges rather than deposited;
∴ A negative netflow during a price downtrend reflects silent accumulation behavior or rotation into cold storage;
∴ The EMA9 shows a consistent drainage pattern, not episodic outflow.
✴️ Conclusion: This confirms defensive posture by large holders - supporting the technical compression.
⊢
▦ Spent Output Profit Ratio - (SOPR) + EMA9 - (1.003):
∴ The SOPR hovers just above 1.0, suggesting coins moved on-chain are being sold at or near cost basis;
∴ No signs of aggressive profit-taking or panic selling - rather, equilibrium behavior;
∴ The 9-period EMA confirms stability in this zone.
✴️ Conclusion: Market psychology is suspended - no one is winning or losing.
⊢
🜎 Strategic Insight - On-Chain Oracle:
∴ All on-chain signals reflect preparation without declaration;
∴ No pressure enters, and no blood leaves;
∴ The field is not empty - it is coiled;
∴ Withdrawals - (Netflow) - suggest protective accumulation;
∴ Low Inflow signals no new panic supply;
∴ SOPR near 1.0 says: (We're all waiting - and none are ahead);
∴ The technical compression in price is not betrayed by the chain;
∴ The silence is consistent;
∴ But silence is not peace - it is a veil.
✴️ Conclusion: If volume does not breach $114.6K - all remains a ghost echo beneath resistance.
If broken - the coil unwinds.
⊢
⧉ III. Contextvs Macro-Geopoliticvs - Interflux Economicvs - (Aug 02, 2025):
⟁ All movements of the market's breath are influenced not only by price, nor volume, but by the tides beyond the chart. Here begins the reading of the outer realm:
▦ EVENTVM I - (Wall Street Silent Accumulation) - (U.Today + Coindesk):
∴ Institutional actors are actively acquiring BTC and ETH through stealth operations - not OTC spikes, but ETF inflows and treasury balance shifts;
∴ Tom Lee (Bitmine/Fundstrat) confirms: Wall Street is not waiting for clarity, it is accumulating in silence;
∴ SEC’s Project Crypto and “in-kind” ETF mechanisms further reduce friction for institutional entry.
✴️ Conclusion: Price stagnation conceals power transfer - retail hesitates while funds consolidate control.
⊢
▦ EVENTVM II - (SEC’s “Project Crypto” Activation):
∴ Regulatory framing under “Project Crypto” unfolds in phases: transparency, compliance infrastructure, and institutional bridges;
∴ Despite its regulatory mask, the program facilitates liquidity channels into crypto markets;
∴ Legalized ETF's now serve as strategic vacuum points for Bitcoin supply.
✴️ Conclusion: What appears as regulation is in fact an alignment mechanism - structure over rebellion.
⊢
▦ EVENTVM III - (July ETF Flows (US) - $12.8B Inflow):
∴ U.S.-based crypto ETF's report record-breaking $12.8 billion inflows in July alone;
∴ Largest flows tracked in BlackRock, Fidelity, and VanEck vehicles - no signs of reversal;
∴ These flows occurred during price weakness, not during breakout - a signature of accumulation.
✴️ Conclusion: The public hesitates while custodians act - the veil of weakness conceals a new floor.
⊢
🜎 Strategic Interpretation - Macro Context:
∴ The charts compress. The flows retract;
∴ But the outer forces converge - Wall Street is no longer watching. It is acquiring;
∴ Through structure, silence, regulation, and engineering of access;
∴ This is no longer the market of peer-to-peer rebellion;
∴ This is the codification of power into institutional hands;
✴️ Conclusion: Price may appear static - but ownership is shifting.
⊢
𓂀 Stoic-Structural Interpretation:
∴ The chart does not lie. The data does not beg. The market does not care. Bitcoin remains trapped beneath resistance - not by force, but by inaction, by lack of intention, by silent contest;
∴ On-chain signals whisper: no one is selling in panic, no one is buying in euphoria;
∴ The macro realm reveals: the hands of power are moving beneath regulation, using silence as shield;
∴ Thus we see a paradox - the technical shell compresses, the on-chain bloodstream circulates without fever, the macro structure redefines.
⚖️ The Stoic mind recognizes this not as chaos, but as necessary stillness.
∴ The Arcane practitioner does not chase a move - he maps the pressure points and waits;
∴ He acts only when the veil thins;
∴ To act prematurely is to violate the structure;
∴ To wait blindly is to betray the will;
∴ The Stoic Arcane path demands this: know the boundary, seal the insight, then act - once - with clarity;
∴ At ($114.6K) the veil may part. If it does not - the silence continues.
⊢
✦ Structure Bearish.
▦ This is a bearish containment, not a breakdown.
∴ The market is not collapsing - it is being held below by absence of volume, of intention, of structural reversal;
∴ The EMA's are stacked above like iron gates;
∴ The price has failed to break $114.6K - the veil remains intact;
∴ On-chain data confirms neutrality, not optimism;
∴ Macro signals suggest accumulation by institutions - but not defense for the public.
⊢
🜎 Therefore:
∴ Technically Bearish - (structure not yet reversed);
∴ Tactically Neutral to Bearish - (fragile repique);
∴ Strategically in Transition Phase - (institutions buying beneath silence).
✴️ Conclusion: Until ($114.6K) is broken with conviction, the structure remains bearishly biased - wrapped in stillness.
⊢
⧉
· Cryptorvm Dominvs · MAGISTER ARCANVM · Vox Primordialis ·
⚜️ ⌬ - Silence precedes the next force. Structure is sacred - ⌬ ⚜️
⧉
⊢

$76k incoming. Will Bitcoin de-couple from the altcoins? BTC.DCOINBASE:BTCUSD $76K incoming. Will Bitcoin de-couple from the altcoins? BTC.D

BTC; Heikin Ashi Trade IdeaAfter a correction, price may have a good reaction from first demand area I have marked.
Lower demand zone is even more valid, since we see manipulation and then impulsive move to the oposite side.
Btc / UsdtBITSTAMP:BTCUSD
"Bitcoin cleaned out the downside. Now all eyes on the untouched upside. Liquidity is a magnet — and BTC follows it."
Disclaimer : Not financial Advice


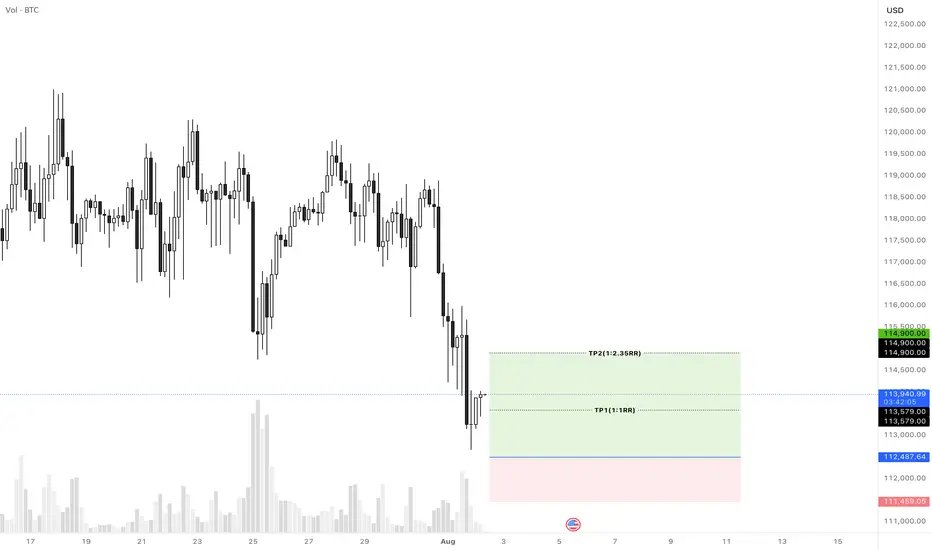
Bitcoin buy setupHi everyone.
I think this area has a good potential to set an order and take at least 1% profit out of it..
Let's see how it reacts to this level...
Please consider the risk management.
Goodluck
One of these lines will be right..I expect a pump in the next 2 days otherwise we will fall and continue on the next support line. Odds are 70/30
