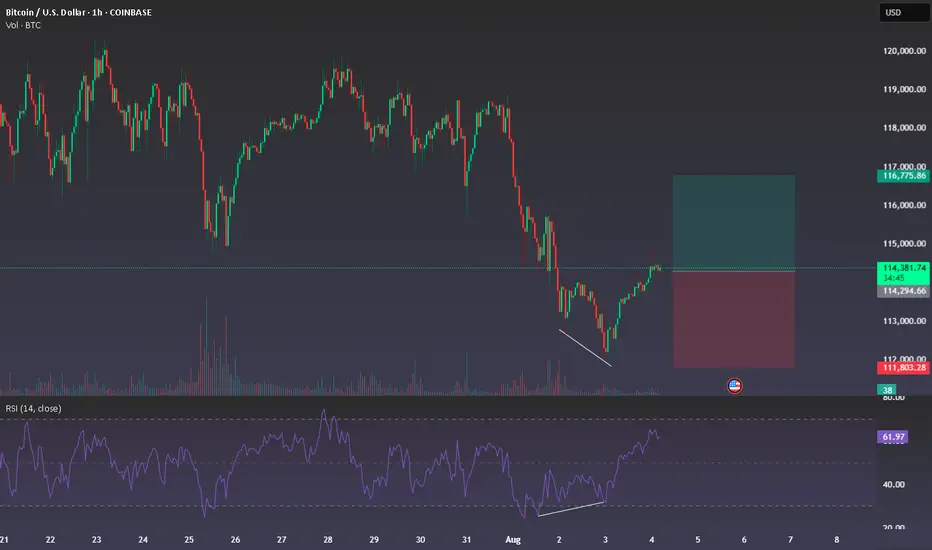
BTC Long – Bullish Divergence 1H Looking for long from 114300 zone
1H chart showing bullish divergence
also price broke short downtrend with nice momentum
Timeframe: 1H
Entry: 114300
Target (TP): 116850
Stop (SL): 111700
Only sharing my view, not any financial advise, thx
BTCUSD trade ideas
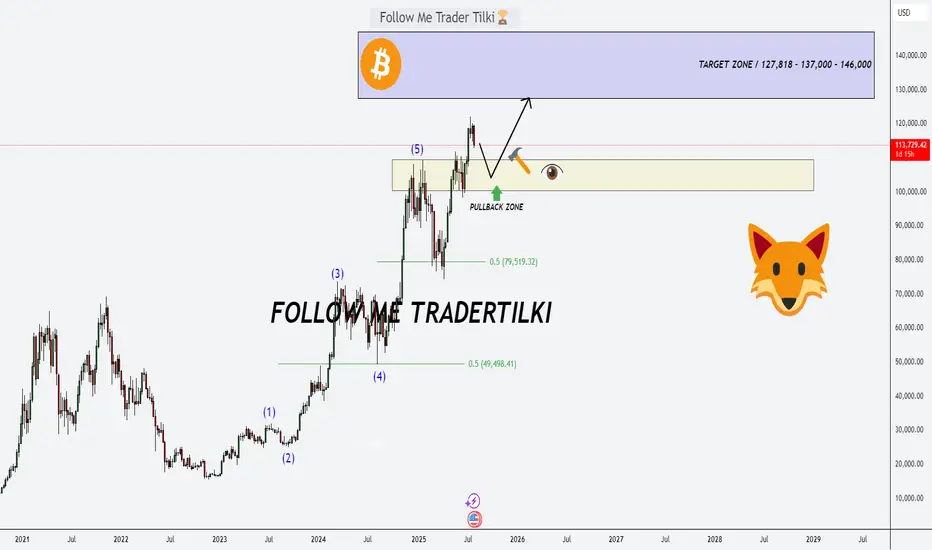
Bitcoin’s Game Has Changed: Fresh Support Zone, Targets Sky-HighHey Dear Friends,
Until recently, Bitcoin had been stuck in a range between 112,331 and 105,344 for quite some time. But that range has now been clearly broken. So, what does this mean? This zone, which used to act as resistance, is now expected to flip and act as support.
According to my weekly trading model, the long-term target levels I’m tracking for Bitcoin are: 127,818 – 137,000 – 146,000.
Since this is a weekly setup, it might take a while for these targets to play out. Even if we see pullbacks to the 112K, 105K, or even 100K levels, I expect to see strong buying pressure from that zone.
I’ll keep sharing regular updates as this setup develops.
To everyone who’s been supporting and appreciating my work—thank you, truly. Your encouragement means the world to me and keeps me motivated to keep showing up. Much love to all of you—I’m grateful we’re in this journey together.
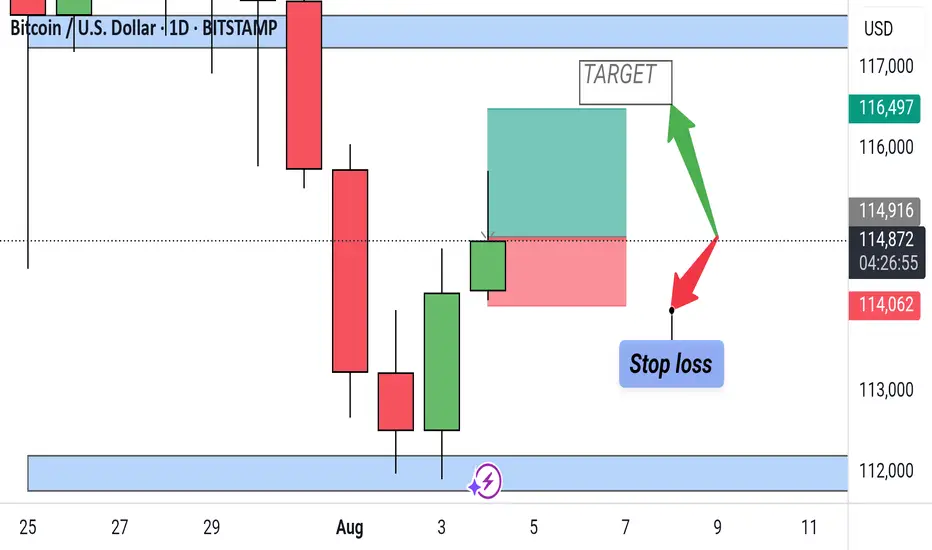
Bitcoin Bullish Reversal Setup – Daily TimeframeBTC/USD Daily Chart Setup
Price shows a bullish reversal from a demand zone, forming a potential long setup. Entry is near $114,873 with a target at $116,497 and a stop loss below $114,062. Green candle confirms buyer strength after previous downtrend.
BTC Double BottomFibonacci sequence is a mathematical concept; it appears in various aspects of everyday life and nature. It's not directly used in a calculated way, but its principles are reflected in the patterns we see around us. Its key for traders to pinpoint these reversal areas to keep a positive risk/reward ratio. Bulls will target 116k if this low can be sustained.

Bitcoin - The cycles are playing out!⚔️Bitcoin ( CRYPTO:BTCUSD ) just repeats another cycle:
🔎Analysis summary:
Following all of the previous all time high breakouts, Bitcoin will now further extend the rally. After some simple calculation, we can see that Bitcoin will rally another +50% in order to reach the overall price target. However there will be volatility along the way so make sure to remain calm.
📝Levels to watch:
$200.000
SwingTraderPhil
SwingTrading.Simplified. | Investing.Simplified. | #LONGTERMVISION

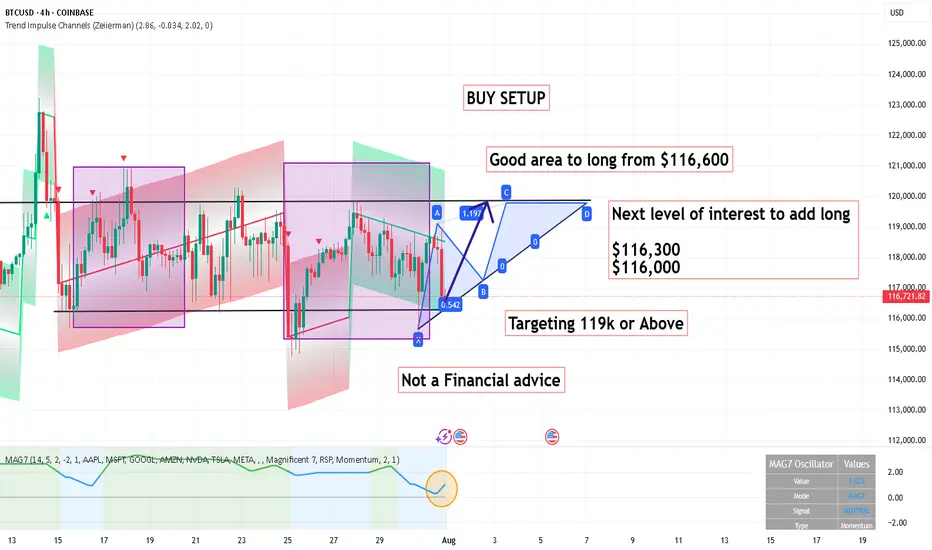
BUY SETUP ,Good area to long from $116,600BUY SETUP
Good area to long from $116,600
Next level of interest to add long
$116,300
$116,000
Targeting 119k or Above
Its not a Financial advice
BTCUSD Short (Update)BTCUSD is still short at this time. Summer has arrived in USA and Europe and the markets are stuck for a good directional trend.

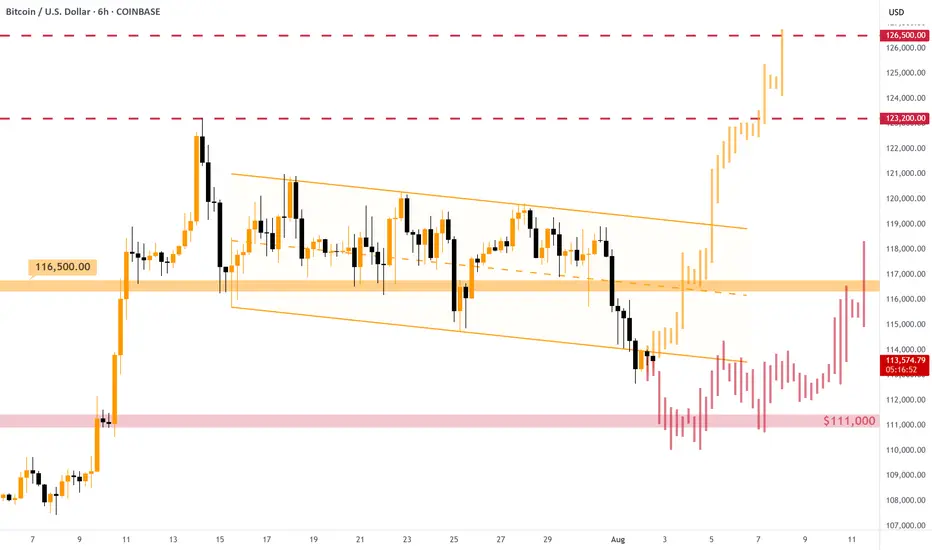
#BITCOIN - Short-Term Options [EXPLAINED]As expected, the price dumped below the descending channel , currently consolidating right below one's support level.
As expected, the price dumped below the descending channel , currently consolidating right below one's support level. On the chart I've described two possible options for the price movement: strictly positive and hmm.. okey.
Strictly positive: some consolidation below the support with, then quick retrace back inside the channel and new upward rally on the next working week. Entering LONG position will make sense after the breakout of the $116,500 resistance, not earlier.
Hmm.. okey: Bitcoin is not strong enough to come back inside the channel and dumps to $111,000 support level. Near this level we must see some consolidation to gather more power. Possible fakes down to $108,000. In some time (1 week+) we will have chances of going back up.
👉 Overall, the support of $111,000 is crucial right now. If we lose it, Bitcoin goes towards $100,000 and the current bullish phase might be considered as finished. For now we still have chances.
BTCUSD 8/1/2025Come Tap into the mind of SnipeGoat as he gives you a Full Top-Down Analysis of Bitcoins Price Action as we come into the month of August. What is Price doing? Where is Price going? Come get the answer here!
_SnipeGoat_
_TheeCandleReadingGURU_
#PriceAction #MarketStructure #TechnicalAnalysis #Bearish #Bullish #Bitcoin #Crypto #BTCUSD #Forex #NakedChartReader #ZEROindicators #PreciseLevels #ProperTiming #PerfectDirection #ScalpingTrader #IntradayTrader #DayTrader #SwingTrader #PositionalTrader #HighLevelTrader #MambaMentality #GodMode #UltraInstinct #TheeBibleStrategy

BTCUSD – bullish momentum is backBitcoin is making a strong comeback, breaking above short-term resistance and reestablishing its uptrend after a prolonged consolidation phase. The technical structure now shows clear control from the bulls, with higher highs and higher lows beginning to form.
Positive risk sentiment and growing expectations of capital flowing back into the crypto space—especially after a series of weak U.S. economic data—are fueling the current BTCUSD rally. If momentum holds, the next target could be the upper boundary of the price channel.
Keep an eye on how price reacts at key levels and trendlines — this might be the launchpad for the next bullish leg.
Good luck, and if you enjoyed this analysis, don’t forget to hit like and drop a comment!

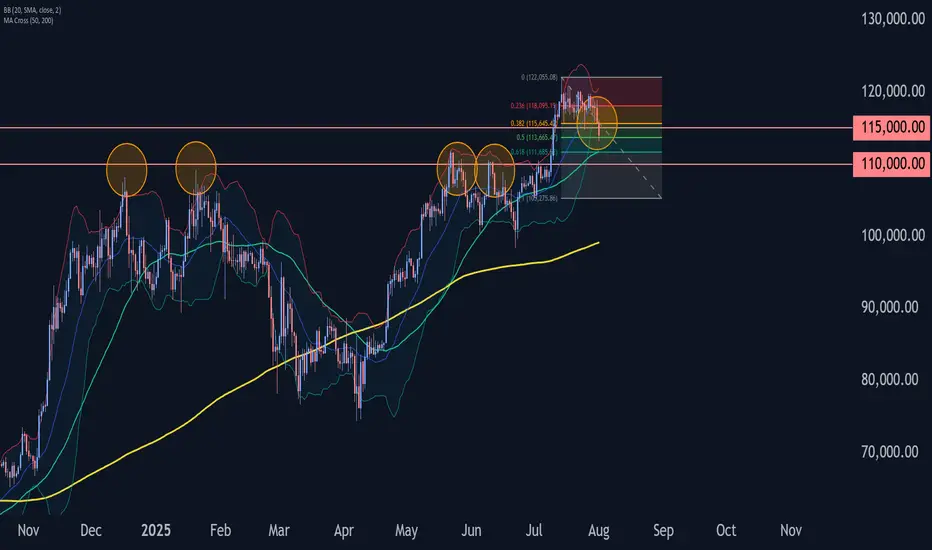
Bitcoin Wave Analysis – 1 August 2025- Bitcoin broke the pivotal support level 115000.00
- Likely to fall to support level 110000.00
Bitcoin cryptocurrency recently broke below the pivotal support level 115000.00, coinciding with the 50% Fibonacci correction of the sharp upward impulse from the start of July.
The breakout of the support level 115000.00 strengthened the bearish pressure on Bitcoin.
Given the bearish sentiment seen across the cryptocurrency markets today, Bitcoin can be expected to fall to the next support level at 110000.00 (former resistance from May and June).
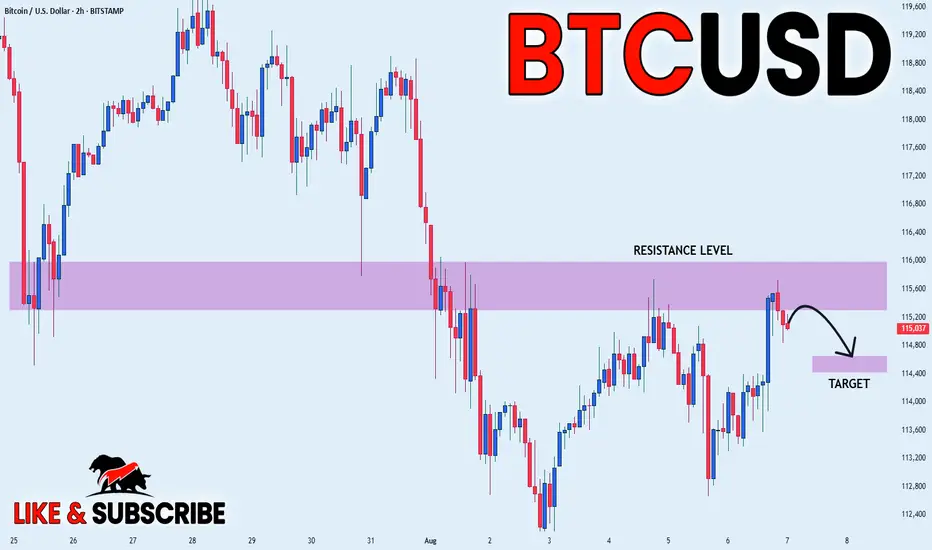
BITCOIN PULLBACK FROM SUPPLY AREA|SHORT|
✅BITCOIN price grew again
To retest the resistance of 116k
But it is a strong key level
So we are seeing a bearish reaction
And we will likely see a
Further bearish move down
SHORT🔥
✅Like and subscribe to never miss a new idea!✅
Elliott Wave Science: Bitcoin Steadily Chases $400KAfter some back and forth, I have located the needed confirmations to find high confidence that Bitcoin stretches toward the $400K mark by September-December 2026. I will continue to track the waves day by day, week by week, while applying the unbiased science of Elliott Wave Theory.

Bitcoin: Interconnectedness of Defining CyclesJust a followup analysis on scalable structure from "Natural Patterns & Fractal Geometry" ed idea.
Additional Regularities:
2018 Downtrend Phase Fib Resonation:
Fibonacci ratios are not just mathematical abstractions; they manifest in Bitcoin's market structure due to human behavior and market psychology.
2020 Uptrend Phase Fib Resonation:
Unconventional use of Fibonacci ratios highlights areas where price has shown significant reactions. These levels act as dynamic support and resistance zones, underscoring the fractal and cyclical nature of Bitcoin's price movements.
2021 - Late 2022 Crash Metrics More detailed breakdown of emerging randomness:
The repetitive alignment of market cycles with Fibonacci levels underscores Bitcoin's tendency to oscillate between predictable extremes, offering insights for timing entries and exits.
Distinct cycles are clearly visible, separated by major tops (e.g., ATH in 2013, 2017, and 2021) and bottoms (e.g., the 84.12%, 72.26%, and 77.57% corrections). Each cycle adheres to Fibonacci retracement and extension levels, demonstrating a self-similar structure .
Price expansions align with Fibonacci extensions (e.g., 1.618 and beyond), showing that Bitcoin’s growth phases are not random but rather guided by harmonic principles.
The ascending channels mapped through Fibonacci ratios capture both the bullish and corrective phases, showcasing the market's bounded yet fractal rhythm .
The percentage swings (+2484.44%, +12804.20%, +1692.21%, +600.07%) highlight the explosive nature of Bitcoin during expansion phases, followed by steep corrections. These as well align with Fibonacci proportions, providing a blueprint for market rhythm.

is BTC dead again ?I was really bullish until wave 4 didnt really bounce between the 38 and 50
suddenly very bearish

Breakout neededtechnical analysis (TA) on this Bitcoin/USD 4-hour chart highlights several key elements:
- **Trendlines & Structure**: There is a prominent descending red trendline marking current resistance, showing that price has been consistently rejected at lower highs.
- **Moving Averages**: the plotted the 50-period (blue) and 200-period (orange) moving averages. The price recently attempted to break above both, which typically signals a test of momentum; however, rejection suggests bearish pressure still dominates.
- **Support & Resistance**: Horizontal levels are marked for resistance (~115,173-115,114) and support below (~113,832). These zones align with previous price reactions.
- **Demand & Supply**: the labeled demand zone between roughly 110,312 to 111,957, where buying interest has previously stepped in, evidenced by higher trading volumes in that area.
- **Volume**: Enhanced volume is seen around the demand zone, supporting its strength. Decreasing volume during recoveries hints at weakening buyer conviction on upswings.
- **Market Structure**: Price is trading under the major moving averages and below both the structural resistance and trendline, indicating bears remain in control unless a breakout occurs above these levels.
In summary, the chart analysis conveys that Bitcoin is still in a bearish structure, struggling to regain momentum above key resistance and trendlines, with strong demand only expected in the lower highlighted box. Bulls need a decisive breakout above the descending red trendline and major moving averages to shift the narrative. (Perplexity and me)

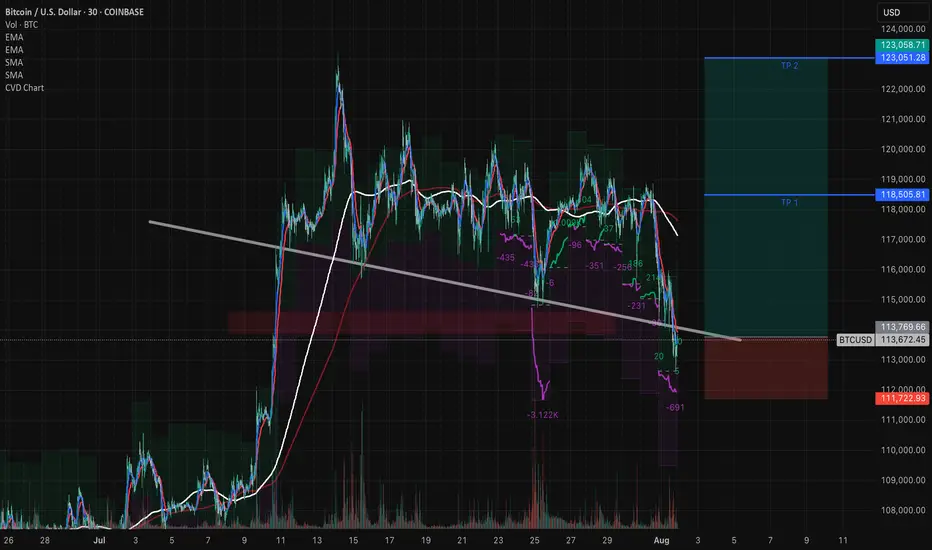
WAIT FOR A TRIPLE CONFIRMATION AND CAPITALIZE ON THE TARIFFS
Analysis and Prediction by DunnInvesting
Market Overview
The BTCUSD chart on a 1-hour timeframe shows a recent consolidation phase following a sharp decline. Key technical indicators suggest a potential reversal or continuation pattern. The price is approaching a critical support zone around $113,792.86, with a descending trendline acting as resistance.
Thought Process
Support Zone Identification: The $113,792.86 level aligns with a historical support zone and the 50-period EMA, indicating a strong area for potential buying interest.
Trendline Resistance: The descending trendline has capped recent upward movements. A break above this level could signal a bullish reversal.
Triple Confirmation: Wait for three confirmations:
A bullish candlestick pattern (e.g., engulfing candle) at the support zone.
A break above the trendline with increased volume.
A retest of the trendline as new support.
This setup offers a clear entry point with defined risk below the support zone, making it understandable and actionable.
Trade Plan
Entry: $114,500 after triple confirmation.
Take Profit 1 (TP1): $118,505 (4.5% gain).
Take Profit 2 (TP2): $123,051 (7.5% gain).
Stop Loss: $112,000 (below support, ~2.2% risk).
Risk-Reward Ratio: 1:2.04 (TP1) and 1:3.41 (TP2).
Profit Targets and Stop Loss
TP1 at $118,505 targets a conservative 4.5% move.
TP2 at $123,051 aims for a more ambitious 7.5% upside.
Stop loss at $112,000 protects against a breakdown below support.
Clarifying Notes
This idea leverages the current market uncertainty around tariffs, which could drive volatility and create trading opportunities. Monitor volume and news closely for validation.
Disclaimer
This is not financial advice. Trading involves risk, and you should only trade with capital you can afford to lose. Consult a financial advisor before making any trading decisions.
Bitcoin is heading to the moon!if the wyckoff methodology is applied then this is a re-accumulation phase with a first target in the 150k area followed by a main target in the 260k to 280K zone.
The wyckoff phases identified on the chart are as follows
Phase A:
BC (Buying Climax)
AR (Automatic Reaction)
ST (Secondary Test)
Phase B:
Characterized by volatility and testing within the range.
Phase C:
SC (Selling Climax)
Spring – a final shakeout below support to mislead traders before upward movement.
Phase D:
Clear higher highs and higher lows; sign of strength (SOS) and last point of support (LPS) observed.
Phase E :
Price has broken above the re-accumulation range and rested the trading range which is now acting as support.
As the assets price exits the trading range id expect a strong move to around the 150K area followed by a secondary move to the 260-280k target.

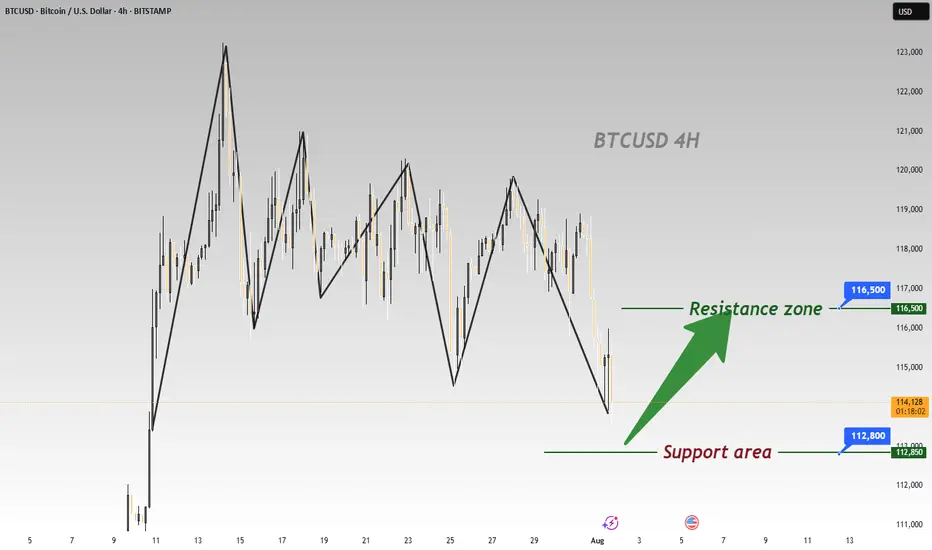
BTC Plummets Post-NFP; Go Long for Rebound to 116500BTC has plummeted significantly under the influence of the non-farm payroll data 📉, and now is an excellent opportunity to go long. Its Support level is around 112800, and according to the current trend, we can wait for a rebound to around 116500.
⚡️⚡️⚡️ BTCUSD ⚡️⚡️⚡️
🚀 Buy@ 113000 - 113800
🚀 TP 114500 - 115500 - 116500
Daily updates bring you precise trading signals 📊 When you hit a snag in trading, these signals stand as your trustworthy compass 🧭 Don’t hesitate to take a look—sincerely hoping they’ll be a huge help to you 🌟 👇
Bitcoin Range for August?Historically August has been a tough month for crypto in the past with mostly flat to negative returns. For that reason, although not a perfect science, I would not be surprised if we see a rangebound environment continuation for BTC.
So what would that look like? Structurally there are three thirds to the range, currently price is looking to break through into the upper third after bouncing off the bottom third bullish orderblock.
Trade setups will naturally present themselves as rotational plays both bullish and bearish at the extremes of each of the thirds but much larger trades from the range top and bottom.
Altcoins are lagging behind BTC structurally so where BTC has been choppy for a few weeks, most large cap alts have hit their highs and are now looking to settle into a range before the next leg up.

Bitcoin long again from 114k.Got stopped from the previous long , seems like btc wanted to sweep these 4h lows and continue higher .
Lets wait and enjoy the show in the upcoming months.

Bitcoin Range Broken?Most likely this range is broken and everybody is right, we chop around/head down... However the daily has not closed so I wonder, what would you do if three hours from now this closes above the $115,700 area?
BTC 1D OBV shows deviation, reclaim and bounce. Higher!Bitcoin CRYPTOCAP:BTC 1D OBV shows deviation, reclaim and bounce. Higher!
