HUGE Cup & Handle On BTC/GOLDAre we in the same situation as in 2017? At that time, BTC followed with a 500% rally. Do you think history is repeating itself?
If we use the same percentages, we'll have a BTC/GOLD rally of 600%. This would mean that BTC could make 250%.
BTCUSD trade ideas

BTCUSD: Buy ideaBuy idea on BTCUSD as you can see on the chart because we have the breakout with force the vwap and the RL by the buyers.

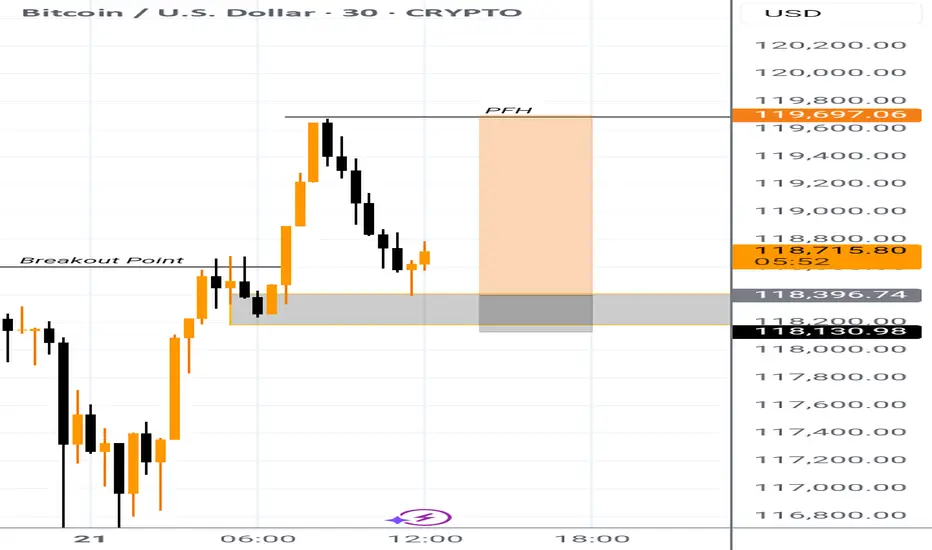
BTCUSDPrice has broken out from the external trendline which has signify for a momentum to move up at this point the overall trend is bullish while we will be expecting sell as retracement for us to reenter to the upside. in this trend we will be targeting a R:R OF 1;3

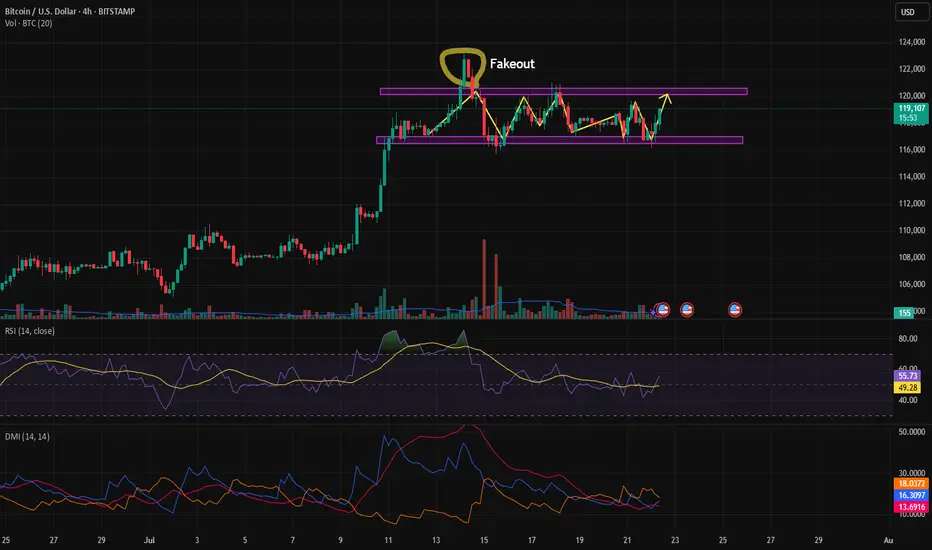
Range in BitcoinBitcoin has been ranging for nearly 12 days, and based on range-trading strategies, it's now possible to take a position. There's a high probability that the price will move toward the top of the range. For taking positions near the bottom of the range, we need to wait for a trigger since we're trading against the current direction. In case of a breakout above the range, we should be cautious of fakeouts.
BTC USD LONG RESULTPrice had held been in a narrow falling wedge before breaking out with strong volume and held the support order block at the 0.6fib level and expecting to retest before going to the supply zone where TP zone was set.
Price did move as I predicted just missing and leaving our entry behind.
Better Setups ahead 💪💯
_THE_KLASSIC_TRADER_.


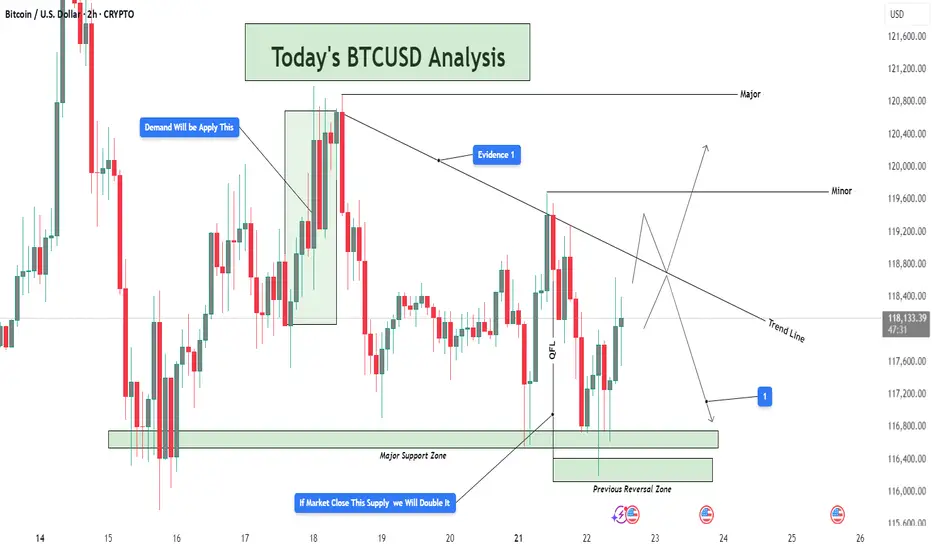
BTCUSD Analysis – Supply Pressure vs Demand Rejection 📊 Overview:
This BTCUSD 2-hour chart is giving us a clear structure of how price is currently reacting between a strong demand base and a descending trendline supply. We're at a critical decision point, where both buyers and sellers are gearing up for a potential breakout or breakdown. Let’s break it down level by level.
🟢 Demand Zone – Major Support Holding Firm
The Major Support Zone marked at the bottom of the chart is not just any random area—it has been tested multiple times and acted as a launchpad for bullish moves previously. This is also aligned with the Previous Reversal Zone, which adds confluence to this demand base.
Price dipped into this zone and immediately rejected with strong bullish candles, showing aggressive buyer interest.
This is a high-probability area for long setups as long as price stays above it.
You’ve noted on the chart: “If market closes this supply, we will double it” – that makes sense because a confirmed hold above this base increases the probability of upside continuation.
🔻 Trendline & Supply Zone – The Wall Ahead
Moving up the chart, price is being pressured by a descending trendline, acting as dynamic resistance. This trendline is not just drawn for decoration—it has rejected price at least twice already, and is also intersecting with a minor horizontal resistance zone.
This creates a confluence of resistance, making it a tough wall for buyers to break through without strong volume.
You’ve labeled it as “Evidence 1”, meaning the first confirmation of supply reacting here.
If BTC fails here again, we could easily see another pullback to the 116,800 – 116,400 range.
⚖️ QFL Pattern in Play
The QFL (Quick Flip Logic) is in action, where price aggressively dropped and formed a base, followed by a sharp move up. Price is now attempting to return to that base (demand zone) for a potential flip back upward.
If QFL holds and price breaks above the trendline, this will be a strong reversal confirmation.
This aligns with many institutional trading strategies which look for such formations near support zones.
📈 Potential Bullish Scenario:
Break above the descending trendline resistance
Price sustains above Minor Resistance Zone (around 118,800 – 119,600)
Next target: Major Resistance Zone between 120,800 – 121,200
This could create a higher-high structure and resume overall bullish trend
📉 Potential Bearish Scenario:
Failure to break the trendline
Rejection leads to price retesting the Major Support
If that zone breaks cleanly (especially below 116,400), price may drop toward 115,600 or lower
This opens up a possible short opportunity depending on price action and momentum
🎯 Conclusion:
This chart is a textbook example of consolidation between major zones. Bulls are defending hard at the bottom while bears are pushing down from the top. The direction of the breakout will dictate the next major move. Until then, wait for confirmation, avoid early entries, and let the market show its hand.
🧠 Patience = Profits.
🕒 Chart Timeframe: 2H
📌 Strategy in Focus: Supply & Demand Zones, Trendline Breakout, QFL Base Pattern
📍 Sentiment: Neutral-Bullish (Watching Trendline Reaction)
Will cryptos lose their appeal, as more regulation comes in?In this new world, where governments and financial institutions are getting more and more interested in cryptos, will those start losing their appeal?
Let's take a look at CRYPTO:BTCUSD
MARKETSCOM:BITCOIN
CRYPTO:ETHUSD
MARKETSCOM:RIPPLE
Let us know what you think in the comments below.
Thank you.
75.2% of retail investor accounts lose money when trading CFDs with this provider. You should consider whether you understand how CFDs work and whether you can afford to take the high risk of losing your money. Past performance is not necessarily indicative of future results. The value of investments may fall as well as rise and the investor may not get back the amount initially invested. This content is not intended for nor applicable to residents of the UK. Cryptocurrency CFDs and spread bets are restricted in the UK for all retail clients.

Final Push?In a previous analysis I used the range of the yellow triangle as grounds for suspicion that the bull run may be over. Now, thankfully, it appears to have formed a support on top of this triangle, instead.
I believe its possible for a big breakout here that will pop out of the red log zone, which would signal the top of this cycle/bubble.
However, for this we will need lots of volume, for which we need lots of euphoria.
$192,000 seems to be the target based on the target of the yellow triangle drawn, as well as the fib retrace. The fact that we are consolidating above $115,000 speaks to me that we still have plenty of juice, but moving the price at this market cap will require a lot of juice. Thus, I have ladder sells starting at $130,000

BTCUSD H1 - 22/7/2025BTCUSD H1
As shown, we are in wave 4 with 2 scenarios:
1- Wave 4 is triangle.
2- Wave 4 is Zigzag.
Thanks

Comparison to 2021
I think the structure so far is quite similar to that of 2021.
1. Massive run up, piercing the upper BB and quickly falling down to the lower bound.
2. Double bottom on the lower BB.
3. Second run up, touching upper BB with a retracement to the midline.
4. Another run up higher, this time it seems it couldn't pierce the upper BB, but we already have some divergences and MACD is about to cross over, too.
If history rhymes, we should see next a drop to the midline, potentially overshooting it. The midline will then serve as an upper bound to the PA, before it drops to the lower bound and the ride continues.
Of course, it could also try to pierce the upper BB first, because of the sheer amount of trade deals (🌮)...

btc live or dieOne more leg up is what we re waiting for now so far . 130k+ is the main target for us after holding 118k for days. as long as 112k holds we re not in the end of cycle.

BTCUSDThe market general trends sideways we haven't seen a major breakout to the upside or downside, so for this morning we will be favoring the upside b targeting 1:3, then we wait to see how price playout

BTC 130 Minor pullback to regression channel bottom then attempt at HH. Bottom of daily regression channel is centerline of weekly regression. If channel support fails, 100 maybe.

BTCUSD BULLYING Bitcoin is still respecting price and is buying can expect some nice moves (New Highs)
vision paintingthis is sort of a game, i would like to play with anyone interested in chart riddles. i'm being very specific with my inputs, and coloring, painting a picture of what i need to see and when. painting whats there, guiding to where itll be. wondering if i could actually create art pieces here. hypothetically the 'paintings' would need to be back checked, to artificialy create any worth to it. market involvement is day/week trades. *no advice whatsoever. so, i think ill give it a go. from here onwards, these posts are the only ill post, with updates, within the comments of such post. happy trading
ballino

WEEKLY CLSBTC has formed a generous weekly range, I can already see a few candles closing inside of the range signaling a further downside to the 114K range where I will take most profit.
I will look for manipulation tommorow on wednesday and see if I can find more precise entries, if anything ask me in the comments and I will happily reply!
Good luck and do not over-leverage and remember be PATIENT!

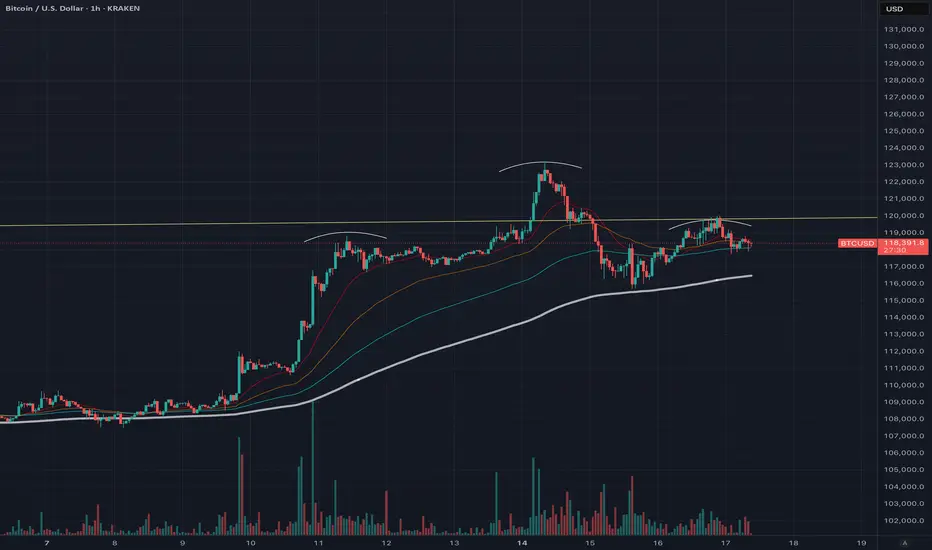
Head and shoulder pattern on hourly.
A reversal seems likely, so we should anticipate a pullback. The trading volume is decreasing while exchange volume is increasing, which suggests a potential market top based on previous trends. Greed is also on the rise. Although history doesn’t repeat itself, it certainly shows similarities. The BTC/GBP chart is indicating a double top pattern on the daily timeframe. An altcoin season may be approaching based on the ETH/BTC pair, signaling that the end of Bitcoin’s dominance could be near.
$BTC / Bitcoin Elliot Wave Analysis Update - 7/21Hello fellow degenerates,
Price reached our Wave 3 target and is now inside a consolidation pattern, wave 4. If we have a break above the pattern, my next target is at 126k - 132k range.
- We need price to stay above 116k for a bullish continuation
- A break below 116k could take us towards 110k
- Key levels to watch: 116k, 110k

Check the trend Given the price behavior within the current resistance range, possible scenarios have been identified. If the price breaks through the resistance range, a continuation of the upward trend is likely.

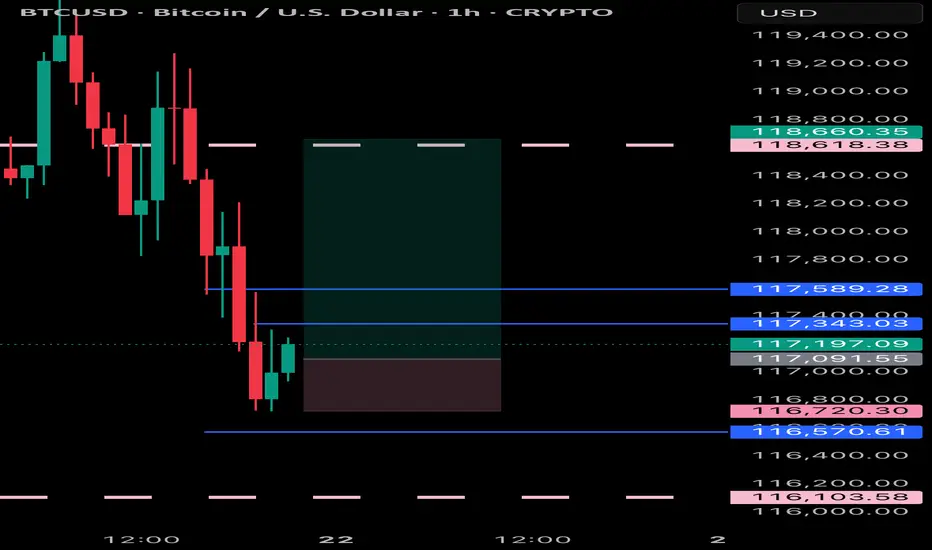
Where is the discount?In the wake of the past two week's impulsive price action, imbalances have emerged on multiple time frames. With these imbalances leaving volume gaps behind, if 116 doesn't hold, 110-112 is likely the discount zone, where institutions step up their buying. I'm inclined to believe that, with the lower highs, we're headed there. COINBASE:BTCUSD

BTC/USD Long setupPrice has brokenout from previous swing point which gives a confirmation for long position and currently making retracement into support zone which gives a better entry for a 1:5 RR