HelenP. I Bitcoin may break trend line and continue to move downHi folks today I'm prepared for you Bitcoin analytics. After testing the resistance area between 107500 and 108200 points, the price started to form a clear descending pattern, respecting the downward trend line with multiple touches. The price consistently failed to break above it, confirming bearish pressure. Eventually, it dropped below the 101500 support level and entered the support zone down to 100700 points, where it found temporary relief. From there, BTC attempted a short-term rebound and moved back toward the 101500 resistance area. However, it now trades just under the trend line again, signaling that the sellers are still in control. The structure suggests a potential pullback toward the trend line or the lower boundary of the resistance zone before further downside continuation. In my opinion, BTCUSD is preparing for another move lower. That’s why I expect a slight upward correction, followed by a new bearish impulse that could push the price toward the 97500 level, my current goal. Given the ongoing pressure from the trend line and the failed breakout attempts, I remain bearish and expect further decline. If you like my analytics you may support me with your like/comment ❤️
Disclaimer: As part of ThinkMarkets’ Influencer Program, I am sponsored to share and publish their charts in my analysis.
BTCUSD trade ideas

BTCUSD Bullish continuation pattern support at 101,780Trend Overview:
BTCUSD remains in a bullish trend, characterised by higher highs and higher lows. The recent intraday price action is forming a continuation consolidation pattern, suggesting a potential pause before a renewed move higher.
Key Technical Levels:
Support: 101,780 (primary pivot), followed by 100,380 and 98,184
Resistance: 109,170 (initial), then 111,600 and 114.140
Technical Outlook:
A pullback to the 101,780 level, which aligns with the previous consolidation zone, could act as a platform for renewed buying interest. A confirmed bounce from this support may trigger a continuation toward the next resistance levels at 109,170, 111,600, and ultimately 114,140.
Conversely, a daily close below 101,780 would suggest weakening bullish momentum. This scenario would shift the bias to bearish in the short term, potentially targeting 100.390 and 98,180 as downside levels.
Conclusion:
BTCUSD maintains a bullish structure while trading above the 101,780 support. A bounce from this level would validate the consolidation as a continuation pattern, with upside potential toward the 109,170 area. A breakdown below 101,780, however, would invalidate this view and suggest deeper corrective risk.
This communication is for informational purposes only and should not be viewed as any form of recommendation as to a particular course of action or as investment advice. It is not intended as an offer or solicitation for the purchase or sale of any financial instrument or as an official confirmation of any transaction. Opinions, estimates and assumptions expressed herein are made as of the date of this communication and are subject to change without notice. This communication has been prepared based upon information, including market prices, data and other information, believed to be reliable; however, Trade Nation does not warrant its completeness or accuracy. All market prices and market data contained in or attached to this communication are indicative and subject to change without notice.

$BTC Weekend Update - The Revenge of the BearsHello Fellow Gamblers,
Bears are in total control of BTC and are dragging the price lower and lower. Our 1st target has been hit so my eyes are now turning towards our 2nd target right above 93k. In the Video I talk about a possible Target 3 that could happen if we break below 93k.
- I am currently watching for a possible move up towards 103k to fill any FVG previously opened, I might be early but it is never early enough to be mentally prepared for it.
- I expect an accumulation to happen above 93k. That would lead us to a reversal and continuation of the bullish trend.
- Levels to watch: 93.1k, 97.5k,101k, 103.4k, 106.6k.

CHECK BTCUSD SIGNAL READ CAPTAINbtcusd buy now ✅
entry point (105700.00) (105500.00)
TAKE PROFIT 1: (104850.00)
TAKE PROFIT 2: (104000.00)
LAST TARGET(103200.00)
STOP LOSS (106500.00)

BTC Drowdown SELL SETUPIf we will not see fast De-escalation with Middle East conflict we are going to 93k easy!
SELL SETUP
ENTRY: 103364.0
SL: 107635.0
TP: 93384.0
Follow me and you will see more and more good trade ideas
Please don't use big leverages and be carefull!

Bitcoin - Looking To Buy Pullbacks In The Short TermM15 - Strong bullish move.
No opposite signs.
Currently it looks like a pullback is happening.
Expecting further continuation higher until the two Fibonacci support zones hold.
If you enjoy this idea, don’t forget to LIKE 👍, FOLLOW ✅, SHARE 🙌, and COMMENT ✍! Drop your thoughts and charts below to keep the discussion going. Your support helps keep this content free and reach more people! 🚀
--------------------------------------------------------------------------------------------------------------------

BITCOIN'S BIG BOUNCEBitcoin’s daily chart shows a textbook liquidity sweep followed by a strong recovery. After dipping below the critical $100,000 psychological level late last week, price tagged a low around $99,000 before reversing sharply. This move likely shook out overleveraged longs and trapped breakout shorts – setting the stage for a high-volume bounce. Importantly, BTC reclaimed both the $100,716 horizontal support and the 50-day moving average – signaling renewed short-term bullish momentum.
Currently, Bitcoin is trading just below the key resistance level at $105,787 – a price zone that has repeatedly acted as a ceiling throughout June. A decisive breakout and close above this level would likely open the door to a move toward the $112,000 range highs. Until then, $105,787 remains the level to beat. If price rejects from here, the $100K zone becomes crucial once again – with $92,817 as the next major support below.
Volume has been supportive on the bounce, suggesting real demand stepped in on the sweep of the lows. For bulls to maintain control, they’ll want to see continued strength above the 50-day moving average and a clear break of resistance. For now, the structure looks constructive – but the next couple of daily closes will determine whether this was just a relief rally or the start of a broader continuation higher. We are basically trading between two key levels in a small range.

Short Setup on BitcoinA solid short setup has emerged on Bitcoin.Trend is bearish — price is trading below the moving averages.
The setup offers a favorable risk-to-reward ratio within the prevailing downtrend.
📝Trade Plan:
Entry: At current market price
Stop Loss: Above the resistance level at 107,145
Target: Price zone around 94,000–95,000

June 23 Bitcoin Bybit chart analysisHello
This is Bitcoin Guide.
If you "follow"
You can receive real-time movement paths and comment notifications on major sections.
If my analysis was helpful,
Please click the booster button at the bottom.
This is the Bitcoin 30-minute chart.
The Nasdaq seems to be rising without any problems,
but Bitcoin is under pressure from the MACD dead cross on the weekly chart as it has been adjusted strongly over the weekend.
Depending on the real-time situation, it seems advantageous to operate safely
short-term trading or both-way trading this week.
I created today's strategy based on the Nasdaq movement and the Tether dominance pattern.
*One-way long position strategy when the red finger moves
1. $100,587.9 long position entry section / hand drop when the purple support line is broken
2. $103,953.8 long position target price / Good 2nd target price thereafter
From the purple support line breakout, the weekly chart
candle low point created this week is broken, so it is better to maintain it without breaking out from the long position position.
If it breaks out, it can be pushed to the bottom -> 2nd section.
The 1st section marked in the middle
If it doesn't come down to the long entry point today
It is a vertical rise section
And the pink finger in the middle indicates the short-term target price -> additional long entry section
And the Gap8 section was created at the top due to last week's movement
I think it would be good to refer to it while trading.
Up to this point, I ask that you simply use my analysis for reference and use
I hope that you operate safely with principle trading and stop loss prices.
Thank you.

BITCOIN Trump and the 1D EMA100 saved the day!Bitcoin (BTCUSD) rebounded yesterday on its 1D EMA100 (green trend-line) and along with Trump's truce announcement between Israel and Iran, it sent the market into a buying frenzy and back above the $105k mark.
Technically, the 1D EMA100 isn't something to be ignored as since the November 2022 market bottom, each Bullish Leg (Channel Up) that started had a contact (or near) with it that resulted into a considerable bullish extension.
The 1st Channel Up even breached below it, but after rebounding, it reached the 1.382 Fibonacci extension before the next correction. The 2nd Channel Up rebounded exactly on the 1D EMA100, and reached the 1.618 Fibonacci extension. The 3rd Channel Up almost hit the 1D EMA100 and then rebounded to the 2.0 Fibonacci extension.
It is obvious that the pattern follows a progression and each Fib extension peak is higher than on the previous Channel Up. As a result, it is not unlikely to see a High even above the 2.0 Fib ext ($168k) on the current (4th) Channel Up, however on the short-term we would still welcome the 1.382 Fib 'minimum' expectation, targeting $130000.
Do you think we should at least be expecting that? Feel free to let us know in the comments section below!
-------------------------------------------------------------------------------
** Please LIKE 👍, FOLLOW ✅, SHARE 🙌 and COMMENT ✍ if you enjoy this idea! Also share your ideas and charts in the comments section below! This is best way to keep it relevant, support us, keep the content here free and allow the idea to reach as many people as possible. **
-------------------------------------------------------------------------------
💸💸💸💸💸💸
👇 👇 👇 👇 👇 👇

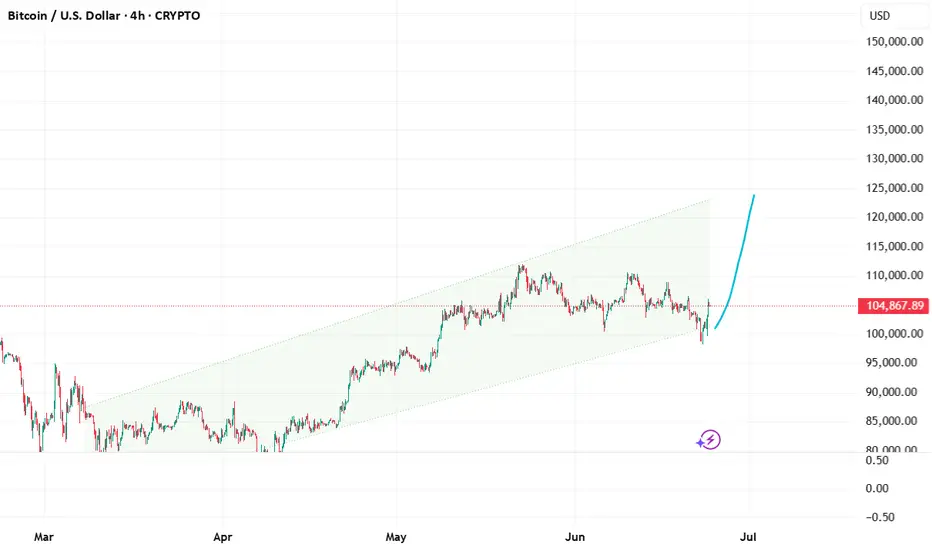
Bitcoin / U.S. Dollar 4-Hour Chart - June 24, 20254-hour chart displays the Bitcoin (BTC) to U.S. Dollar (USD) price movement, currently at $105,121.98, reflecting a decrease of $258.74 (-0.25%) as of 03:15:58. The chart highlights a recent downward trend with a potential support level around $103,509.67 and a resistance zone between $104,651.27 and $107,154.41, indicated by shaded areas. The time frame spans from June 6 to June 25, 2025.

BTCUSD: Deja Vue from last halvingsWithin this Cycle we have a mixed price behaviour from the last 2 halvings , so if this continues ws should see a huge surge within the next few days/weeks. I expect Maximum Aug/Sept/Oct with 280-320 K . Mut we might get back to 80K next year. Be prepared

BTC/USD 15M CHART PATTERNYou're sharing a short trade setup for BTC/USD on the 15-minute timeframe. Here's a breakdown of your trade plan:
---
📉 Sell Entry
Entry Price: 104800
---
🎯 Take-Profit Targets
TP1: 103400
TP2: 102100
TP3: 100428
---
🛑 Stop Loss
SL: 107100
---
⚖ Risk-Reward Overview
Here’s a rough idea of the risk-to-reward ratio for each target:
1. TP1:
Risk: 107100 - 104800 = 2300
Reward: 104800 - 103400 = 1400
RR ≈ 0.61:1
2. TP2:
Reward: 104800 - 102100 = 2700
RR ≈ 1.17:1
3. TP3:
Reward: 104800 - 100428 = 4372
RR ≈ 1.9:1
---
⚠ Notes
SL is relatively wide (2.2%) — make sure position sizing reflects that.
Targeting a full retracement down to ~100K area suggests high confidence in a local top or rejection zone.
---
Would you like:
A chart visualized for this setup?
Help converting this to a trading script or bot?
Backtest ideas for this strategy?
Let me know how you'd like to proceed.

USD Index (DXY) Bullish Reversal & Breakout PotentialThe DXY chart displays a strong bullish reversal structure from the support zone near the 99,800–100,200 area. Here’s a professional breakdown of the technical setup:
🔍 Key Observations:
🟢 Bullish Reversal Formation
The price rebounded aggressively from a strong demand zone (support), marked by a green arrow and orange highlight.
Multiple historical reaction zones confirm this level's validity as a reliable support.
📉 Previous Decline & Correction
After reaching the resistance area near 110.400, the price corrected with a bearish channel.
This pullback formed a classic bull flag, a bullish continuation pattern, eventually leading to the current breakout.
🟦 Current Price Action
The market has broken out of the recent downtrend and is forming higher highs and higher lows.
A strong bullish impulse candle confirms renewed buying interest.
🧱 Support & Resistance Levels:
🔵 Resistance Zone (Target): 110.409 — a historically respected area and target for the bullish move.
🟣 Current Support Zone: 105.061 — previously resistance, now likely to act as support after the breakout.
🎯 Bullish Target Projection
If price retests and holds the support at 105.061, the next potential leg can extend towards 110.409, offering a strong risk-to-reward setup.
⚠️ Caution
Watch for a pullback and retest near the support level.
A failure to hold above 105.061 could invalidate the bullish structure.
🧠 Conclusion
The DXY is showing a bullish trend continuation after a breakout from a corrective structure. A successful retest of support could propel price towards the 110.400 target zone 📊.
Bias: ✅ Bullish above 105.061
Invalidation: ❌ Below 105.000


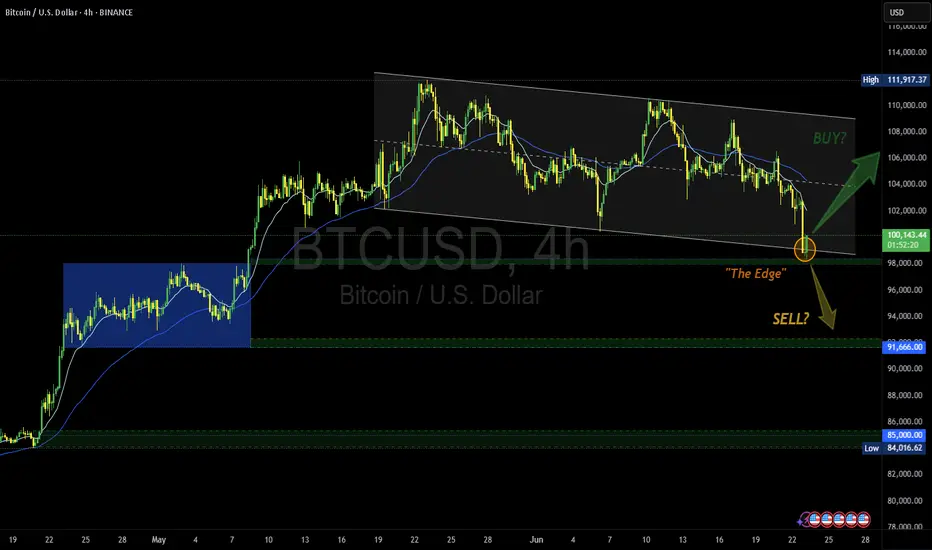
Another Edge - Decision time | Buy? or Sell? share your opinionTitle: BTCUSD: At The Edge – Decision Time Looms
Idea: Bitcoin is currently flirting with "The Edge"—a key decision zone near $98,000 where trend dynamics could shift sharply. After touching the lower boundary of a descending channel, BTC is testing support that could mark either a springboard for a bullish reversal or a trapdoor for further downside.
If bulls reclaim territory above the descending resistance line and push toward $104,000, we may see a trend breakout and renewed upside momentum. Confirmation with volume would strengthen the case for a long position, targeting the $111,917 level.
However, failure to hold "The Edge" could open the door to a swift move lower toward the $91,666 then $85,000 support zone, especially if accompanied by broader risk-off sentiment.
Trade Plan:
• Long above $100K with confirmation and strong volume;
target $111,917.
Stop below $97K.
• Short on breakdown below $97K with bearish momentum;
target $91,666.
Stop above $100K.
Watching: Volume spikes, macro news, and behavior around the channel boundaries.
🚀 Will Bitcoin bounce off the edge—or fall into the abyss?
#MJTrading #BTC #Bitcoin #Buy #long #chart #signal #forex
Bitcoin Order Book - How To Trade ItBitcoin Order Book Analysis | Massive BTC Liquidity Zones You Need to Watch
In this video, we break down the Bitcoin (BTCUSD) order book and highlight the biggest buy and sell levels currently driving market sentiment. These are the exact price zones where whales and institutions are placing large orders—often creating powerful support and resistance that can trigger breakout or reversal setups.
In This Breakdown:
• Where major buy/sell walls are forming in the BTC order book
• How order book depth can predict short-term price direction
• Real-time liquidity pockets traders are watching now
• Key price levels to watch for possible long/short entries
This is a must-watch if you’re actively trading BTC and want to track where the smart money is stacking their positions.
⸻
Tools Featured:
• BTCUSD real-time chart
• Order book heatmap / depth
• Liquidity zone visualizations
• Volume profile overlays
• Sentiment Tool
⸻
Use this insight to position your trades around high-probability reversal or breakout zones. Comment your BTC target below, and follow for daily pro-level crypto insights.
⸻
#Bitcoin #BTCUSD #OrderBookAnalysis #BTCOrderFlow #WhaleActivity #LiquidityZones #CryptoTrading #PriceAction #CryptoTA #BitcoinStrategy

Bitcoin uptrend beginning?Bitcoin is experiencing a bounce from an important support level. If this level holds, can we see 130k?
A pull back from here to a minor support level at 103.400k is an important replacement level.
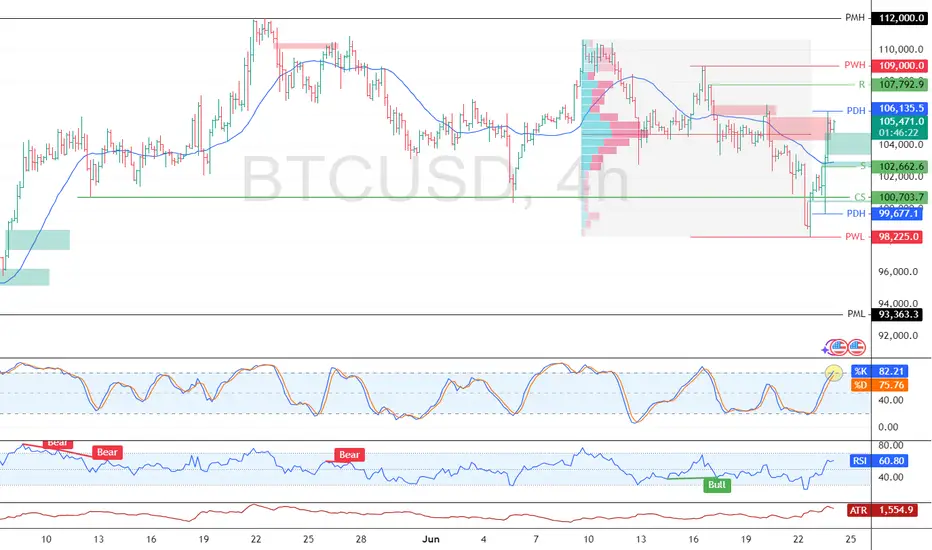
Bitcoin Rebounds Above $105K After Liquidity SweepFenzoFx—Bitcoin swept liquidity below $100,703.0 and rebounded to around $105,400.0, just above the volume profile point of interest.
Immediate resistance lies at $106,135.0. A break above this level could lead to a retest of $107,702.0. However, if resistance holds, BTC may consolidate toward $102,662.0, supported by Stochastic overbought signals.
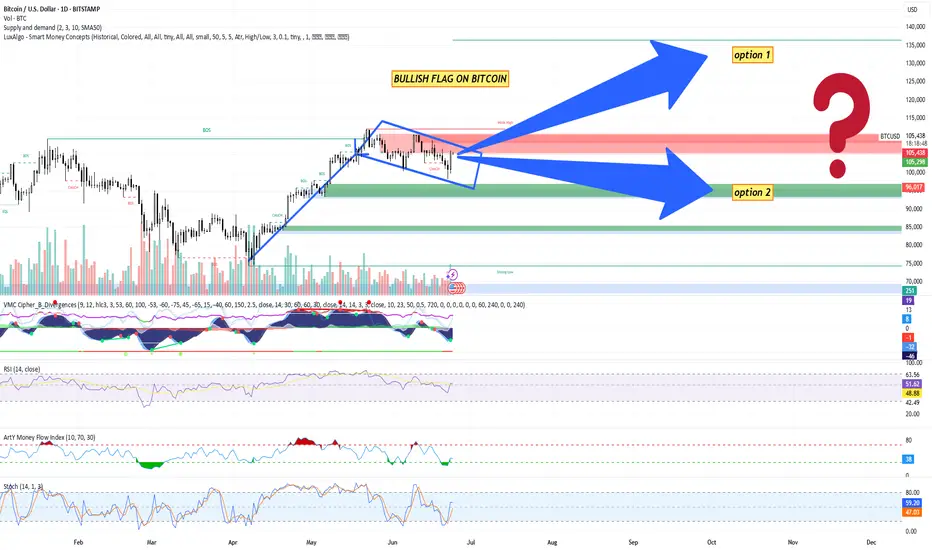
Bitcoin (BTC/USD) Technical Analysis + trade planBitcoin (BTC/USD) Technical Analysis – June 24, 2025
Pattern Identified: Bullish Flag Formation
A clear upward impulse leg followed by a downward-sloping consolidation (flag) indicates a continuation pattern.
The flag is bounded within a descending parallel channel, suggesting a potential breakout to the upside.
Break of Structure (BOS): Multiple BOS signals indicate strong market structure shifts favoring bullish continuation.
Change of Character (CHOCH): Minor CHOCH noted inside the flag, indicating local liquidity grabs but no trend reversal yet.
Key Levels
Current Price: ~$105,126
Flag Resistance: ~$105,291 (watch for breakout)
Major Supply Zone (Resistance): ~$115,000 (red zone)
Demand Zones (Supports):
$96,000 (minor)
$85,000 (medium strength)
$75,000 - $70,000 (strong low / high-confluence area)
Volume Analysis
Declining volume during flag formation supports the bullish flag hypothesis (low-volume pullback).
Anticipate increased volume on breakout for confirmation.
Indicators Summary
1. VMC Cipher B
Green dots signal potential local bottoms.
Wave trends support bullish reversal setup, though momentum still neutral.
2. RSI (14)
Current RSI: ~50.76
Neutral zone; not overbought/oversold – provides room for upside movement.
3. Money Flow Index (Art’y)
Positive inflow recovering, signaling accumulation phase.
4. Stochastic RSI
Blue line crossing above orange around 46. Indicates bullish crossover from the oversold region – early entry signal.
Bitcoin Trading Plan
Trading Bias: Bullish (Contingent on Flag Breakout)
Entry Plan
Breakout Entry: Enter long above $105,300 with confirmation (4H or daily candle close).
Aggressive Entry: Pre-breakout entry inside the flag at ~$104,000–$105,000, anticipating breakout.
Stop Loss
Conservative: Below $96,000 (below key support + 50 SMA).
Aggressive: Below $102,500 (inside flag, tighter stop).
Take Profit Levels
TP1: $110,000 (local high)
TP2: $115,000 (strong resistance zone)
TP3: $123,000–$125,000 (measured move from flag breakout target)
Measured Move Target: Height of the pole ($25K) added to the breakout zone ($105K) = Target zone: $130,000 (theoretical).
Alternative Scenario – Bearish Breakdown
If BTC breaks below $96,000, the bullish structure is invalidated.
In that case:
Look for short entries below $95,500.
Target zone: $85,000 – $75,000.
SL above $98,000.
Risk Management Guidelines
Risk per trade: 1–2% of capital
Use position sizing tools to determine trade size.
Monitor macroeconomic news (Fed, inflation, ETF flows) and crypto market sentiment.
To sum up things:
BTC is consolidating within a textbook bullish flag.
Momentum indicators align with a potential breakout.
Caution warranted until clear breakout occurs – volume confirmation is key.
Keep alert for fakeouts due to low summer volatility.
BTCUSD Short (Yesterday)I missed this one yesterday - BTC is now net short on the regression break. It bounced hard on the Iran/Israel news but is currently still short.

BTCUSDBTCUSD remains in a bullish leg with a projected target at 107,848, aligning with point B of a potential ABCD harmonic structure. Should price reach this level, we will closely monitor for a bearish reversal setup.
From a Smart Money Concepts (SMC) standpoint, we are identifying two key zones of interest for potential short entries:
A newly formed supply zone (order block) at 108,660,
The 107,848 level, corresponding with the anticipated completion of the B leg.
A valid short scenario will require confirmation through SMC triggers — such as a liquidity grab, followed by a break of structure (BOS) or change of character (CHOCH), ideally accompanied by displacement. Upon such confirmation, we will look to initiate short positions with appropriate risk management.
