BTCUSD Daily Analysis – Golden Pocket Hold Before a Bullish?🧠 Chart Description & Market Structure:
The BTCUSD daily chart is showing a consolidation phase after forming a local high near $123,231. Currently, the price is retracing and approaching a key Fibonacci retracement zone between the 0.5 level ($115,557) and 0.618 level ($113,740) — also known as the Golden Pocket, which is often a strong reversal area.
---
📈 Bullish Scenario:
If the price holds within or just above the 0.5–0.618 Fibonacci zone (highlighted in yellow) and forms a bullish reversal candlestick (like a hammer, bullish engulfing, or pin bar), there’s a high probability for BTC to resume its uptrend.
Bullish upside targets include:
$119,842 as minor resistance.
$123,231 as the previous swing high and a key breakout confirmation.
A successful break above $123,231 could send BTC toward the next major targets around $128K–$132K.
---
📉 Bearish Scenario:
If the price fails to hold the 0.618 Fibonacci level ($113,740) and breaks down below the key psychological support at $111,500, a deeper correction may occur.
Downside targets:
$108K–$106K as the next major support zone.
A break below this could lead to the formation of a lower high structure and potentially trigger a bearish continuation.
---
📊 Pattern Observations:
Potential Bullish Flag or Rectangle Consolidation: The price action suggests horizontal consolidation after a strong rally — possibly a re-accumulation zone before a bullish continuation.
Golden Pocket Retest: Price is currently testing the Fibonacci 0.5–0.618 zone, often targeted by institutional buyers and technical traders as a potential entry point.
---
🧭 Key Levels to Watch:
Major Resistance: $123,231 (swing high)
Minor Resistance: $119,842
Fibonacci 0.5: $115,557
Fibonacci 0.618: $113,740
Key Support: $111,500
---
🔖 Conclusion:
BTC is currently in a decision zone. Price action within the $115,500–$113,700 range will be crucial. Will this be a healthy retracement before the next leg up — or the beginning of a deeper correction?
#BTCUSD #BitcoinAnalysis #CryptoTA #FibonacciRetracement #CryptoChart #BitcoinDaily #BullishSetup #BearishSetup #CryptoMarket
BTCUSD trade ideas

BTC/USD – 4H Technical and Fundamental AnalysisBTC/USD – 4H Technical and Fundamental Analysis
BTC/USD saw sharp downside pressure today, driven by a wave of long position liquidations—exceeding $800 million across the crypto market in the past 24 hours. The sudden shift triggered panic selling, dragging Bitcoin below its psychological and technical support near $116,000. Broader crypto market sentiment turned risk-off as large investors reduced exposure, accelerating the sell-off.
Fundamentally, the market remains cautious amid a lack of positive macroeconomic catalysts for risk assets. Speculation about stricter U.S. regulatory oversight and declining inflows into crypto ETFs also dampened sentiment. Combined with hawkish remarks from Fed officials, which keep interest rates elevated, appetite for high-risk assets like Bitcoin weakened further.
From a technical perspective, BTC/USD broke below the major support level of $116,000, confirming bearish pressure. This breakdown followed a period of consolidation, with price failing to maintain bullish momentum. A liquidity hunt appears to be underway, with price revisiting the zone to trap breakout traders before resuming its move.
We are now watching for a confirmed 4H candle close below the liquidity zone. Once confirmed, a short setup is validated, with targets aligned with the next key support zone.
📍 Sell Setup
Entry: Sell Limit at 115,980.00
Stop Loss: 117,985.00
Take Profit: 111,940.00
📌 Disclaimer:
This is not financial advice. Always wait for proper confirmation before executing trades. Manage risk wisely and trade what you see—not what you feel.

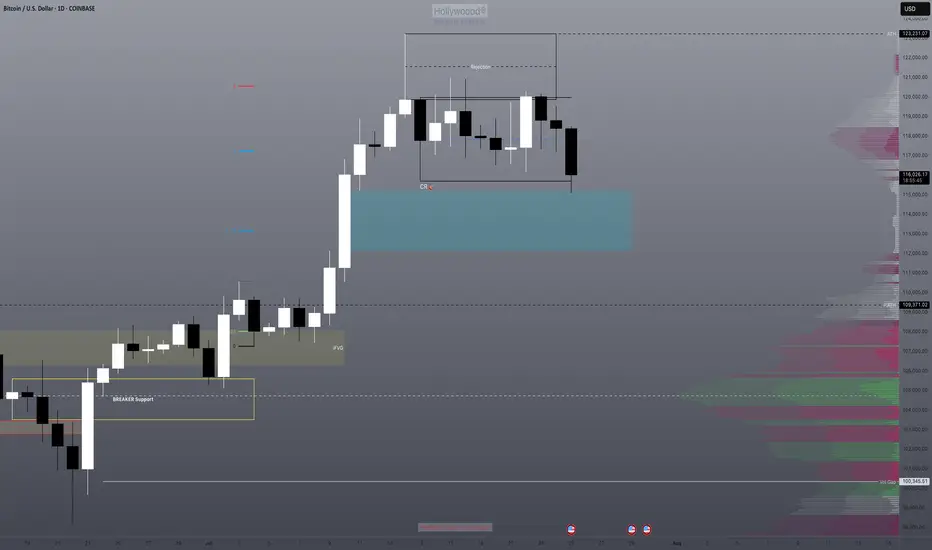
Will the low of this BTC zone be used as a buy point?We have an imbalance high being tested. We know that this also represents the consolidation range low where both TPs and long entries will be triggered.
Will this be enough to send us back bullish or will be need further correction of the imbalance? I think there's a high probability of this with DXY also running into it's daily bearish imbalance range.
BTCUSD: Who caught the bottom of the previous wave?BTCUSD: Who caught the bottom of the previous wave?
.
I’ve said it before, the market only has a few familiar patterns, repeating them over and over to the point of boredom.
.
US STOCKS- WALL STREET DREAM- LET'S THE MARKET SPEAK!

#Bitcoin - Levels to watchDate: 14-07-2025
#Bitcoin
Current Price: 119900
Pivot Point: 118591.00 Support: 117149.31 Resistance: 120041.22
Upside Targets:
Target 1: 121022.11
Target 2: 122003.00
Target 3: 123282.50
Target 4: 124562.00
Downside Targets:
Target 1: 116164.16
Target 2: 115179.00
Target 3: 113899.50
Target 4: 112620.00
#Crypto #Bitcoin #BTC #CryptoTA #TradingView #PivotPoints #SupportResistance

BTC Pullback113,500 and 110,800 are the next two levels to watch for and line up with the .382 and the .5 fib level.
I think there will be more downside before another push to a new ATH.
NFA, do your own DD.
Thanks for viewing.

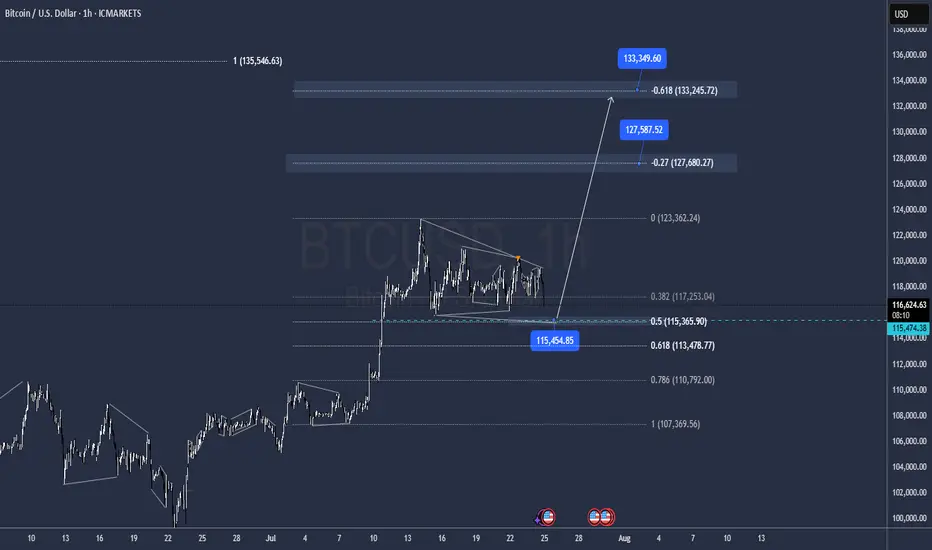
BTC Correction may be overOn a new look to the structure with the lat moves, it has the Potential to be over after tapping 115.500 and go for new Highs @ 127.500 / 133.000 as all internal impulses seeems to be matched.
BTC SETUPBTC is currently on a sell retracement and after this retracement we are expecting a bullish run but before then we will be currently bearish till we see sell exhaustions.
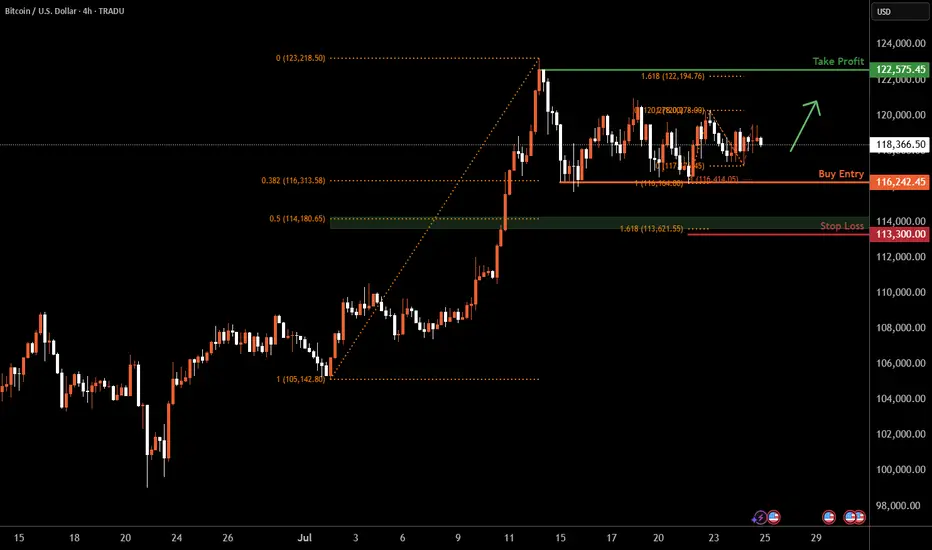
Bitcoin H4 | Falling toward a multi-swing-low supportBitcoin (BTC/USD) is falling towards a multi-swing-low support and could potentially bounce off this level to climb higher.
Buy entry is at 116,242.45 which is a multi-swing-low support that aligns with a confluence of Fibonacci levels i.e. the 38.2% retracement and the 100% projection.
Stop loss is at 113,300.00 which is a level that lies underneath a support zone that is identified by a confluence of Fibonacci levels i.e. the 50% retracement and the 161.8% extension.
Take profit is at 122,575.45 which is a swing-high resistance that aligns close to the all-time-high.
High Risk Investment Warning
Trading Forex/CFDs on margin carries a high level of risk and may not be suitable for all investors. Leverage can work against you.
Stratos Markets Limited (tradu.com ):
CFDs are complex instruments and come with a high risk of losing money rapidly due to leverage. 66% of retail investor accounts lose money when trading CFDs with this provider. You should consider whether you understand how CFDs work and whether you can afford to take the high risk of losing your money.
Stratos Europe Ltd (tradu.com ):
CFDs are complex instruments and come with a high risk of losing money rapidly due to leverage. 66% of retail investor accounts lose money when trading CFDs with this provider. You should consider whether you understand how CFDs work and whether you can afford to take the high risk of losing your money.
Stratos Global LLC (tradu.com ):
Losses can exceed deposits.
Please be advised that the information presented on TradingView is provided to Tradu (‘Company’, ‘we’) by a third-party provider (‘TFA Global Pte Ltd’). Please be reminded that you are solely responsible for the trading decisions on your account. There is a very high degree of risk involved in trading. Any information and/or content is intended entirely for research, educational and informational purposes only and does not constitute investment or consultation advice or investment strategy. The information is not tailored to the investment needs of any specific person and therefore does not involve a consideration of any of the investment objectives, financial situation or needs of any viewer that may receive it. Kindly also note that past performance is not a reliable indicator of future results. Actual results may differ materially from those anticipated in forward-looking or past performance statements. We assume no liability as to the accuracy or completeness of any of the information and/or content provided herein and the Company cannot be held responsible for any omission, mistake nor for any loss or damage including without limitation to any loss of profit which may arise from reliance on any information supplied by TFA Global Pte Ltd.
The speaker(s) is neither an employee, agent nor representative of Tradu and is therefore acting independently. The opinions given are their own, constitute general market commentary, and do not constitute the opinion or advice of Tradu or any form of personal or investment advice. Tradu neither endorses nor guarantees offerings of third-party speakers, nor is Tradu responsible for the content, veracity or opinions of third-party speakers, presenters or participants.

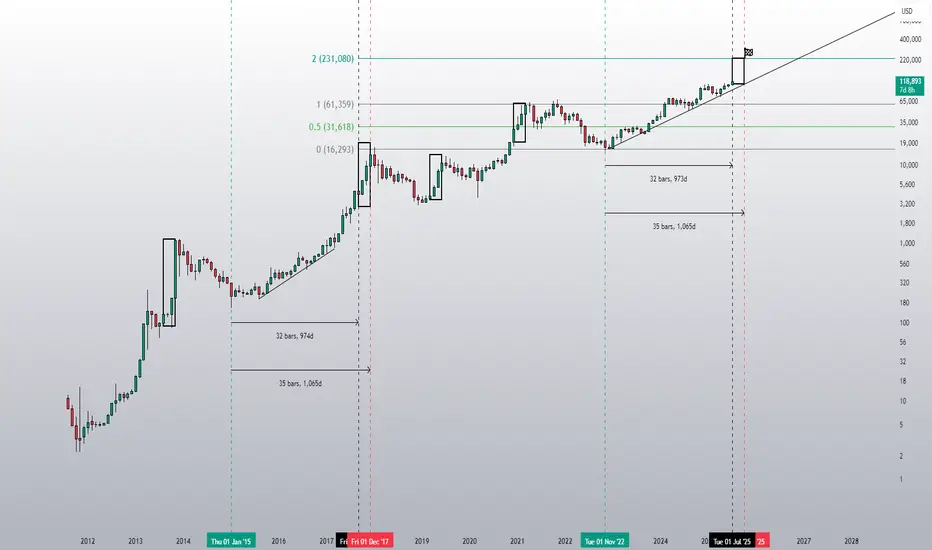
BTC, zoom out!!!Based on your prediction that Bitcoin will change at a rate of 5% every year, the price of Bitcoin would be $124,709.55 in 2026, $151,585.24 in 2030, $193,465.44 in 2035, and $246,916.38 in 2040. Scroll down to view the complete table showing the predicted price of Bitcoin and the projected ROI for each year.
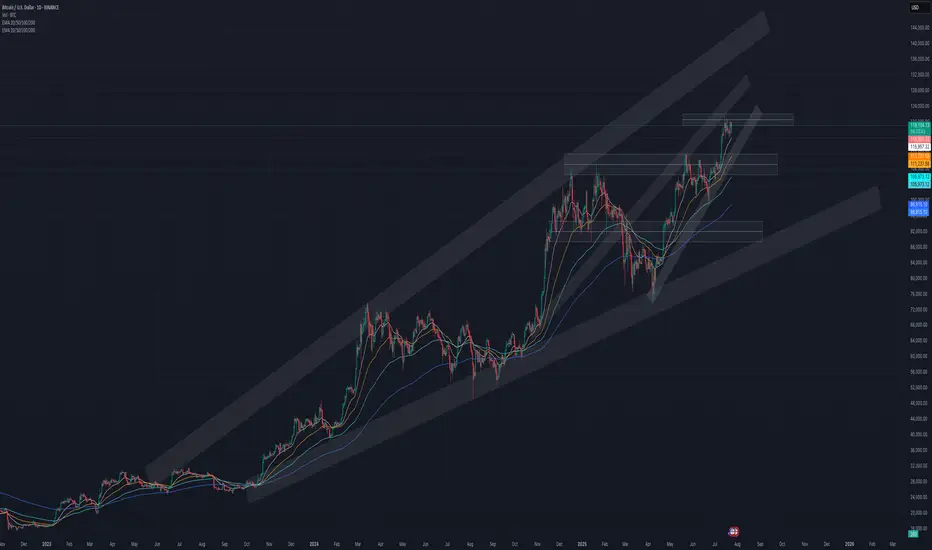

BTC 4H – Dance with the 200MA
Bitcoin continues its strong relationship with the 200MA.
Each time price dips below it, fear spikes — but bounces off key Fib levels have followed, with price then riding higher alongside the 200MA.
Right now, price is caught between the 200MA and a nearby Fib level.
Here’s what could happen next:
– Price flips the Fib into support, ideally with help from a rising 200MA.
– Price waits for the 200MA to catch up, and they break the Fib together.
– Or, we get another panic dip, and the bounce comes after another test from below.
Whichever path it takes, we’ll be here watching it unfold.
Always take profits and manage risk.
Interaction is welcome.

$BTCUSD bullish short term before Intermediary Wave 1 pullbackSupercycle (years): Wave (III)
Cycle (months): Wave III
Primary (weeks): Wave ((3))
Intermediate (days): Wave (1)
Minor (4H): Wave 5
Looks bullish in the short term.
Let's Go!

BITCOIN BULLISH WEDGE|LONG|
✅BITCOIN is trading in a
Strong uptrend and the coin
Has formed a massive bullish
Wedge pattern so we are
Bullish biased and IF we see
A bullish breakout we will
Be expecting a further
Bullish move up
LONG🚀
✅Like and subscribe to never miss a new idea!✅
Disclosure: I am part of Trade Nation's Influencer program and receive a monthly fee for using their TradingView charts in my analysis.

BTC #The chart depicts a 15-minute Bitcoin (BTC/USD)The chart depicts a 15-minute Bitcoin (BTC/USD) price action forming a cup and handle pattern, which is generally considered a bullish continuation pattern. The rounded base signifies consolidation, followed by a potential breakout above the $120,250 resistance zone (blue line). A breakout with volume could confirm upside momentum. The shaded grey area below (~$117,000) represents a support zone, crucial for invalidation of the pattern if breached.
thanking you

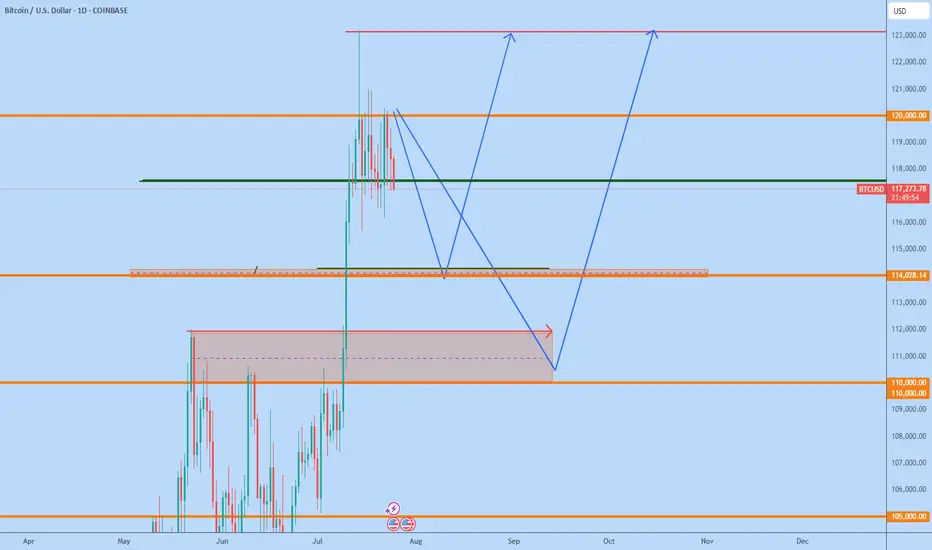
Continuation flag ?Looks like a continuation flag, thoughts?
ETH is in a pullback, BTC didnt have one,
looks like a strong bullish flag

BTCUSD Bullish engulfing
Buy from current price or wait for retest
Bullshlish momentum observed
Mangae risk book partially as metioned or as per your capital

BTCUSD 7/24/2025Come Tap into the mind of SnipeGoat as he gives you a Full Top-Down Analysis of Bitcoins Price Action from the Monthly down to the 30min. To keep you align & aware of what's REALLY going on in the market. Don't believe the hype, we read Candles over here!
_SnipeGoat_
_TheeCandleReadingGURU_
#PriceAction #MarketStructure #TechnicalAnalysis #Bearish #Bullish #Bitcoin #Crypto #BTCUSD #Forex #NakedChartReader #ZEROindicators #PreciseLevels #ProperTiming #PerfectDirection #ScalpingTrader #IntradayTrader #DayTrader #SwingTrader #PositionalTrader #HighLevelTrader #MambaMentality #GodMode #UltraInstinct #TheeBibleStrategy

Wealtris: Ethereum Demand Surges 32x — Price Set to Explode?According to a recent market analysis by Bitwise, Ethereum’s demand now exceeds supply by 32 times—a rare market condition that could lead to a major price breakout. Institutional interest, combined with Ethereum’s deflationary structure, is creating a perfect storm for growth.
At Wealtris, we treat this not just as market news, but as a strategic window to help our investors profit from a fundamentally bullish setup.
The imbalance is driven by several forces: over 27 million ETH are locked in staking, taking supply out of circulation; the upcoming wave of Ethereum spot ETFs is attracting pre-approval accumulation; and Ethereum’s fee-burning mechanism continues to deflate the token’s total supply. Simultaneously, its role as the backbone of DeFi, NFT infrastructure, and Layer 2 chains keeps demand elevated.
While traders speculate, institutions prepare. Whales and funds are quietly accumulating ETH in anticipation of regulatory clarity and ETF launches. Bitwise compares this setup to Bitcoin’s trajectory before its 2020 bull run, when a similar supply crunch triggered explosive gains.
Wealtris is already positioned for this moment. Our investment strategies offer smart exposure to Ethereum via staking platforms, ETH-indexed instruments, and Layer 2 ecosystem tokens. We provide our clients with risk-managed access to the Ethereum upside—without the need to self-manage wallets or guess market timing.
In addition, we monitor on-chain data and ETF progress in real time, adjusting exposure as signals shift. Our hybrid strategy—balancing yield generation and price exposure—helps clients benefit from both sides of the Ethereum equation.
For forward-looking investors, the 32:1 demand ratio isn’t just an interesting metric—it’s a signal. Wealtris uses that signal to generate structured growth through precise capital allocation and macro-responsive rebalancing.
With regulatory developments, staking innovation, and ETF momentum building, Ethereum appears poised for an institutional era. At Wealtris, we ensure our clients are prepared—early, efficiently, and profitably.