BTCUSD has Breakout from major resistance of 110 K and now takinBTCUSD has Breakout from major resistance of 110 K and now taking pause by consolidation
BTCUSD trade ideas


Bullish bounce?The Bitcoin (BTC/USD) is falling toward the pivot and could bounce to the 1st resistance.
Pivot: 111,241.55
1st Support: 98,383.98
1st Resistance: 127,752.45
Risk Warning:
Trading Forex and CFDs carries a high level of risk to your capital and you should only trade with money you can afford to lose. Trading Forex and CFDs may not be suitable for all investors, so please ensure that you fully understand the risks involved and seek independent advice if necessary.
Disclaimer:
The above opinions given constitute general market commentary, and do not constitute the opinion or advice of IC Markets or any form of personal or investment advice.
Any opinions, news, research, analyses, prices, other information, or links to third-party sites contained on this website are provided on an "as-is" basis, are intended only to be informative, is not an advice nor a recommendation, nor research, or a record of our trading prices, or an offer of, or solicitation for a transaction in any financial instrument and thus should not be treated as such. The information provided does not involve any specific investment objectives, financial situation and needs of any specific person who may receive it. Please be aware, that past performance is not a reliable indicator of future performance and/or results. Past Performance or Forward-looking scenarios based upon the reasonable beliefs of the third-party provider are not a guarantee of future performance. Actual results may differ materially from those anticipated in forward-looking or past performance statements. IC Markets makes no representation or warranty and assumes no liability as to the accuracy or completeness of the information provided, nor any loss arising from any investment based on a recommendation, forecast or any information supplied by any third-party.

BTCUSDWe are favoring more of the sell sides to give us a better risk to reward while the buy side we will be risking a little on it.


LONG BTC hello.
i m expecting to long from the w biSI
and the target is the projection
of course i will not go in without confirmation and 4 h bisi would be good
i will wait the price to give me an 4 h bisi then i will buy .targets are on the chart 1.62 fibo
is perfect

Bitcoin: 130K AREA Upon Triangle Break Out.Bitcoin consolidating in a sub wave 4 and poised to break out (see triangle formation on chart). This breakout would be the sub wave 5 which can take price as high as the 133K to 134K area. In my opinion, this can be the completion of the broadest impulse wave (5th of the 5th). Wave counts aside, this is EXTREMELY important to recognize because it highlights significant price vulnerability and implies very high risk for longs (especially for investors). Of course, these price moves do not play out unless accompanied by a specific catalyst. We have the catalysts in place to drive price higher, but what can lead to a broad corrective structure? Who knows.
There are numerous drivers in play at the moment: the weakening dollar, tariffs, favorable legal environment, etc. And all the talk, videos and other propaganda all point to the continuation of this trend. The broader markets, metals, Ethereum, whatever asset it is, it is continuously going higher with little to no variance. The recipe for total complacency while risk is increasing. Back in April, before the pullback, things looked similar, and then the unexpected reaction to the tariff news at the time. No one saw that coming, and when it came, NO ONE saw or expected that we would be pushing all time highs across EVERYTHING in just a matter of months. When the top is in, the correction will likely be similar or worse. The market is be driven by a declining dollar, not a growing economy.
For the next leg higher into the 130's, what for swing trade or day trade setups. The trend is pretty clear, so it is all a matter of confirming mini pullbacks and continuation or reversal patterns on smaller time frames. Risk can be managed using reference levels on smaller time frames like 4H or 1H for swing trades. The Trade Scanner Pro also provides precise confirmations along with risk and profit objectives. There is plenty of opportunity and ways to play this, without having to get caught as an investor.
The scenario on the chart that illustrates price going to the 130K area assumes a break out occurring this week. IF the market chooses otherwise, like it breaks the low of the triangle instead, then it lowers the probability of the bullish scenario playing out. It's up to the market to choose, all I can do is map out scenarios based on the structure that is in play at the moment.
Either way, it is important to always accept that markets are mostly random. Price action is shaped by the perceptions of the future which can change on a whim. There is no need to feel like you are missing out because when things look their greatest, that is often the worst time to buy and vice versa.
Thank you for considering my analysis and perspective.

$BTC Is moving alongBTC‑USD | 2‑Week Chart – Quick Read
Structure & Trendlines
* Price continues to respect the 2019‑2025 rising green channel and has flipped the 2017‑2021 orange trendline from resistance to support.
* A fresh break‑of‑structure above the 2021 ATH confirms continuation. Invalidation sits near the channel base / 65‑70 k demand zone.
Fib Road‑Map
* 1.618 extension (\~90 k) was reclaimed and back‑tested.
* Next confluence levels are the 2.618 (\~180 k) and 4.236 (\~240 k) extensions, matching thin volume nodes on the VPVR.
Momentum
* Multi‑time‑frame RSIs have broken their downtrends and pushed firmly bullish, echoing the 2020 breakout posture.
* The 2‑week MACD histogram has flipped positive with a higher‑low signal—momentum rebuilding.
Volume Profile
* Highest historical volume sits 15‑35 k; above 120 k liquidity thins sharply until ~160 k.
Near‑term downside risk
* The last episode of aggressive Fed rate cuts (March 2020) triggered a sharp washout before the subsequent melt‑up.
* Cuts keep getting deferred because unemployment remains low and jobs data solid; if a sudden pivot arrives on weakening data, a risk‑off flush toward the mid‑channel zone (≈ 80‑90 k) is possible before higher targets re‑engage.
Macro uptrend intact; pullbacks to the channel centre are buy‑the‑dip territory while momentum and structure favour an eventual 161.8 → 261.8 push, but stay nimble for policy‑driven volatility.

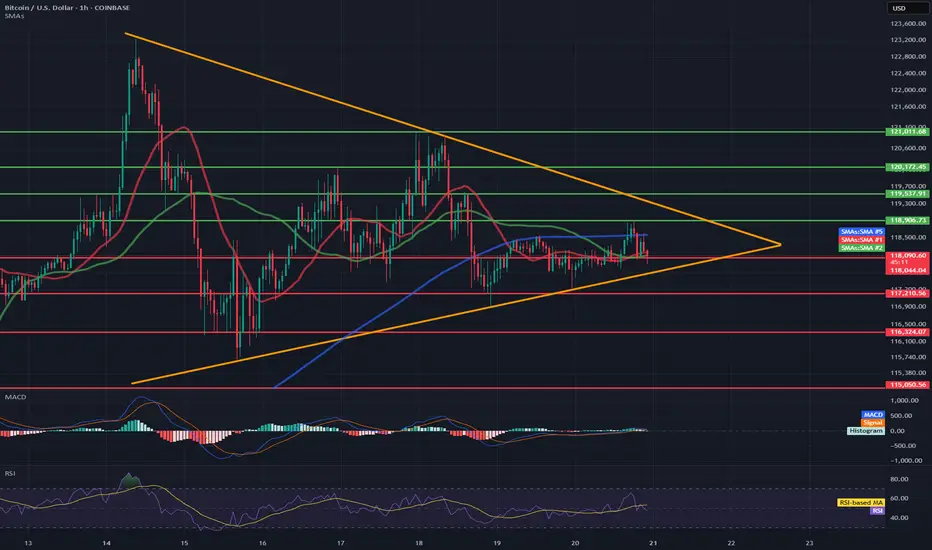
BTC/USD Short-Term🔷 Pattern: Symmetrical Triangle (Consolidation)
The price is inside the triangle formation (orange lines) and is approaching its completion.
An impending breakout (up or down) is highly probable within the next few hours.
📉 Support Levels (red lines):
117.210 – local horizontal support.
116.324 – 115.050 – strong demand zone (potential target in the event of a downward breakout).
📈 Resistance Levels (green lines):
118.900 – 119.700 – local resistance zone.
121.011 – 121.813 – higher target in the event of an upward breakout from the triangle.
📊 Technical indicators:
✅ RSI (Relative Strength Index):
Currently: 69.05 – close to overbought levels, but not yet at an extreme.
Potential for a short-term pullback unless a strong breakout occurs.
✅ MACD:
Signal lines are tightly intertwined, histogram flat → no dominant momentum.
Waiting for a breakout signal (bullish or bearish crossover).
✅ SMA:
Price currently below the 50 and 200 SMA for 1 hour → slight downward momentum.
The 50-SMA (red) is turning down, which may signal a continuation of the sideways or downward trend.
📌 Short-term conclusions (1–6 hours):
Scenario 1: Bullish breakout:
Confirmation: H1 candle close above 118,900.
Targets: 119,700 and potentially 121,000–121,800.
Scenario 2: Bearish breakout:
Confirmation: H1 candle close below 117,200.
Targets: 116,300, then 115,000–115,300.
📍 Watch for:
Breakout of the triangle boundaries with volume.
RSI behavior relative to the 70 level.
MACD crossover and histogram.
#202529 - priceactiontds - weekly update - daxGood Day and I hope you are well.
comment: Prior weeks close was 24332 and this was it was 24386. Bulls need to continue with higher lows and bears need to break below 24000 for lower prices. Not more magic to.
current market cycle: bull wedge
key levels for next week: 24000 - 25000
bull case: Bulls are still in control until we print lower lows again. We have 2 potential bull trend lines close to the daily ema and that’s around 24200 and will be my line in the sand for bulls next week. Below, chances of 24000 go up big time. If we stay above 24300, there is no reason we can not test back up to 24500 and above that we will likely try 24700+ again.
Invalidation is below 24000
bear case: Bears need a lower low below 24000. That’s really all there is to it. As of now the selling on Friday was decent but it’s not enough to expect follow-through selling. Below 24000 I think we can test the 50% retracement at 23900 but I’d be surprised if we go lower. Only an event could trigger that. Lower targets would be as marked on the chart.
Invalidation is above 24749
short term: Neutral. I want follow-through selling but will likely won’t get it. It’s still a bull wedge until we have a daily close below 24000.
medium-long term from 2025-06-29: Bull surprise last week but my targets for the second half of 2025 remain the same. I still expect at least 21000 to get hit again this year. As of now, bulls are favored until we drop below 23000.
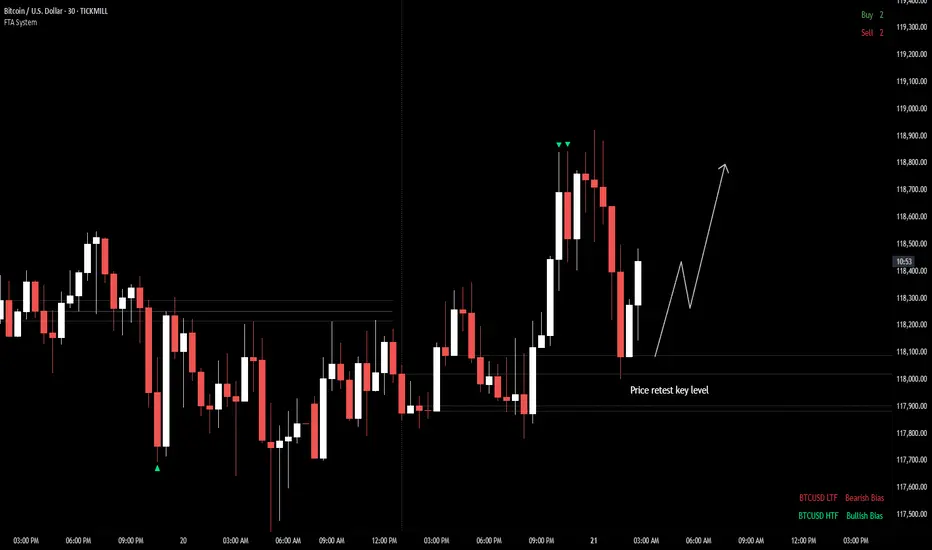
BTC/USD — Potential Bullish BreakoutBitcoin is currently retesting a key intraday level after pulling back from recent highs. If price continues to hold above this level, potential for break above previous highs.
As long as the structure holds and continue bullish momentum. However, if price slips back below the level with momentum, this scenario may be invalidated.
📌 Bias: Neutral to Bullish
📌 Timeframe: Intraday / Short-term
📌 Key Level to Watch: 118K
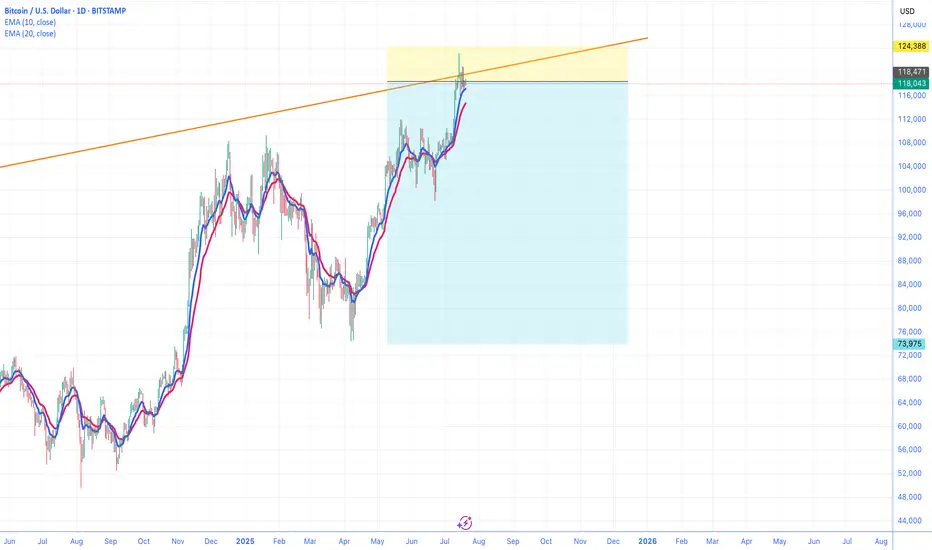
BTC Daily Outlook
In my opinion, Bitcoin looks like it might need a short pause here.
📉 It's sitting just below a key Fib level and may require some time to consolidate before making another attempt.
📌 Price is printing a possible second close below the BB center.
📉 SMA is below the BB center — not ideal.
📊 Volume saw a strong red spike on July 15
📉 OBV formed a lower high while price remains elevated (granted, it’s the weekend and volume tends to dip).
📉 RSI is below 70 and under its moving average.
Too early for a strong conclusion — but this is a caution signal.
Let’s stay alert and watch it unfold together.
Always take profits and manage risk.
Interaction is welcome.


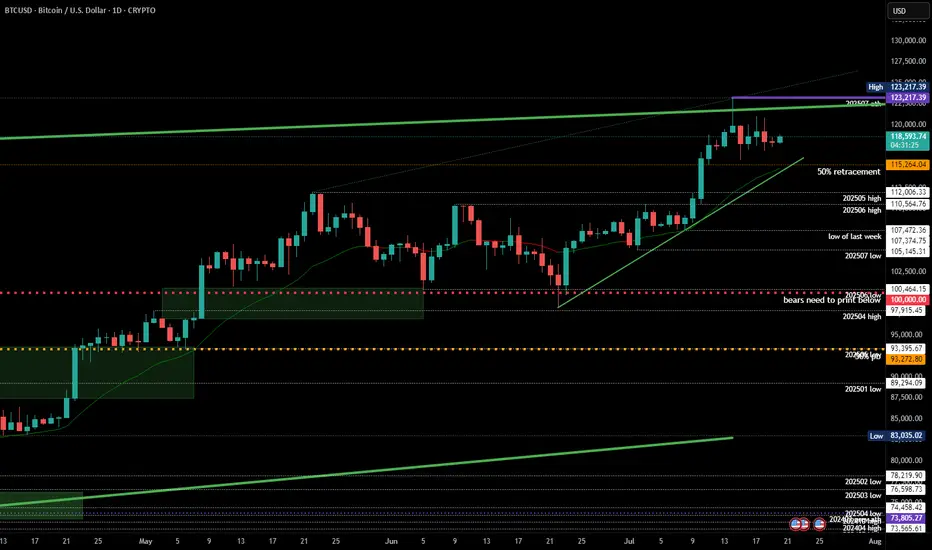
BTCUSD Daily Setup In the daily timeframe, Bitcoin is in an upward trend. We expect it to correct to the fvg of 115,330 to 112,140. If the daily candle does not close below this fvg, we expect Bitcoin to grow and rise to the range of 138,000 and 140,000. Then we will have a large correction and decline from the range.
#XAUUSD #ICT #OrderBlock #FundedTrader #TradingStrategy

Jul 20 | Crypto-market reviewNew Crypto-Sunday market review video, where I share my current analysis on the trend structures of BTC, ETH, SOL, XRP, HYPE and other alt- and mem-coins of interest to my, highlighting key support and resistance zones to watch in the coming sessions.
Charts featured in the video
BTC
ETH
XRP
(!) SOL
(!) HYPE
(!) TRUMP
BRETT
(!) FET
RENDER (Weekly)
(!) DOG
(!) MOG
Thank you for your attention and I wish you happy Sunday and great trading week!
If you’d like to hear my take on any other coin you’re tracking — feel free to ask in the comments (just don’t forget to boost the idea first 😉)

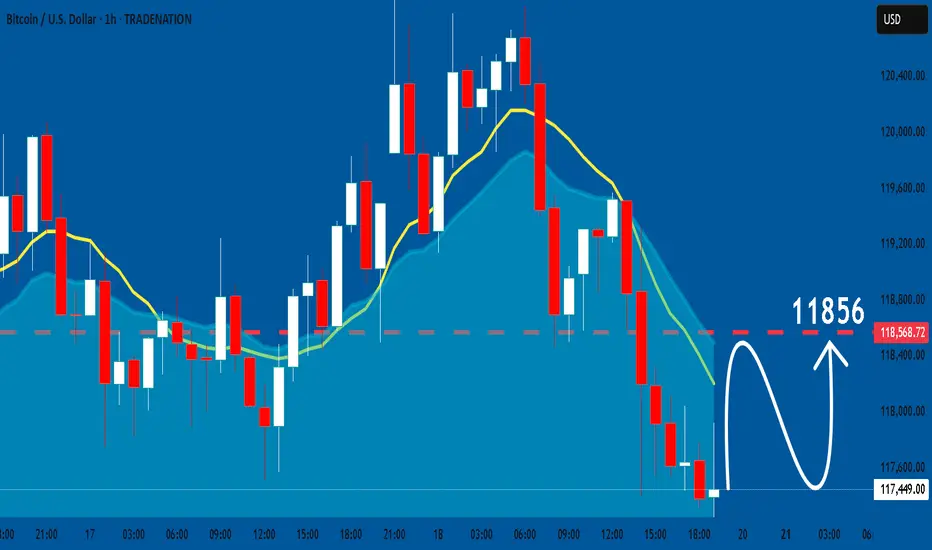
BTCUSD: Bullish Continuation
Looking at the chart of BTCUSD right now we are seeing some interesting price action on the lower timeframes. Thus a local move up seems to be quite likely.
Disclosure: I am part of Trade Nation's Influencer program and receive a monthly fee for using their TradingView charts in my analysis.
❤️ Please, support our work with like & comment! ❤️
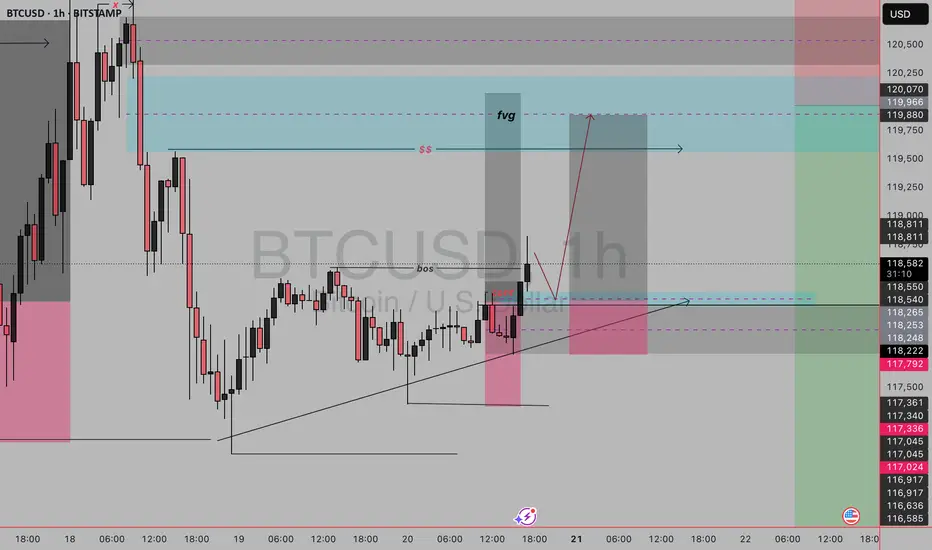
btc usd buy setupThis BTC/USD 1H setup is a Smart Money Concept (SMC) long trade, built on liquidity, market structure shift, and mitigation. Let’s break it down:
Setup Breakdown
1. Market Structure
Previous bearish leg created a deep selloff.
Price swept a low, broke above a structure (BoS = Break of Structure) → indicating possible reversal intent.
2. Liquidity Sweep
See the “x” mark near the top and the large wick that tapped above the previous high?
That was a buy-side liquidity grab.
Price then reversed aggressively, hinting it was a stop hunt, not genuine buying.
3. Break of Structure (BoS)
Confirmed bullish intent.
The BoS you marked shows that the last lower high was broken, turning structure bullish.
4. Entry
Price returned into a demand zone (pink box) after the BoS.
The area aligns with:
Demand zone (bullish OB)
Fair Value Gap (FVG) just above it.
The ascending triangle pattern in the recent candles added confluence of bullish pressure before breakout.
5. FVG & Target Zone
You're targeting the FVG + Supply Zone marked in light blue around 119,900–120,400.
It's aligned with:
Liquidity cluster
Previous supply structure
That’s a logical area where price might slow down or reverse.
Trade Plan
Entry: After price retests demand and shows bullish signs.
Stop Loss: Below the demand zone and recent swing low (~116,585).
Take Profit: Top of the FVG/supply zone (~120,400–121,250).
Risk-Reward: Solid R:R ~1:3 or higher.
BTCUSDBTCUSD needs some more correction before we continue the same trend.
Disclosure: We are part of Trade Nation's Influencer program and receive a monthly fee for using their TradingView charts in our analysis.

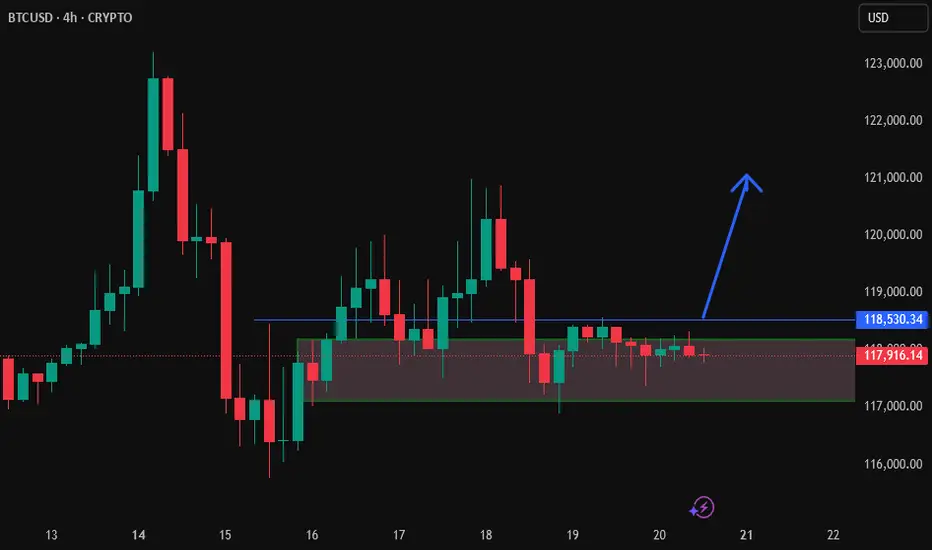
BTC - Breakout, Fakeout… or Loading Zone?BTC is back inside the $116K–$117K demand zone — same level that launched the last breakout.
But this time? Consolidation. Stoch RSI stuck mid-range. Unclear momentum.
The Hull Suite Strategy nailed the previous breakout with clean stacked buys — but it’s showing hesitation now.
This is where strategy testing really matters. Not every system handles chop the same.
📊 We test these setups across multiple variations — especially in zones like this where most signals lose edge.
Support flip or breakdown brewing? Watching closely.
—
#BTCUSD #Bitcoin #HullSuite #StrategyTesting #BacktestBetter #QuantTradingPro #CryptoAnalysis #TradingView

btcusd sl;116.7k
Bitcoin is the first ever cryptocurrency to exist, which was created in 2009 by Satoshi Nakamoto and has since become the most valuable asset on the digital market. It operates without the need for intermediaries, relying solely on cryptography and netw
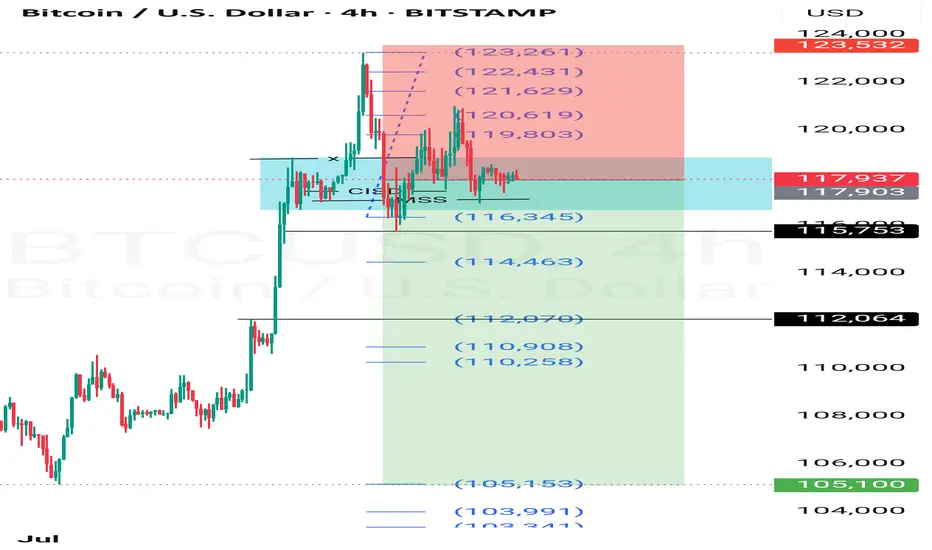
Sell BTCUSDPrice had taken liquidity and broke cisd and mss. Trump also swears to make america great again...usd should grow stronger.
What say you?
Braxons Group: How Cryptocurrency Became Part of Everyday SpendiOver the past five years, cryptocurrency has gradually moved beyond the narrow confines of a speculative asset toward what it was meant to be from the start — a fully functional means of payment. In July 2025, a study by Bitget Wallet confirmed a significant shift in consumer behavior: millions of users worldwide now use digital assets to pay for goods, games, and travel.
Braxons Group analysts see this not just as a trend, but as a clear sign that crypto is entering a mass-adoption maturity phase.
Crypto in Shopping: From Enthusiasts to Households
According to the study, 35% of users now use cryptocurrency for everyday purchases — not only for digital goods, but also for paying for food, services, and essential products.
Braxons Group notes a sharp rise in crypto payment integration with POS terminals and online marketplaces, especially in Southeast Asia, where digital wallets often replace bank cards. The growth is driven by low fees, lack of bank control, and instant settlements — particularly via USDT and BUSD.
Gaming: The Key Engagement Driver
36% of users regularly use cryptocurrency for in-game purchases and Web3 applications. This comes as no surprise: NFT items, premium memberships, and tokenized game assets are now core components of most gaming economies.
Braxons Group highlights that Gen Z and millennials form the backbone of this new crypto audience. Their willingness to spend tokens on in-game content demonstrates high adaptability and low entry barriers.
This is an important investment signal: companies operating at the intersection of crypto and gaming will likely become dominant growth drivers over the next 3–5 years.
✈ Travel: Crypto Crosses Borders
Around 35% of respondents use cryptocurrency for booking tickets, hotels, and travel services. For Braxons Group, this validates the hypothesis that crypto is the ideal tool for global users — eliminating currency restrictions, reducing banking fees, and enabling direct bookings without intermediaries.
Among older demographics (Gen X), trust in crypto for high-value transactions is increasing. This marks a shift in the market: a sector once dominated by speculation is now becoming practically useful for everyday needs.
Regional Differences
The Bitget study revealed notable geographic patterns:
Southeast Asia — leader in everyday crypto payments (up to 41%)
Africa — active use for education payments
Latin America — strong e-commerce adoption (up to 38%)
Middle East — growing interest in high-ticket purchases (cars, tech, luxury goods)
For Braxons Group, this means the decentralized payments market is becoming multi-layered and globally fragmented, requiring region-specific solutions.
Braxons Group’s Conclusion
Our team concludes that cryptocurrency is evolving from an investment class into a transactional tool. It no longer makes sense to view digital assets solely as a store of value or speculative vehicle.
What was once an experiment is now daily reality:
Gamers buy NFTs and passes with tokens.
Households purchase groceries with stablecoins.
Travelers book accommodation with ETH.
The next step? Integrating cryptocurrency into banking and government systems. For businesses, this means embedding crypto infrastructure is now a must-have for digital competitiveness.
