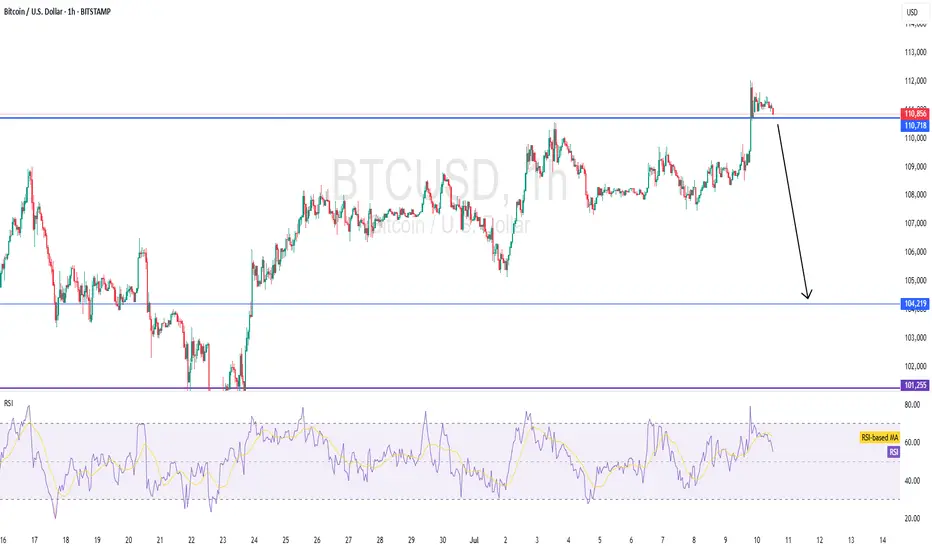
BTC Just Hit the Brakes – Is the Pump Over?Bitcoin just tagged the upper Bollinger Band on the 1H chart while Stoch RSI maxed out and crossed down — a classic signal of volatility exhaustion combined with a momentum slowdown.
Technical Breakdown:
Bollinger Band Top: Price tapped the upper band, often a sign of near-term overextension
Overbought Stoch RSI (July 9th): RSI hit 97+ and flipped — momentum may be shifting
Cooling Phase? Price is stalling inside a tight range with low follow-through
arget Zone: $109K or BB midline as a possible mean reversion area
This is a high-probability zone for a pullback setup or a more attractive long opportunity if momentum resets.
BTCUSD trade ideas

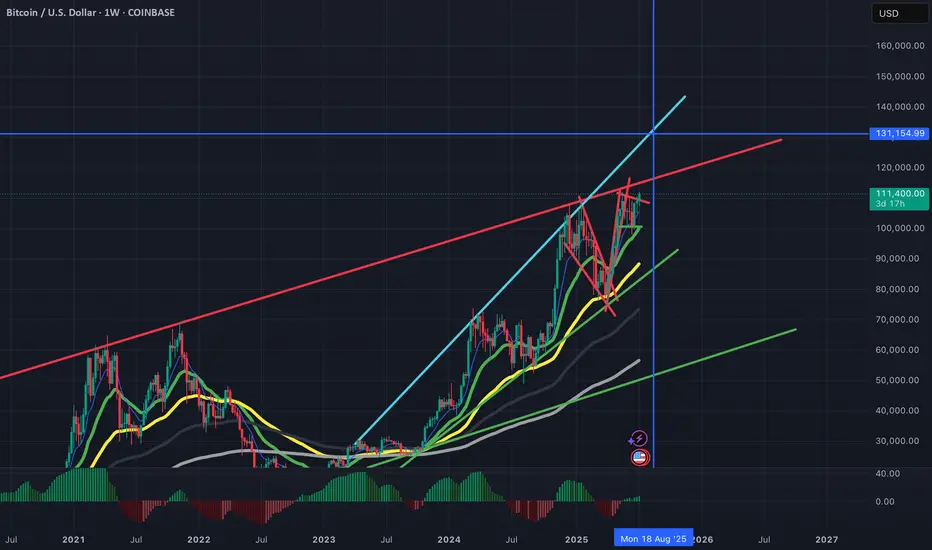
111-112 Resistance LevelOnce BTC breaks above the 111-112 resistance level and flips it into support we should see price run to 125+ rather quickly. If history echoes, price discovery could easily touch 150, if not 175-200. Also, we should see BTC entering the "euphoric" phase of the cycle around the week of Aug 18th. Fun days are ahead :) remain vigilent!

BITCOIN - SELL TO $86,000 (8H UPDATE)Bitcoin spiked up last night, but just about missed our 'Invalidation Zone' of $112,140 by a few pips. As long as this level can hold & sellers move back down, this sell analysis is still valid.
A lot of whipsaw price action in the markets right now, so use stick risk management.

BTC Analysis TO 112,981 LEVELS AND BEYOND ? Good morning folks
BTC analysis with a little correction down to 110,300- 109,300 levels then a drive up to 112-113K levels
Let me know what you think
Kris/Mindbloome Exchange
Trade Smarter Live Better
Bitcoin at Triple Resistance – Will the Third Time Break It?BTC/USD is pressing against a key resistance zone near $112,500 for the third time in recent months.
This time, the breakout attempt is backed by a clear ascending trendline, showing sustained bullish pressure from the lows.
Highlights:
Triple top formation? Or ascending triangle breakout?
$112.5K has rejected BTC twice already
Higher lows = buyers stepping in more aggressively
Watch for volume surge and daily close confirmation
Break above = $118K–$120K likely in play.
Reject = revisit of trendline support near $106K.

BTCUSDT - single supporting area, short below .#BTCUSDT.... now we have single and immediate supporting area, that is around 110700-800
keep close and only it can stay above for further buying scenarios otherwise not.
so stay sharp and only short below that.
good luck
trade wisely
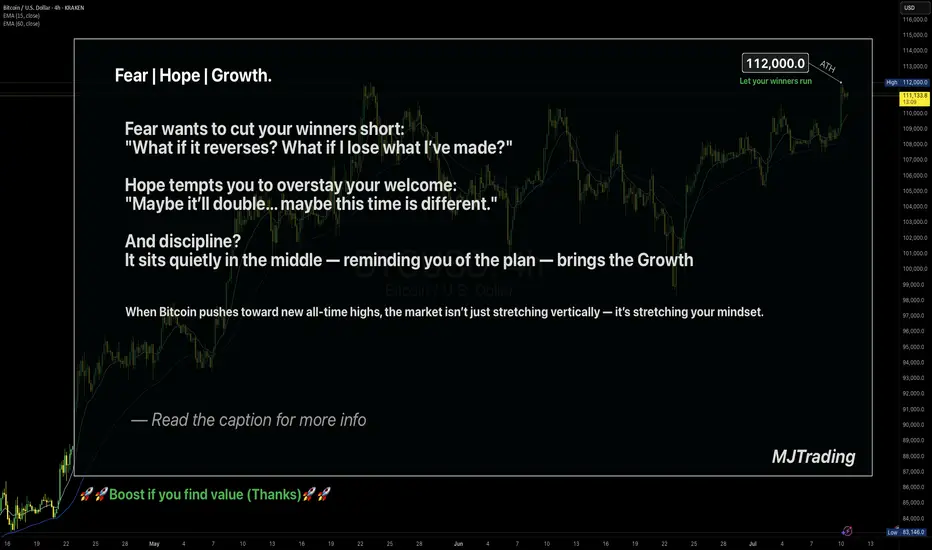
Let your winners run🧠 Fear | Hope | Growth – When Trading Meets Emotion
The message on the chart isn't just poetic — it's real psychology.
🔹 Fear wants to cut your winners short.
It sneaks in after a small move in your favor.
"What if it reverses? I better lock this in."
And just like that, a great trade turns into a missed opportunity.
🔹 Hope drags you into holding too long.
It dreams: "Maybe it doubles... maybe this time it'll be massive."
But it's not guided by data — it's driven by fantasy.
🔹 Discipline is what sits in the middle.
Quiet. Neutral.
It doesn’t scream or seduce — it just follows the plan.
And that’s where Growth lives — not just on the PnL, but in your psychology.
When Bitcoin pushes toward new ATHs, these emotions get amplified.
The real question becomes: Can you manage yourself, not just your trade?
📌 A Real Example from My Desk
In my earlier BTCUSD idea — “Another Edge – Decision Time” (shared above) —
I sent that setup to one of my managed clients.
He entered long exactly at the edge of the channel — a clean, strategic buy.
Price moved beautifully in our favor…
But he manually closed the trade at 106,600 — long before the move matured.
Why?
Because fear of giving back profit overwhelmed the original plan.
The chart was right. The timing was right.
But the exit was emotional, not tactical.
✅ The trade made money.
❌ But the lesson is clear: a profitable trade doesn’t always mean a disciplined one.
🎯 Final Takeaway:
“Fear kills your winners. Hope kills your timing. Discipline grows your equity and your character.”
🗣 What would you have done in that position?
Held longer? Closed at resistance? Let it run toward ATH?
Let’s talk psychology — drop your thoughts 👇
#MJTrading
#TradingPsychology #BTCUSD #FearHopeDiscipline #LetYourWinnersRun #PriceAction #BTCATH #ForexMindset #CryptoStrategy
BITCOIN BEARS WILL DOMINATE THE MARKET|SHORT
BITCOIN SIGNAL
Trade Direction: short
Entry Level: 111,047.38
Target Level: 109,294.85
Stop Loss: 112,211.89
RISK PROFILE
Risk level: medium
Suggested risk: 1%
Timeframe: 2h
Disclosure: I am part of Trade Nation's Influencer program and receive a monthly fee for using their TradingView charts in my analysis.
✅LIKE AND COMMENT MY IDEAS✅

Bitcoin Makes New All Time High - BrieflyBitcoin briefly made a new all-time high yesterday, tagging $112,000 before pulling back slightly. The breakout came after a multi-week consolidation that formed higher lows and built pressure just below resistance. Price is now hovering just under that key $112K level, which has become the short-term line in the sand for bulls. A daily close above would confirm the breakout and likely bring strong continuation, but for now BTC remains in a tight battle between buyers and sellers.
The 50-day moving average continues to trend upward and is providing dynamic support, while the recent surge in volume suggests traders are positioning for a larger move. If price fails to break cleanly above $112K, we could see a short-term retest of the $105,787 area – the previous breakout level – before any further upside. Overall, Bitcoin remains in a strong uptrend, with the path of least resistance clearly higher if bulls can secure a decisive close above all-time highs.

BITCOIN facing the most important Roadblock of the Cycle.Bitcoin (BTCUSD) reached $112000 yesterday, testing the May 22 2025 All Time High (ATH) and immediately got rejected. This ATH rejection is key to the continuation of the bullish trend as the entirety of the ATH Resistance Zone is perhaps the last (and most important) Roadblock before the final rally of the Cycle that could potentially price the new Top.
You can see that this Resistance Zone already had 3 rejections previous on its bottom and yesterday was the first one on its top.
A break above it can target $118400 at least within days, in anticipation of a +10.20% Bullish Leg, similar to the one following the June 22 Low.
If the rejection prevails however, we may see a pull-back that will test the bottom of the (blue) Channel Up.
Which scenario do you think will prevail? Feel free to let us know in the comments section below!
-------------------------------------------------------------------------------
** Please LIKE 👍, FOLLOW ✅, SHARE 🙌 and COMMENT ✍ if you enjoy this idea! Also share your ideas and charts in the comments section below! This is best way to keep it relevant, support us, keep the content here free and allow the idea to reach as many people as possible. **
-------------------------------------------------------------------------------
💸💸💸💸💸💸
👇 👇 👇 👇 👇 👇

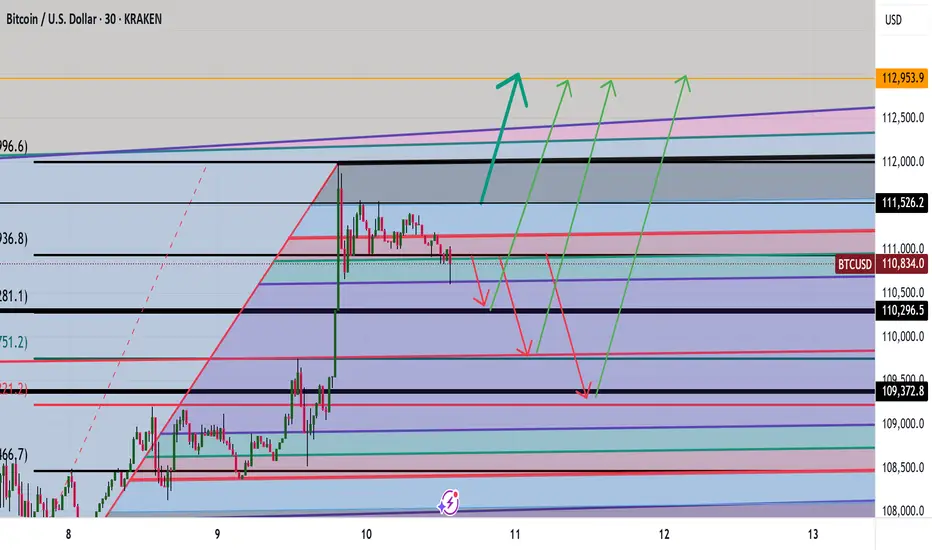
July 7 Bitcoin Bybit chart analysisHello
This is Bitcoin Guide.
If you "follow"
You can receive real-time movement paths and comment notifications on major sections.
If my analysis was helpful,
Please click the booster button at the bottom.
Here is the Bitcoin 30-minute chart.
There is no separate Nasdaq indicator announcement today.
I think the Nasdaq lower gap section retracement will be the focus.
Recently, sideways movement or adjustments have been coming out before the trend,
So I proceeded safely in preparation for variables.
*When the blue finger moves
Bidirectional neutral
Short->long switching or 2nd section long waiting strategy
1. $109,380 short position entry section / cut-off price when orange resistance line is broken
2. $108,997.8 long position switching / cut-off price when purple support line is broken
3. $109,610.9 long position 1st target -> Top 2nd target -> Good 3rd target
It seems important whether the purple support line is broken from the current position. If the first section at the top touches 108,997.8 dollars and comes down,
it may become a vertical decline section.
If it comes down right away, it is a long-waiting strategy in the final second section,
and if it deviates from the bottom section today
(6+12 pattern)
because it is a full candle when the gap section is touched,
it may fall to 107,484 dollars indicated at the very bottom.
I have important work to do tomorrow,
so I will take a day off and come back on Wednesday.
Please use my analysis so far for reference and
I hope you operate safely with principle trading and stop loss prices.
Thank you.

BTCUSD BULLISH MORE all time high again The price may briefly break above the 113,000–114,000 level (first target) to trap long positions, then sharply reverse.
Support Break Warning:
If BTC fails to hold the 110,000–108,000 support zone, it could accelerate a drop to deeper supports:
Support Area 1: 106,000
Support Area 2: 102,000
Extreme Bearish Target: 96,000–94,000
What to Watch:
Bearish divergence on lower timeframes
Volume drop on new highs = possible fakeout
Candle rejection from 113,000–114,000 zone

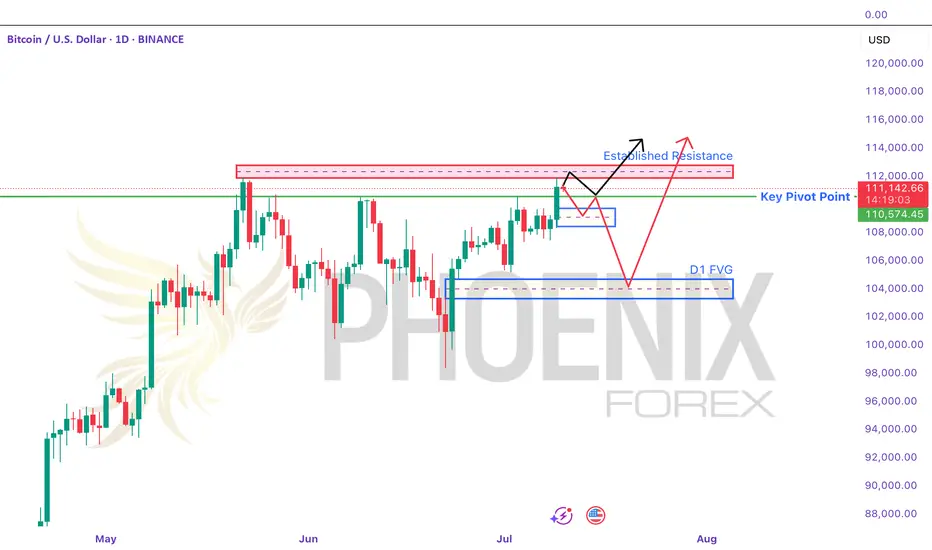
BTCUSD At Crucial Pivot Point. Is This The Ceiling? - PhoenixFX BTCUSD Price-Action Analysis & Scenarios
Below is an overview of the two possible paths for Bitcoin over the coming days, as sketched out by the black and red arrows on your chart. We’ll also highlight the key pivot level and resistance zone that will decide which scenario plays out.
🔵 Key Levels to Watch
Established Resistance (~$111,800–$112,500)
This zone marks multiple failed attempts to break higher in recent weeks. It’s where large stop-runs and sell-side limit orders tend to cluster. A decisive daily close above $112K is required to signal genuine bullish continuation.
Daily Pivot Point (~$110,600)
Acting as the “battle line” between bulls and bears, this pivot is the first level to confirm market bias.
Above $110.6K: Tends to favor buyers, suggesting strength and higher-high attempts.
Below $110.6K: Gives the bears the edge, increasing the odds of deeper retracements.
📈 Black-Arrow (“Bullish Continuation”) Scenario
Break & Hold Above Resistance
Price thrusts cleanly above $112K on strong volume.
Retest the H4 Order Block (~$111,000–$111,200)
A shallow pullback into the highlighted H4 demand zone (blue box) offers a lower-risk long entry.
New Highs
From there, Bitcoin resumes its uptrend, closing the week with fresh highs above the prior $113K peak.
Key Trigger: Sustained daily close above $112K, followed by a successful retest of that level.
📉 Red-Arrow (“Bearish Rejection & Dip”) Scenario
Rejection at Resistance
Price stalls and reverses somewhere between $111,800–$112,500, forming a bearish reversal candle.
Drop to Daily FVG Zone (~$104,000–$105,000)
This larger Daily Fair-Value Gap (blue box lower on the chart) coincides with strong weekly support—an ideal zone for dip buyers.
Recovery Rally
After absorbing selling pressure in the FVG, BTC bounces back toward the established resistance, setting up a second test of $112K.
Key Trigger: Clear bearish price action (e.g., engulfing or pin-bar) in the $111.8K–$112.5K zone, followed by a daily close below the pivot at $110.6K.
🎯 How to Trade These Setups
Bullish Entry:
Wait for daily close > $112K
Enter on pullback into $111K–$111.2K (H4 order block)
Stop below $110.6K pivot; target new highs above $113K+
Bearish Entry:
Look for bearish reversal signals in $111.8K–$112.5K
Enter on break & close below $110.6K pivot
Target $104K–$105K (Daily FVG); stop above $112.5K
Note: The pivot at $110.6K is your first “line in the sand” for bias—trade in the direction of the break, and use the major resistance zone to confirm strength or failure. Always manage your risk and adjust to how price actually unfolds!
Just a Heads-Up:
This is my take on the charts—not gospel, not financial advice, and definitely not a crystal ball 🔮. Trading is part skill, part patience, and part “what just happened?” 😅
We all see things a little differently, and that’s the beauty of it. So if you’ve got a hot take, wild theory, or just want to drop some chart wisdom—hit the comments!
Let’s grow, learn, and laugh through the madness together. 🚀📈
Each one, teach one.
— Phoenix FX Team 🔥🦅
BTC / ETH / SOL / XRP / HYPE: Potential Trend StructuresIn this video, I share my current daily and weekly analysis on the trend structures of BTC, ETH, SOL, XRP, and HYPE, highlighting key support and resistance zones to watch in the coming sessions.
Charts featured in the video:
BTC
ETH
SOL
XRP
HYPE
Thank you for your attention and I wish you successful trading decisions!
If you’d like to hear my take on any other coin you’re tracking feel free to ask in the comments (just don’t forget to boost the idea first 😉).

115.70K is the next one, 107K - RiskMorning folks,
Just to keep it short... our butterfly worked perfect, we've got our 111.65K target. Overall sentiment stands bullish. But - we do not want to see just stops grabbing around the top (aka Wash&Rinse). We want stable standing above broken daily trendline out of the flag consolidation .
So BTC has to stay above 107K lows to keep bullish context valid. That's why, if you plan to buy - you do not need to consider too far standing levels and lows for stop placement.
If, still, BTC drops under 107K, we suggest deeper retracement, under 100K level.
Conversely, if everything goes as we plan, next upside target is 115.70K.
So, if you plan to Buy: use local deeps on 1H chart and control 107K lows. This is your invalidation point.
If you want to sell: watch for clear signs of W&R of the top - engulfing patterns, spikes etc and following reversal patterns on 1h chart. Say, H&S, or any other.
For now I mark this setup as bullish.

BTC/USD 1H chart Pattern.BTC/USD 1H chart I shared, the chart shows a bullish breakout pattern forming (likely a symmetrical triangle breakout).
Target Points Identified:
1. First Target:
📍 109,750 USD
2. Second Target:
📍 110,750 USD
---
Key Notes:
Breakout above the descending trendline signals a bullish move.
Ichimoku cloud is thinning, suggesting possible momentum if price breaks upward.
Make sure to confirm the breakout with strong volume.
Let me know if you want stop-loss levels or a detailed trade setup.

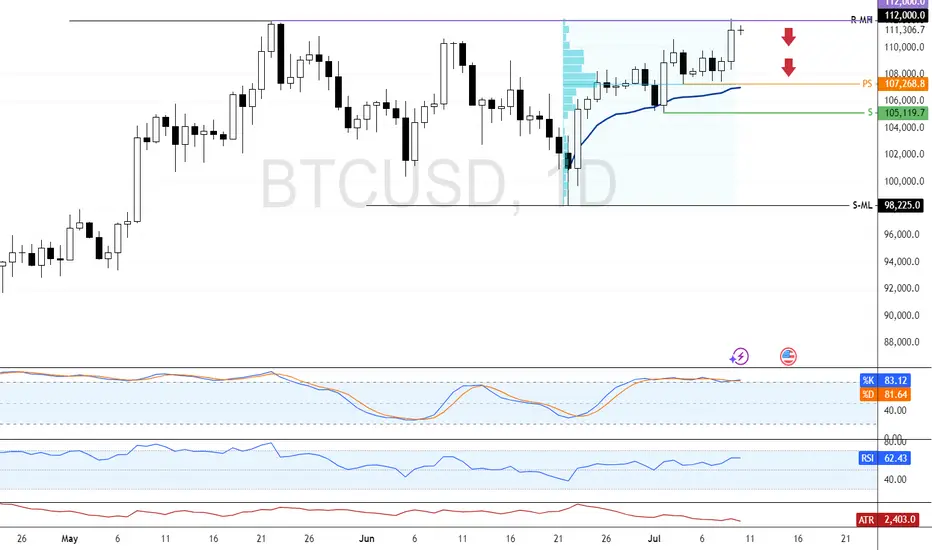
Bitcoin Tests Record High as Momentum FadesBitcoin is bullish, testing the all-time high at $112,000.0. Stochastic shows an overbought reading of 83.0, indicating momentum may stall.
As of now, BTC trades slightly below this level. Since it's the first test of $112,000.0, consolidation could follow. If bulls fail to break higher, price may dip toward $107,268 and $105,119.0 supports.
Bitcoin Breakout Watch – BTC/USD UpdateBTCUSD is currently consolidating above the $112,000 level — a critical price zone that could mark the beginning of a new leg higher.
If this consolidation holds, it signals strong buyer interest and sets the stage for a potential breakout. The next major target lies at $120,000, aligning with the 161.8% Fibonacci extension, a key level often associated with explosive momentum moves.
💡 This setup reflects growing confidence in the crypto space and may attract institutional inflows if confirmed.

BTC POTENTIAL BULLS TRAP IN DEVELOPMENTI am inspecting the 4 hour candle in comparison to the daily chart on BTC and it seem we have all the characteristics of a bulls trap on the chart. If the next 4 hours candle does not close bullish, it will confirm a bulls trap and price will likely pullback into the triangle. So be cautious trading at this resistance level.
Bull Trap Chart Characteristics
Look for:
A strong bullish candle that breaks above recent highs or resistance.
Volume spike on the breakout — signs that traders are buying.
Followed by a sharp bearish candle (like a shooting star, bearish engulfing, or long wick).
Price falls back below resistance, turning the breakout into a fakeout.
Cheers !!

BITCOIN Will Go Up From Support! Buy!
Take a look at our analysis for BITCOIN.
Time Frame: 2h
Current Trend: Bullish
Sentiment: Oversold (based on 7-period RSI)
Forecast: Bullish
The market is testing a major horizontal structure 108,796.02.
Taking into consideration the structure & trend analysis, I believe that the market will reach 110,156.53 level soon.
P.S
Please, note that an oversold/overbought condition can last for a long time, and therefore being oversold/overbought doesn't mean a price rally will come soon, or at all.
Disclosure: I am part of Trade Nation's Influencer program and receive a monthly fee for using their TradingView charts in my analysis.
Like and subscribe and comment my ideas if you enjoy them!

Bitcoin Is Looking For A Bullish ContinuationMorning all! Bitcoin has impulsive characteristics on 4h time frame, and we can clearly see five waves up that can send the price even higher after recent projected ABC correction. With the current impulsive recovery back above 106k area, it confirms that bulls are still here and we should be aware of further rally in July, especially if breaks above channel resistance line near 110k area. Seems like it's in wave (1) of a new five-wave bullish impulse, so after current wave (2) pullback, we can expect more gains within wave (3).

Btc to 130k resistance Btc to 130k resistance level to watch. Confidence is high aligned with ripping higher stock market.
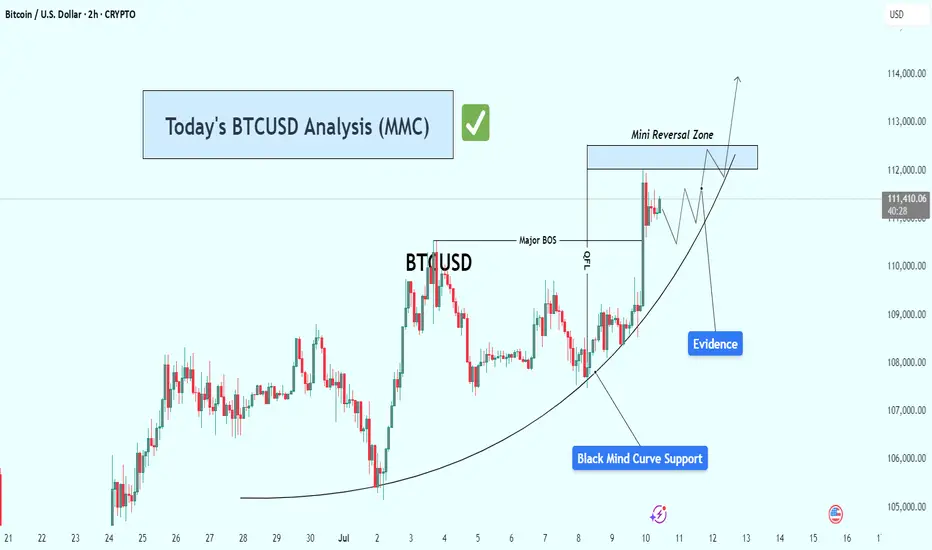
BTCUSD Analysis – Riding the Mind Curve & Bullish Setup Target🔎 Technical Narrative & Market Structure Analysis
Bitcoin is currently respecting a textbook parabolic support structure represented by the Black Mind Curve—a dynamic visual model reflecting the psychology of crowd behavior transitioning from uncertainty to confidence. This curved structure often precedes strong bullish continuation patterns, especially when paired with evidence of smart money involvement.
The current price action shows sequential higher lows, each of which is supported directly by the Mind Curve. These bounces confirm demand stepping in consistently at higher levels, a strong sign of controlled accumulation and momentum building.
🧠 Key Chart Components Explained
✅ 1. Mind Curve (Dynamic Support)
A custom-drawn parabolic curve reflects the ongoing upward force from buyers.
Bitcoin has tested and bounced from this curve multiple times, showing it is respected by market participants.
As price hugs the curve more tightly, the compression could lead to a volatility breakout.
✅ 2. Major BOS (Break of Structure)
A significant market structure break occurred as price took out a previous swing high.
This BOS confirms a shift in market sentiment from ranging/sideways to uptrend formation.
The BOS now acts as a reference point for bullish momentum and could serve as support on a potential retest.
✅ 3. QFL Zone (Quantity following line )
Located just below the BOS, this zone marks the last area where aggressive buyers stepped in before the breakout.
These levels are often defended on a retest and are used by institutional traders to re-enter positions.
✅ 4. Evidence Candle
This sharp bullish impulse candle is what we call an "evidence candle"—it pierces minor resistances with strength and volume.
It represents institutional-level interest and confirms smart money accumulation.
Such candles typically precede either continuation or minor pullback for re-accumulation.
✅ 5. Reversal Zone (Target Zone)
This zone lies ahead at approximately 112,500 to 113,000, a confluence of previous supply, key psychological level, and potential liquidity pool.
It's the next logical area where price may pause, react, or break through if momentum sustains.
⚔️ Scenarios to Watch
🟩 Bullish Scenario:
Price continues riding the curve support upward.
Breaks and closes above the Reversal Zone, ideally with volume and continuation candle.
Potential upside extension toward 114,000–115,000.
🟨 Neutral/Consolidation Scenario:
Price consolidates just below the Reversal Zone.
May form a flag/pennant or triangle structure.
Bullish continuation likely if the curve holds beneath.
🟥 Bearish/Invalidation Scenario:
Price breaks below the Mind Curve and BOS, closing below with momentum.
This would signal a potential breakdown of the bullish structure.
Invalidation zone likely sits below 110,000, and a breakdown could open room to revisit the 108,500–109,000 area.
📌 Confluence Factors Supporting the Bullish Bias:
Respect of Mind Curve over time = hidden institutional support
Presence of BOS and QFL = structure and order block confluence
Evidence candle = high-volume trigger point
Reversal Zone = logical magnet for price, supported by liquidity and previous reactions
📈 Summary & Trading Thesis
Bitcoin is currently in a bullish microstructure within a larger range. The parabola-style Mind Curve suggests that this structure is maturing toward an inflection point. The break above BOS, evidence of strength, and alignment with demand zones all support a move toward the 112,500–113,000 Reversal Zone. If momentum sustains, this could become the start of a broader bullish leg.
📢 Final Thought:
While the setup is bullish, discipline and patience are key. Watching how price behaves around the Reversal Zone will be critical. A clean breakout or solid rejection will provide the next high-probability signal.