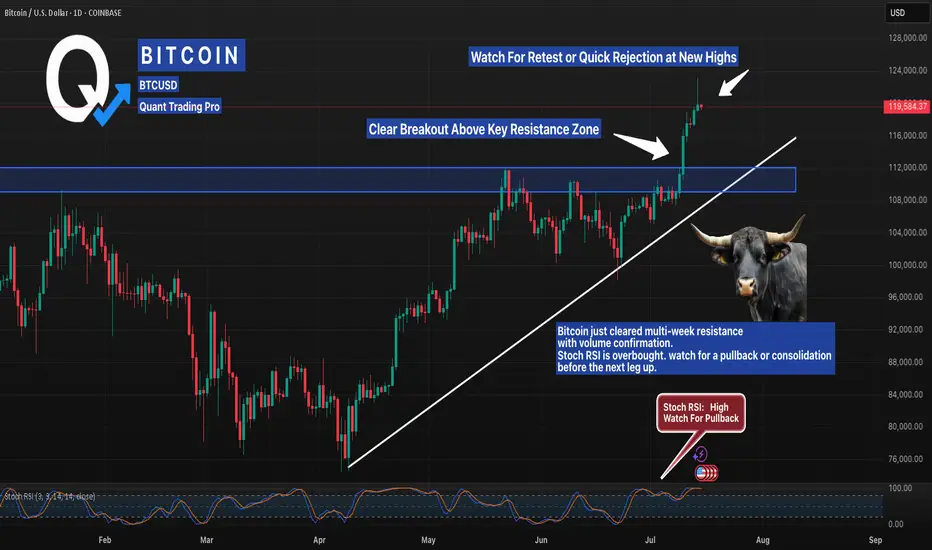
Bitcoin Just Shattered Resistance — Is a Pullback Coming Next? Bitcoin has exploded past a multi-month resistance zone with authority, confirming a breakout that’s been building for weeks. This move aligns perfectly with the rising trendline, signaling strong bullish structure. But here’s the catch — the Stochastic RSI is flashing overbought levels, a classic sign that momentum could be topping out short-term.
Smart traders are now watching two key scenarios: either we see a healthy pullback into the breakout zone (around $112K) for a textbook retest, or bulls keep control and push price into parabolic territory. If this level holds as new support, it could become the launchpad for the next major leg up.
Breakout traders, backtest your pullback strategies and manage risk — the next move could define the rest of the month.
BTCUSD trade ideas
BTC ShortBTC’s 1‑hour structure is showing clear signs of weakness following rejection from the premium supply zone between 122 000 and 123 200. After sweeping equal highs and tapping into the 50 % internal retracement level around 119 900, price sold off sharply, breaking below the intraday demand at ~119 000. This shift in market structure signals bearish intent in the short term.
The strong rejection, combined with increased sell-side volume, indicates that the rally was more likely a liquidity grab than true bullish strength. As a result, BTC is now expected to continue lower toward the 117 000 level to clear resting liquidity beneath recent lows. This level aligns with the previous CHOCH (Change of Character) and is a key liquidity pocket.
Once BTC grabs the liquidity below 117 000, we anticipate a potential bullish reaction and reversal, as smart money may use this area to re-accumulate and drive price higher.
However, until that liquidity is collected, the bias remains bearish in the short term. As always, proper risk management is essential—define your invalidation clearly and manage position size responsibly to protect capital in this volatile environment.

BTC & ETH - 8H Important DevelopmentWe have seen a very important development on the 8H chart for both BTC and ETH.
Both assets after seeing a selloff through the day then found some LTF support and ending up printing reversal dojis on the 8H.
Apart from the doji printing both assets are at extremely important levels for the RSI.
ETH is slight above overbought conditions meaning if we can see price start to go back up here the strength should get stronger which could help push price past the $3,100 level and towards that $3,400 level.
BTC is right at the 70 level. Therefore if price and push up here then the strength should follow and show a perfect test of overbought conditions as the support level. But if BTC price fails to maintain the strength, a dip below overbought conditions could send us further down towards the $112,000-$116,000 levels depending on how strength looks at that time. The would also coincide with a perfect retest, but the most important indicator in the short term will see how price reacts to this over the next 8 hours.

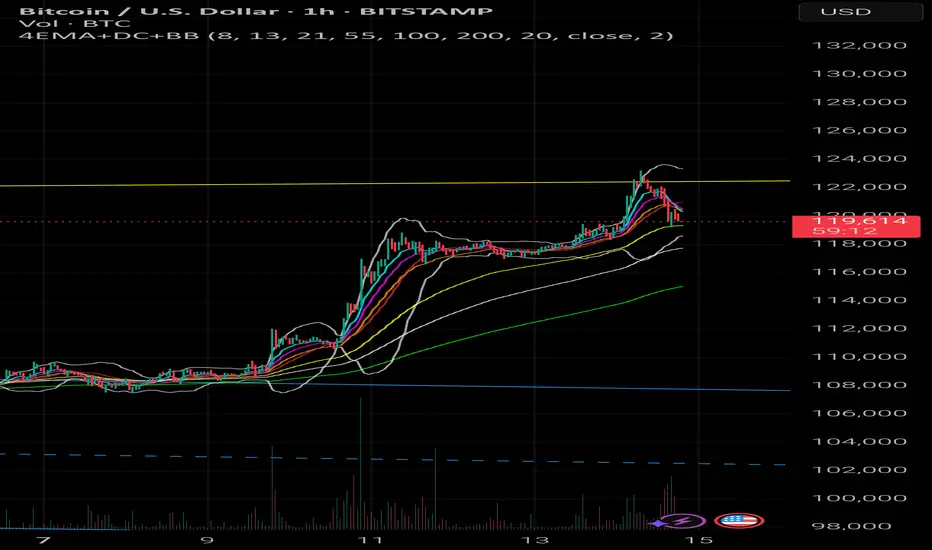
Analysis Btc 120K!Based on momentum and other technicals BITSTAMP:BTCUSD Is having some problems being in a Low volume node needing to through FVG in 15 min, 4 hr time frame. My personal bias is long but we have to break structure.

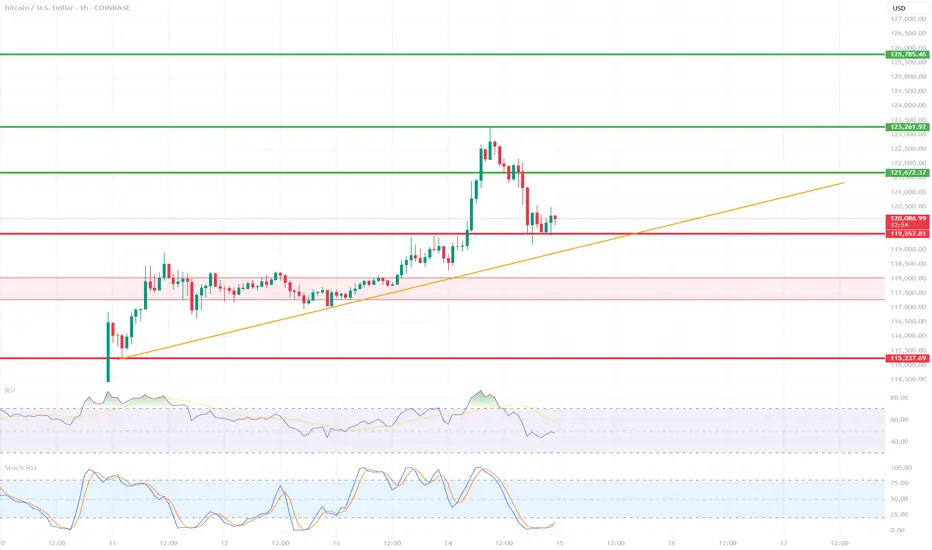
BTC/USD 1H ShortTerm🔍 Trend:
The short-term uptrend remains in effect, supported by the orange trendline.
The price has tested dynamic support but has not yet broken it.
🟥 Supports (Important Levels):
🔻 1. 119.550
Key support.
The price is currently testing it. Holding = potential upside rebound.
Breaking = greater downside risk.
🔻 2. 117.260–118.040 USD
Clear demand zone (reinforced by prior consolidation).
If the price breaks below current support, this is the next logical stopping point.
🔻 3. 115.237–115.500 USD
Strong weekly support – very important in the event of a stronger correction.
Historically, it has responded many times.
🟩 Resistance:
🔼 1. USD 121.673
The nearest local resistance – this could pose a problem for further growth.
🔼 2. USD 123.961
The last local high. Breaking it confirms the continuation of the uptrend.
🔼 3. USD 125.785
The next resistance – a potential target after a breakout to the upside.
📈 Technical Indicators:
RSI (classic):
Still below 50, but starting to reverse slightly upward – neutral with a slight potential for a rebound.
Stochastic RSI:
Gives a long signal – the lines have crossed in the oversold zone and are pointing upward.
📊 Scenarios:
🟢 Bullish:
Maintaining the current support zone (119.5–120k).
Breakout above 121.673 → target: 123.961.
Breakout of 123.961 = trend confirmation and target: 125.8k+
🔴 Bearish:
Break of the trend line and support at 119.550 → possible quick decline to 117.2k–118k.
If this doesn't hold, target: 115.2k
✅ Summary:
Decisive moment – tested trend line + support = rebound or breakout point.
The Stochastic RSI indicates a potential upside breakout, but the RSI needs confirmation.
Careful monitoring of volume and reaction to 120k in the coming hours.
Bitcoin Towards $118KDaily chart,
The Bitcoin BITSTAMP:BTCUSD has just formed a falling wedge pattern, down from the highest High 109356.
Some consolidation may happen in the range 86000 to 82000.
Closing above 86000 for 2 days will give a strong buy signal for a bullish movement, and the target will be 118150 passing through the shown resistance levels.
Consider the Stop Loss below 82000
Note: Always place a near profit protection level, as the BTC is volatile.

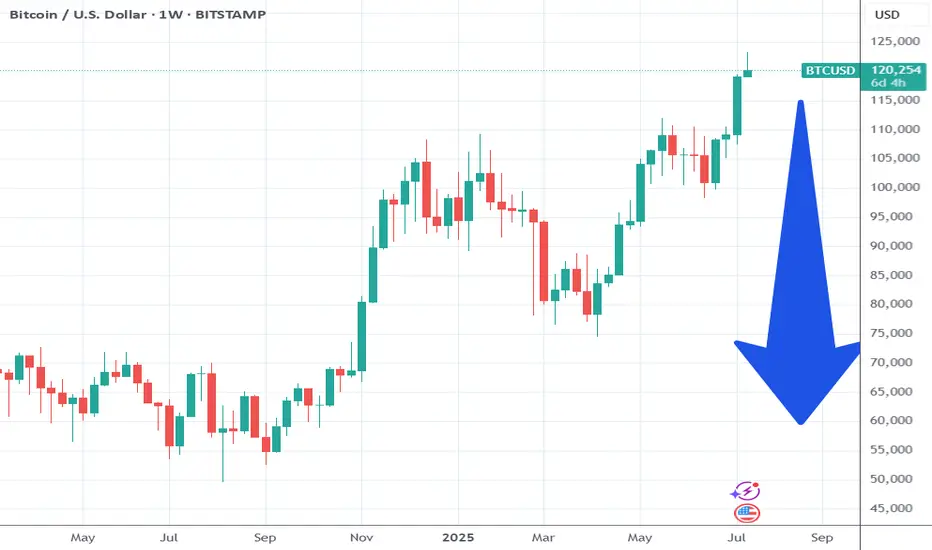
₿itcoin: Pushing Higher—But Watch for a Reversal AheadAfter taking a brief pause over the weekend, Bitcoin resumed its upward momentum early this morning, trading within the blue Target Zone between $117,553 and $130,891. This marks the first time the cryptocurrency giant has traded above the key $120,000 level. Within this zone, and in line with our primary scenario, we continue to anticipate the peak of the corrective wave B rally, followed by a trend reversal to the downside. We expect a significant wave C decline, targeting the lower blue zone between $62,395 and $51,323. As such, prices in the upper blue Target Zone may present an opportunity to take (partial) profits on existing long positions and, where appropriate, to initiate potential short positions as a hedge. These shorts could be protected with a stop 1% above the upper boundary of the zone, given there remains a 35% probability that Bitcoin could break directly above the $130,891 resistance and set a new high as blue wave alt.(i).
📈 Over 190 precise analyses, clear entry points, and defined Target Zones - that's what we do.

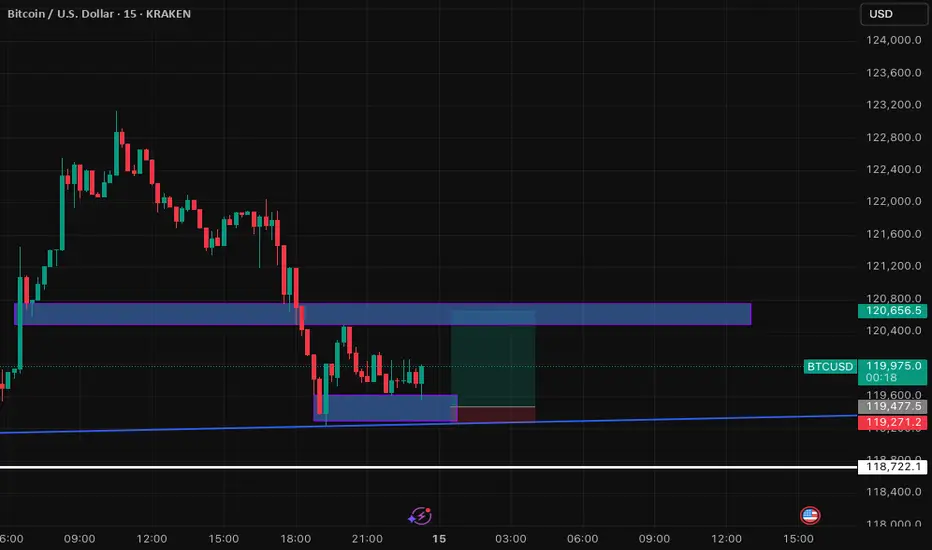
BTC/USD: 15-Min Reversal Attempt at Key Trendline SupportThis 15-minute chart for BTC/USD highlights a potential reversal opportunity following a significant downtrend. Price has found support at a confluence of a rising long-term trendline and a defined demand zone around 119,271 - 119,477.5. The analysis focuses on the current consolidation at this support, looking for bullish candlestick patterns to confirm a move towards retesting the prior breakdown level (now resistance) at 120,500 - 120,700. Key observations include the breakdown from a previous support, the current bounce, and the defined risk-reward setup for a potential long entry."
Bitcoin Pump & Dump.. Something Nobody Is Mentioning.A massive Bitcoin correction is coming. This was the peak imo.
Ask yourself this question.... Why did Bitcoin move now?
Simple answer it is a pump into events in a few months and will dump.
They pumped it and promoted the pump mainstream to get newbs to chase at the high.
Now the important part that nobody else is talking about except me!!!!
Look at Bitcoins chart over 15 years. It either drops or runs flat when the FED cuts rates.
What is coming soon? Multiple Fed cuts and a new FED chief. That is why they pumped it now.
Remember Bitcoin is traded against the dollar. When the dollar is cheap Bitcoin falls. When the dollar is expensive Bitcoin moves.
Form 2017 to 2020 the FEDs left rates unchanged and low... Bitcoin traded in the 7k-13k range for those 3- 4 years...
In October 2021... They dropped it hard from 60k to 16k in 2 years (shakeout). Used the Sam Bankman story as the catalyst.. Investors knew rates were going back up in the near term so they got people out.
What happened in 2022 after Covid to justify this 3 year bull run.... FEDS KEPT RAISING RATES AND KEEPING THEM HIGH and here we are at the end of that cycle.
Expecting this to slowly start dropping at this level, for the next year or 2.
What no one expects will happen with BitcoinAll markets go through expansion phases and correction phases. As hard as it may be to believe, Bitcoin and the entire crypto space will also face their macro correction at some point.
That doesn’t mean it’s going to crash into oblivion or that it’s all a scam — not at all. What I believe is that when that major correction hits, it will open the door to real buying opportunities.
And maybe, in 10 or 15 years, once the bear cycle has fully played out, Bitcoin will be ready to climb to 200k, 400k, 600k — or wherever the next cycle takes us.

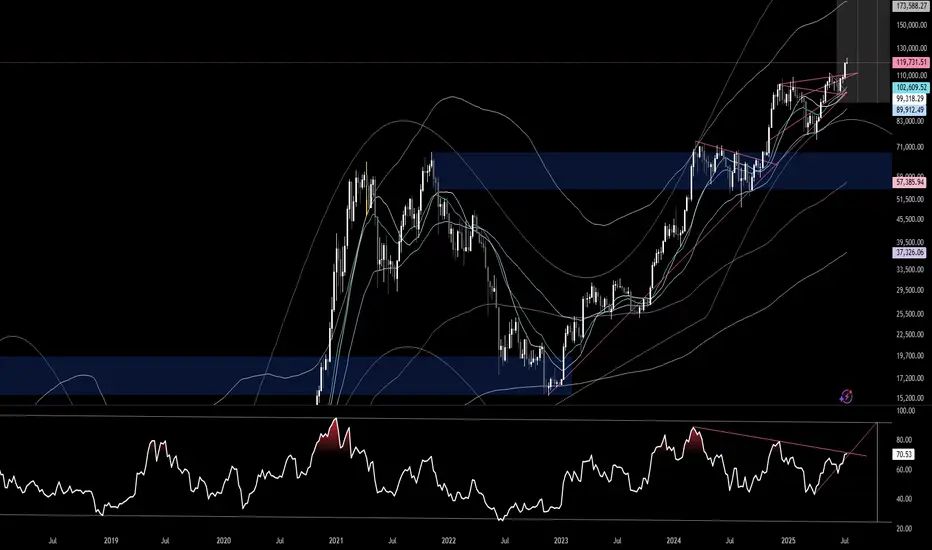
BTC 1W RSIThe BTC 1W RSI is on the verge of breaking above the down sloping trend. Once above it, the sky is the limit. The question is, when will it happen and how high will it go?
Btcusd techinical analysis.This chart is a 1-hour candlestick chart for Bitcoin/US Dollar (BTC/USD) from OKX, analyzed using TradingView. Here's a breakdown of the technical elements:
---
🔍 Key Observations:
1. Current Price
$120,054.6 with a +0.77% gain.
Price appears to be rebounding from recent support.
2. Chart Patterns & Annotations
Yellow Zigzag Lines: Indicate recent price action and a potential bullish reversal pattern forming.
Purple Zones: Likely represent key support and resistance levels.
Pink Downtrend Line: A descending trendline showing the bearish resistance.
Blue Box Area: Suggests a potential price movement range—either up or down.
---
📈 Technical Analysis Insights
✅ Bullish Case (Upside Scenario)
Break above descending trendline could lead BTC to:
Target: ~122,800 - 123,000
Potential

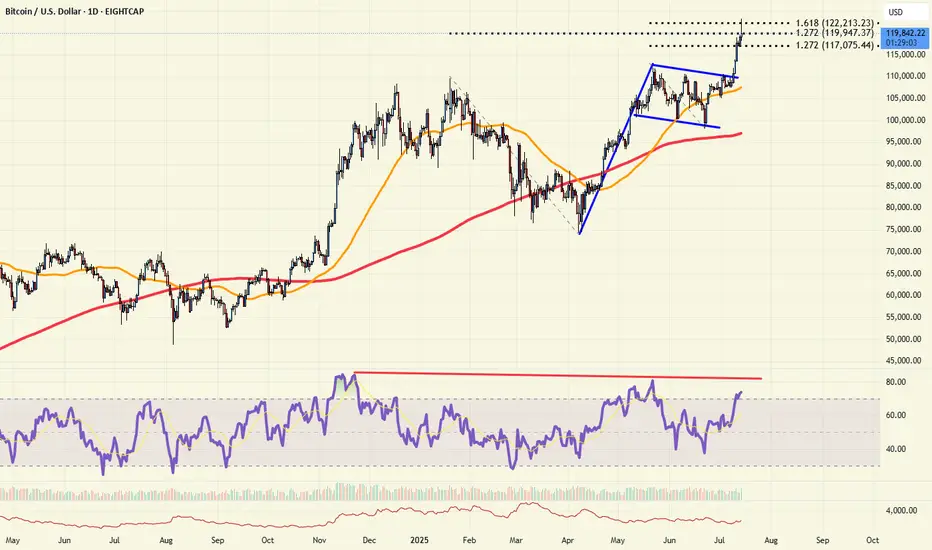
Retail in?After almost 3 decades as a trader, if there is one thing I have learned over the years, significant highs are made when sentiment is at extremes. Whether it is "mom and pop" or the "shoeshine guy" calling the top, it's when the buying (or selling) by retail is at a fever pitch. These days, you can't find a bear in Bitcoin, and the days on end of reports preaching "record inflows" is almost deafening.
Technically, Bitcoin is probing some key resistance today. It's stalled by the 161% Fibonacci extension of the recent early May highs to June lows. More importantly is the 127% extension of the January highs to April lows. RSI is very divergent as price hits new highs. And with sentiment at near extremes, bulls should be careful now. And a break back below the 112k level would be a very bearish "topping pattern" event.
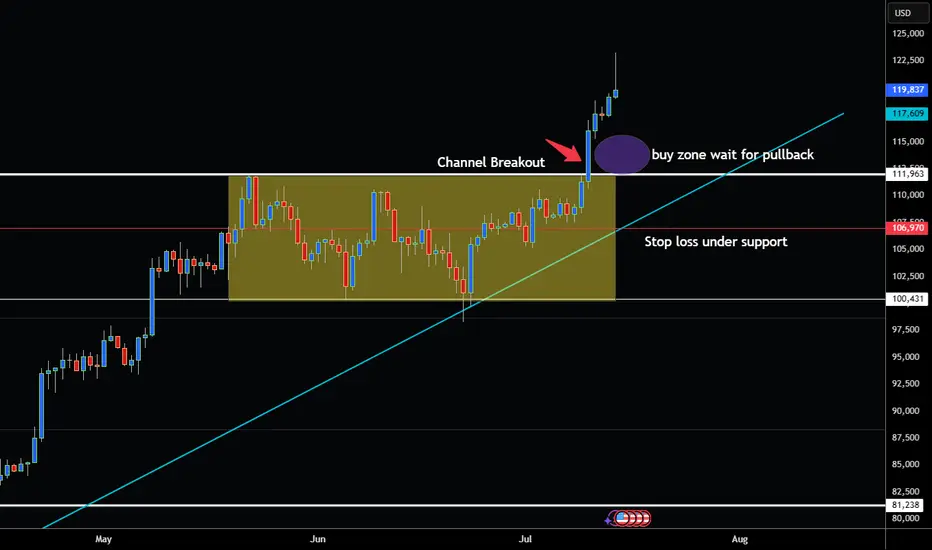
BITCOIN BREAKS OUT OF CHANNEL AND NOW AT ALL TIME HIGHS!Hey Traders wow just a few week ago I was watching to see if it was going to pullback instead smashes above all time high. Thats how quick these markets can change in the blink of an eye!
Lesson here (Always Expect the Unexpected in the Markets!) 😁
Ok so now we have channel breakout above resistance at 112,100. About 70% of the time market will retest this level before continuing the trend.
This could be a great place to buy on the pullback!
So if your bullish buy around $112,100-113,000 I would recommend a wide stop to give the market room to breath around 106,970.
However if bearish I would not consider selling unless market has complete reversal and has daily close below uptrendline at 106,000 .
Bears Be careful because this Bull looks like it has Horns!
Good Luck & Always use Risk Management!
(Just in we are wrong in our analysis most experts recommend never to risk more than 2% of your account equity on any given trade.)
Hope This Helps Your Trading 😃
Clifford

Major Flag Breakout Meets Multi-Year Resistance – What’s Next?After breaking out of the large flag pattern that had been forming on the daily chart, Bitcoin pushed upward with conviction — fueled by a clean 4-hour impulse move. This move carried price directly into a major resistance zone that has held for the past 7–8 years.
I was initially skeptical of a full continuation here, given the historic strength of this zone. But observing how price behaved — especially the smooth structural advance, EMA alignment, and volume absorption — I’ve revised my bias.
We’ve seen liquidity swept from the downside, and price continues to find support in every micro-dip. Given the compression and resilience at these levels, I now expect the market to push further.
Key zone to watch: If we reclaim the midrange after this consolidation, a clean extension beyond the resistance becomes increasingly likely.
Caution: This is not a blind long — entries must be placed with discipline, especially as we test macro resistance.
#BTC #PriceAction #TradingView #CryptoAnalysis #Breakout
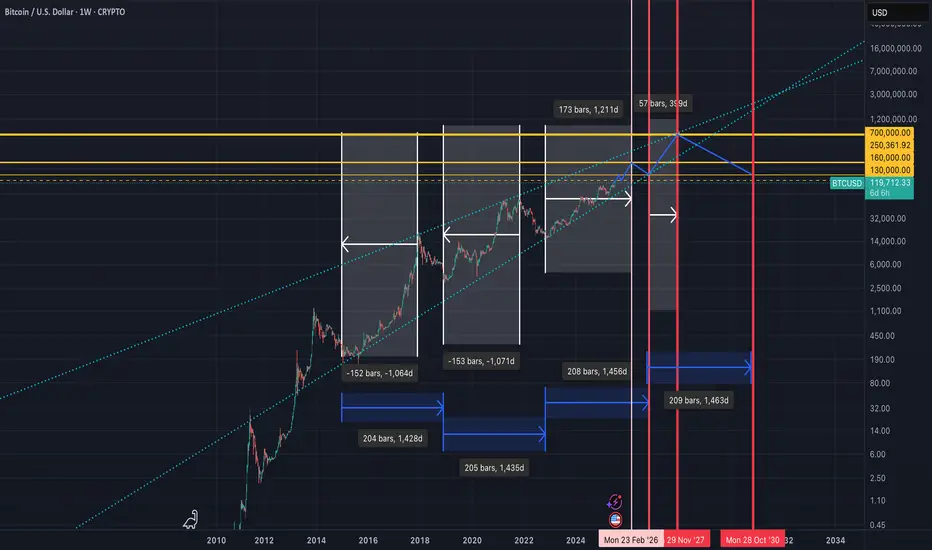
What if Analysis for BitcoinNormal Cycles are dead!! According to extended measurements, elliot waves, fib retracements, trend analysis, cyclic lines and QE timeframes, we might see a different play this time, which will leave everyone sidelined i.e Max Pain. We saw for the first time a Bitcoin bull run while we are in a Quantitative Environment. This means that BTC from now on works as a risk off asset. So, imagine we have a local top on September 2025, where the normal cycle ends around 160k then a quick drop at 130k where everyone thinks the bear market is here and after that quick pump on 250k. Then 9 months bear market (usually 12 months) but now shorter cause we have an extended short term cycle for bull run and after that we hit on 2027 directly 700k USD, where we find the huge bear market which will last longer than usual leading to 100k usd on 2030. The target of 700k usd alligns perfectly with fib levels, trend resistances Larry Fink prediction of BTC going to 700k and lastly and most important due to the published data of FED of wanting to revalue gold to buy 1 million btc in the next years. If we multiply gold's price around 3400k per ounce, multiply USA gold reserves (which is in tons, so we have to convert ounces to tons) and then divide that number with 1,000,000 BTC, guess the price--> yes correctly 700k per BTC!!!!!!!!! Let's go boyz!
BTC price discoveryBroke the 2018 ATH Trendline. I won't day trade BTC, just gives me a feel on alts and crypto stocks.

BTCUSDBTCUSD is currently trading at 120,246, presenting a favorable buy zone near the current price.
The first resistance level lies at 123,352, where price may face initial selling pressure.
The second resistance is stronger at 125,857, indicating a more significant hurdle for upward momentum.
A confirmation of bullish strength will be established if BTCUSD breaks and holds above 126,857.
Traders can consider entering long positions around 120,000–120,300, aligning with the current market level.
To manage risk, a stop-loss should be placed just below the key support at 117,988.

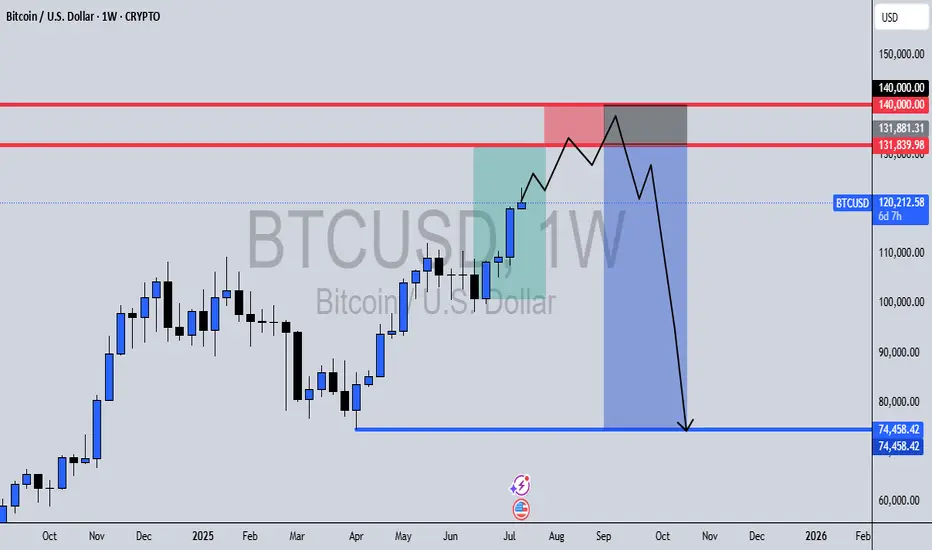
BTCUSD Weekly Outlook📅 Date: July 14, 2025
📍 Timeframe: 1W (Weekly)
🔍 Key Zones:
🔴 $131,839 – $140,000: Major liquidity pool & reversal zone
🔵 $74,458: External range liquidity target
Bitcoin has been pushing higher week after week, but this setup hints at a trap for late bulls.
Here’s what I’m watching:
Reversal Zone Between $131K – $140K
Price is approaching a critical area packed with buy-side liquidity, where I anticipate a liquidity sweep followed by a shift in market structure. This area also aligns with previous highs and psychological resistance.
Liquidity Sweep & Break of Structure
Once price sweeps the highs and takes out weak hands, I expect a bearish breaker block to form as the reversal confirms. This will be the key signal for a move down.
Targeting External Range Liquidity at $74K
The sharp decline afterward is expected to reach the external range liquidity around $74,458, taking out long-term resting liquidity. This aligns with clean inefficiencies and unmitigated imbalances on the chart.
🔔 Conclusion:
While the short-term bias may remain bullish into the red zone, I’m prepping for a high-probability swing short after signs of exhaustion and confirmation at the top. This is a classic smart money play—liquidity grab, breaker, and redistribution.
📌 Set alerts around $131K – $140K and monitor for structure breaks and bearish rejections.
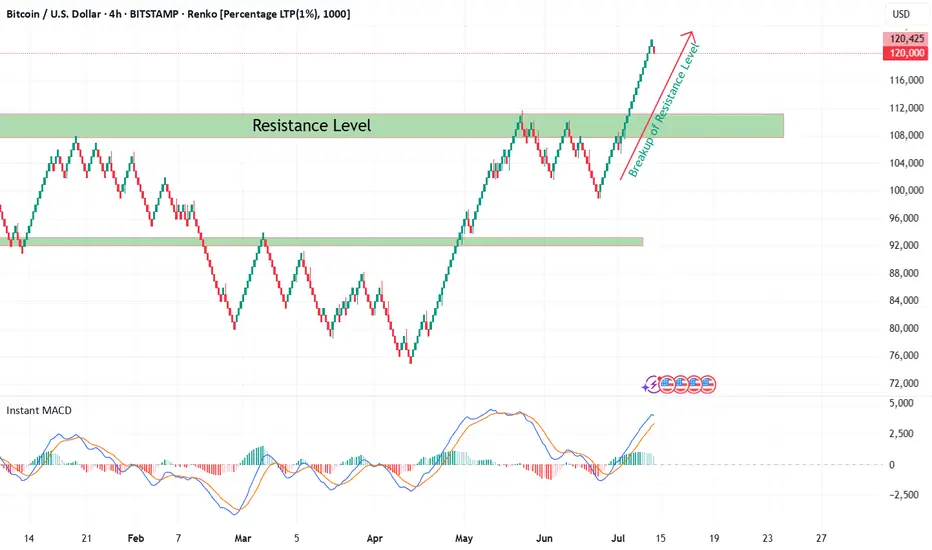
Bitcoin Renko Breakout Confirmation with CryptoQuant NetflowFrom late 2024 till now, Bitcoin (BTC/USD) was consolidating within a broad sideways range between well-defined support and resistance levels on the 4H Renko chart. During this time, market indecision was obvious as neither bulls nor bears could establish dominance.
Recently, BTC has decisively broken out above the major resistance zone at ~$108,000 — as seen with my custom Renko + Decision Tree + S/R Channel script ( ). This breakout above resistance technically suggests the end of range-bound price action and the potential start of a new bullish trend, especially when confirmed by on-chain data.
On-Chain Netflow Confirmation
As I originally highlighted in my CryptoQuant Netflow analysis (published under the username ‘cryptoonchain’ on CryptoQuant platform):
Total Exchange Netflow for Bitcoin has recently dropped to its lowest level since February 16, 2023 — at which point the last bullish cycle began.
Negative Netflow means more BTC is being withdrawn from exchanges than deposited, indicating reduced selling pressure and strong holder conviction.
Binance-specific Netflow also confirms massive outflows, a sign whales and large traders are accumulating and withdrawing funds from trading venues.
Historically, this combination — a technical breakout (Renko) and deep negative on-chain netflow (dataset: CryptoQuant) — has preceded major bull runs.
Summary
Based on both my Renko model and current on-chain flows:
The breakout above 108,000 resistance marks the start of a likely new uptrend for BTC (now 119,000).
On-chain data via CryptoQuant strongly supports the bullish scenario.
Invalidation
If BTC returns below $108,000 and consolidates there, this bullish outlook is invalidated and a reassessment is required.
BTC POTENTIAL PULL BACK ????Will Bitcoin continue going higher or will it crash a bit? Its something we have to wait and see. We have to be ready and prepared for what it wants to do!!!
Here is my technical analysis, but may the Lord lead you as you trade and invest. May you allow Him to show you where to cast your nets!!! (John 21:6 KJV)

symmetrical triangle in progressBitcoin has been consolidating at this level for several weeks, easing some of the pressure in order to push above 120K. As of today, we have a clear formation—a large symmetrical triangle—which confirms the continuation of the upward trend and rules out any possibility of returning to lower levels.
