HelenP. I Bitcoin may correct to support level and continue growHi folks today I'm prepared for you Bitcoin analytics. If we look at the chart, the price has formed a clean upward channel after bouncing from the strong support zone at 103500 - 103000 points. This movement marked the beginning of a new bullish phase. Price continued to rise step by step, confirming the structure with higher highs and higher lows. After reaching above 110000 points, it made a minor pullback but still trades above Support 1 - 108800 points. This zone, 108800 - 108200 points, aligns well with the midline of the channel and may serve as a strong area for buyers to re-enter. The price is currently trading around 110382 points and is still respecting the channel structure. As long as BTCUSD stays above the support zone and inside the ascending channel, I expect a potential continuation toward the upper boundary. My current goal is 114000 points - near the resistance line of this bullish channel. Given the strong trendline support, clean reaction at each correction, and buyer activity on lows, I remain bullish and anticipate further growth. If you like my analytics you may support me with your like/comment ❤️
Disclaimer: As part of ThinkMarkets’ Influencer Program, I am sponsored to share and publish their charts in my analysis.
BTCUSD trade ideas

BITCOIN - Price can drop from resistance area to $103000Hi guys, this is my overview for BTCUSD, feel free to check it and write your feedback in comments👊
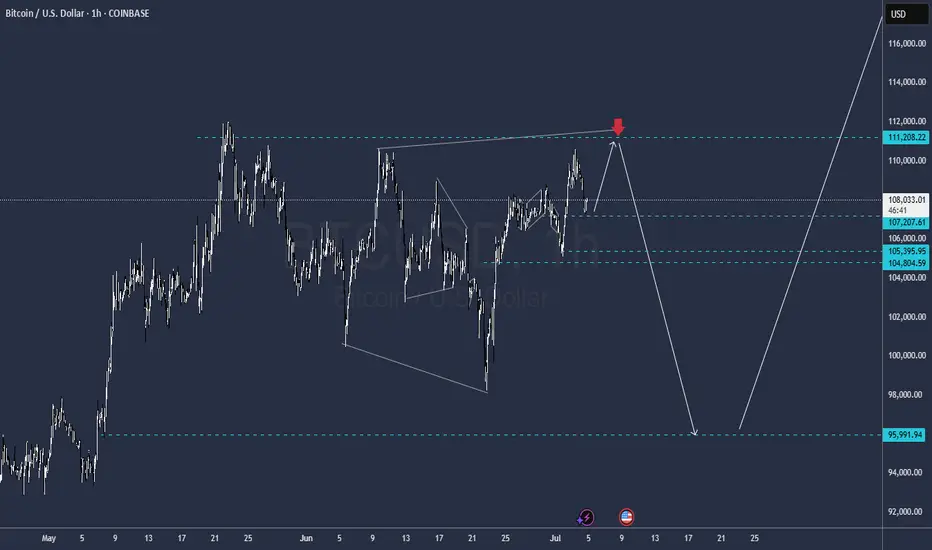
Some days ago, price entered a pennant pattern, where it at once made an upward impulse from support line.
Then the price reached $98700 level and soon broke it, after a small correction, and then continued to move up.
Later BTC rose to the resistance line of the pennant, but soon turned around and started to decline, breaking $110000 level.
Price little corrected and then tried to bounce back and failed, after which it fell to $98700 level and then started to grow.
In a short time, BTC rose to a $110000 resistance level and tried to break it again, but recently turned around and started to fall.
Now, I expect that BTC can grow to the resistance area and then drop to $103000 support line of the pennant.
If this post is useful to you, you can support me with like/boost and advice in comments❤️
Disclaimer: As part of ThinkMarkets’ Influencer Program, I am sponsored to share and publish their charts in my analysis.

Magic awaits for Bitcoin!The breakout from this pattern will likely come within weeks.
I think Q3-Q4 Bitcoin will absolutely blow our minds.
US institutions have been accumulating Bitcoin for almost a year.
They don't buy tops.


Bitcoin the exact scenariobitcoin may need some mre liquidity to fuel back up , so it's better to see this scenario as the most accurate, in order to make some new all time high
Bitcoin(BTC/USD) Daily Chart Analysis For Week of July 4, 2025Technical Analysis and Outlook:
During this week's trading session, Bitcoin rebounded from our Mean Support level of 104900 and, with significant momentum, subsequently completing the Mean Resistance level of 110300. Currently, the cryptocurrency is poised for a continuation of its downward trajectory, with a target set at the Mean Support level of 105500. This downward trend may necessitate heightened resilience to address the Key Resistance point at 111700 and the emerging historical price action of the Outer Coin Rally at 114500 and beyond. Nonetheless, it remains essential to acknowledge the possibility that current prices may experience an uptick from this juncture, bolstering the rally mentioned above.

BTC wait for Long
Bitcoin continues to struggle with its long-term weekly resistance.
In the short term, it’s likely that BTC will consolidate within the $100,000–$112,000 range.
Positioning heavily into altcoins during this phase may not be ideal. It’s more prudent to wait for either a confirmed breakout above weekly resistance or a pullback toward the $94,000–$92,000 support zone.
For now, the focus remains on short-term trading opportunities within this range. A potential long setup is outlined in the chart.
Disclaimer:
This analysis is based on my personnal views and is not a financial advice. Risk is under your control.

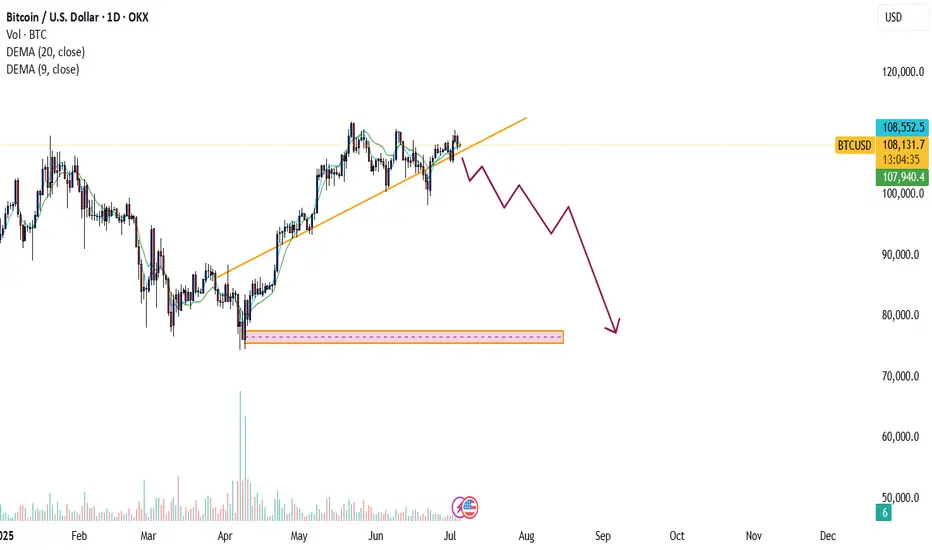
BTCUSD-SELL strategy. Monthly chart It looks a clear negative divergence case, and we are quite overbought. This requires again to alleviate the pressure and I feel $ 74k re-test is possible medium-term.
Short-term anything goes they say, and it feels it will try higher short term. just be careful for the longer-term situation.
Strategy SELL @ $ 108k-115k and take profit first @ $ 77k area.

40 Year Rough EstimateThis chart looks silly, I know. Turn on log to see it a bit better. It sounds absurd, but so does just about any market.
The only thing I can see stopping this is a return to the gold standard. As long as money can be printed for free, it will. Bitcoin can't.
I suspect we'll start seeing the qSAT (quadrillionSAT) shorthand or something, because you can always add more zeroes.

BTCUSD is ranging in narrow zone alighning broad equiti marketBTCUSD is ranging in narrow zone alighning broad equiti market

BTC : Looking at the supplyPrice is stalling at the D @ 108,800 for some time now.
I think it is not because of a lack of demand. Just that there is no one selling. Owners prefer to keep the limited supply. Buyers are unwilling to chase after the few available at a higher price. We have a stalemate.
In 2022, to break this stalemate, price needs to drop, with sellers taking a profit and making supplies available. Then we will have buyers scrambling again to BUY.
Watch the OBV.
So, I should wait to BUY, but at the right price.
Good luck.

BTCUSD – Long Setup (2H Chart)👆👆🚀🚀Boost it if you like it (Thanks)🚀🚀👆👆
Idea:
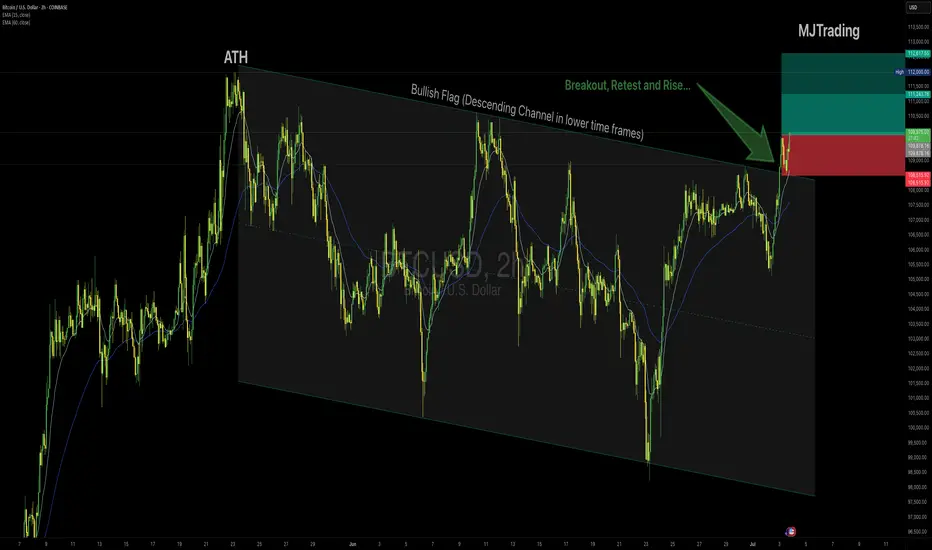
Bitcoin is breaking out above the descending Flag after testing the upper boundary multiple times, showing bullish momentum confirmed by price holding above the 15 EMA and 50 EMA. The breakout aligns with strong impulse candles and sustained buying pressure.
Entry:
✅ Buy near $110,000
Stop Loss:
🔴 Below $108,500, under the breakout structure to protect against a false breakout.
Take Profit:
🟢 Tp1 $111,245
🟢 Tp2 $112,600
Rationale:
Clear breakout of the channel top resistance.
Bullish EMAs crossover with sustained slope.
Strong impulse move suggesting continuation.
Risk Management:
Position size accordingly, max risk 1–2% capital per trade.
#Bitcoin #BTCUSD #CryptoTrading #Breakout #LongSignal #TradingView #TechnicalAnalysis
Btc looks quite bearish from the 15 minutes timeframe- sellPrice is currently forming a bearish continuation pattern and this provides us with a sell opportunity from the lower timeframe perspective. A sell opportunity is envisaged

$BTC is stuck in a box – Big move coming soon! Bitcoin has hit CRYPTOCAP:BTC is stuck in a box – Big move coming soon!
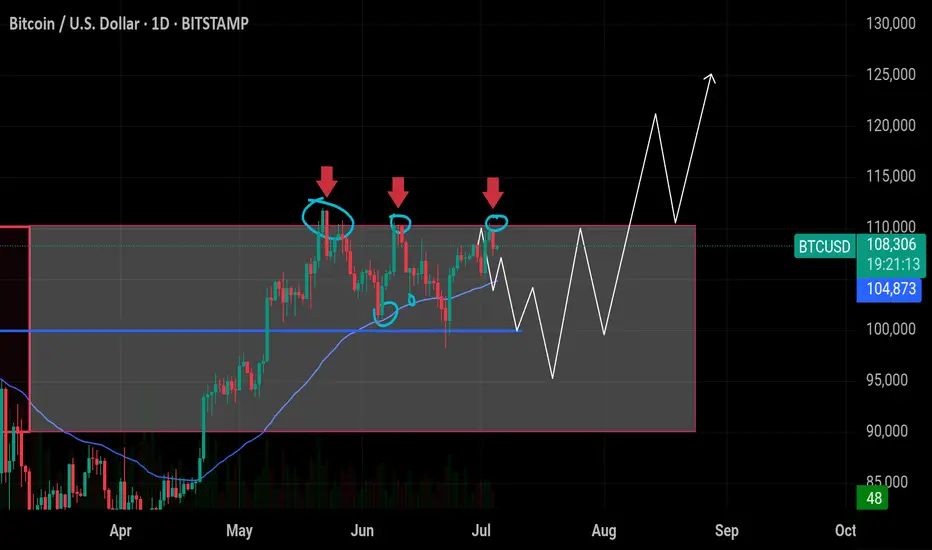
Bitcoin has hit $110K resistance three times and failed. It's moving sideways inside a big box. A breakout is coming – either up or down.
🔸 Support at $104.7k–$100k:
50 EMA is around $104.7K, acting as the first support. Strong support is at $100K. If the price drops here, it’s a good place to buy.
🔸 Targets:
If BTC closes above $110K, we can see a quick move to $115K or even $120K.
🔸 Risk Level at $99k:
If price falls below $99K, the bullish setup is no longer valid. In that case, BTC might go down to $95K or even $90K.
🔸 Outlook:
✅ Watch for a close above $110K to enter a breakout trade.
✅ If price drops, look to buy near $100K–$105K.
Wait for confirmation — the next big move is near!
BTCUSD 7/4/2025Come Tap into the mind of SnipeGoat, as he gives you a Market Breakdown of Bitcoins current Price Action here on Independence Day! It's all about reading the Candles that the market presents, to determine what Price is doing & ultimately going to do.
_SnipeGoat_
_TheeCandleReadingGURU_
#PriceAction #MarketStructure #TechnicalAnalysis #Bearish #Bullish #Bitcoin #Crypto #BTCUSD #Forex #NakedChartReader #ZEROindicators #PreciseLevels #ProperTiming #PerfectDirection #ScalpingTrader #IntradayTrader #DayTrader #SwingTrader #PositionalTrader #HighLevelTrader #MambaMentality #GodMode #UltraInstinct #TheeBibleStrategy

BTCUSDT - single support, short below.#BTCUSDT.. .market placed a very reasonable low tha tia around 107200
Keep close it and short below that only.
Good luck
Trade wisely

BTC CORRECTION MAY NOT BE OVER YET Dear Traders,
Whilst I believe that BTC is still generally bullish, I also think it is important for traders to always pay attention to what price is doing and not what we think price is going to do, and this is simply what we mean by price action in simple terms.
As we can see, the bullish momentum is generally slowing down and we have seen three attempts made by price to swing above the previous high of $112,000 that kept failing. We have also seen two Lower Lows (LLs) on the daily and a Lower High (LH) followed by a Double Top, which is currently seeing price pulling back and can be seen better in lower timeframes which may also be forming and giving us some bearish patterns. This is enough signal and warning for buyers to pay detailed attention to what is going on and look for high probability buy trade set up rather than emotional trading or placing random entries.
I think there are 2 possible good options for buyers, the first is a buy-stop set up above the previous high of $112,000 up to the next psychological levels at $115,000 and $120,000.
The next option would be to buy from the middle of the yet to be mitigated FVG below current price level but we must take cognizance of the order flow below it as price may also tap into it before going up.
Sellers may consider a sell stop to the FVG or wait for confirmation, which is a bodily close below the immediate unmitigated Bullish OB.
The summary of my idea is that, BTC may make another Lower High (LH) and Lower Low (LL) before the next Bullish Run but we just need to pay attention to what price is doing and not get carried away with our emotions.
I remain neutral for now

Are we still in an oscillator?Been over a month in this channel now. Now clear signs of breaking up or down. We are likely headed back to the 30 day SMA, and from there who knows. I tend to like the upside here being above the SMA, but we all know it can crack down and retest the lows yet again. I'm saying we retest the highs first.

Bitcoin is done with 100kLast time it left I said it wasn't returning... Bounce today helped that confirmation

BUY BTCUSD now for a four hour time frame bullish trend continuBUY BTCUSD now for a four hour time frame bullish trend continuation ...............
STOP LOSS: 107,194
This buy trade setup is based on hidden bullish divergence trend continuation trading pattern ...
Always remember, the trend is your friend, so whenever you can get a signal that the trend will continue, then good for you to be part of it
TAKE PROFIT : take profit will be when the trend comes to an end, feel from to send me a direct DM if you have any question about take profit or anything...
Remember to risk only what you are comfortable with... trading with the trend, patient and good risk management is the key to success here

$BTC Long Setup. CRYPTOCAP:BTC Long Setup
Price bounced from the key demand zone.
- Entry: CMP
- SL: $108,517
- TP: $110,030
DYOR, NFA

Bitcoin UPDATEThe sell is @ 111.200
I think it still has to make a new high, sell is not ready just yet
levels highlighted
A clear Understanding of $BTC next move As seen in this chart labeled. are the areas we are looking for interest of BULL breakout or bearish and leading into a alt season. Today JULY 4th. less market activity and small bear trap occured leading into today!
keep an eye out for rally in the near future.
