Bitcoin [BTC1!] Draw and Bias. 05.07.25, SaturdayLooking for bullish action on BTC. No stance on alts.
BTCUSD trade ideas

Bitcoin Wave Analysis – 4 July 2025- Bitcoin reversed from long-term resistance level 110000.00
- Likely to fall to support level 105000.00
Bitcoin cryptocurrency recently reversed down from the major long-term resistance level 110000.00 (which has been steadily reversing the price from the start of this year, as can be seen below) – intersecting with the upper daily Bollinger Band.
The downward reversal from the resistance level 110000.00 stopped the previous medium-term impulse wave (3) from the start of June.
Given the strength of the resistance level 110000.00 and the overbought daily Stochastic, Bitcoin cryptocurrency pair can be expected to fall to the next support level 105000.00 (low of the previous correction (2)).

Btc will test 112 next! With some simple technical analysis I wouldn’t be confident calling in bottom but at this time I’m hedging with a short to take small profits and transfer it into spot for more BTC!! There is a FVG on a daily chart and for now on1H we can see certain resistance. RSI is relatively strong heading to neutral making me believe we may call this bottom for now. Smart money (institutional) has eaten BTC supply and just recently 7 dormant wallets are moving money. Something big may be brewing. Be careful out there.

BTC/USD – Executed Short on Bearish Retest of Resistance PricePrice: 107,950
Position: SHORT
Strategy: Retest Sell into Bearish Continuation
Timeframe: 30m
Status: Trade Active
📊 Analysis Summary:
BTC/USD retested the 107,950–108,100 resistance zone, aligning with the 14 EMA on a clear downtrend. Bearish rejection candles confirmed seller dominance, and I executed a short entry near the top of the retest.
🔽 Plan Ahead:
Towards:105,400
Holding this short unless price breaks back above EMA with bullish strength.
💬 "Sell the bounce. Ride the breakdown. Risk managed, conviction high."
What’s your view? Will BTC hold below 108K or are bulls about to fight back?
#BTCUSD #Bitcoin #CryptoTrading #TechnicalAnalysis #ShortTrade #BearishTrend #EMA #TradingStrategy #SmartMoney #MarketStructure #RiskReward #SwingTrade

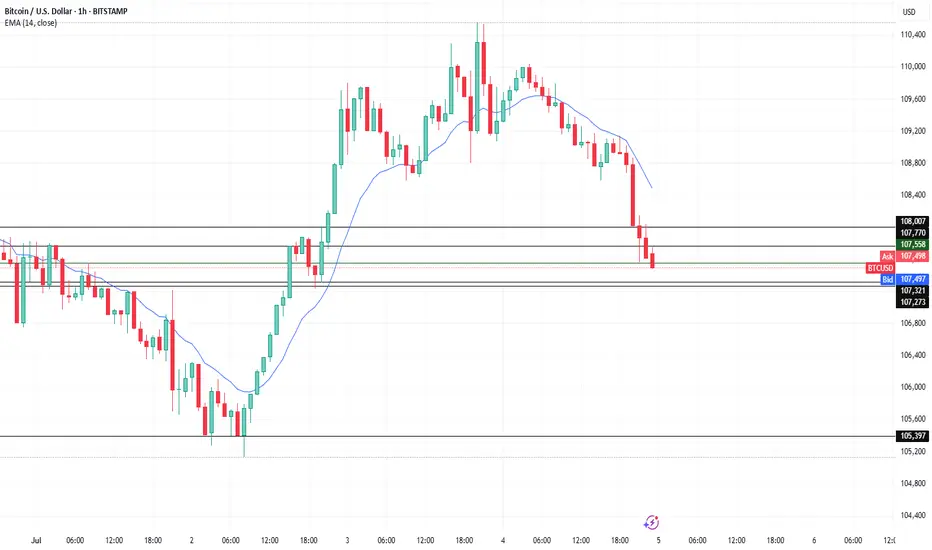
BTC/USD – Intraday Rebound Before Possible Breakdown PairTimeframe: 1H
Exchange: Bitstamp
Bias: Bearish
Posted by: Indonesia1945
Bitcoin is currently holding above the 107,273 support zone after a sharp intraday sell-off. The price has failed to break this key level decisively, which opens the possibility of a short-term rebound before further downside continuation.
Technical Zone Identification:
Immediate Support: 107,273
Resistance to Watch: 107,770 (former support turned resistance)
Major Downside Target: 105,400
Indicator Support:
Price trades below EMA 14, indicating ongoing bearish pressure.
No bullish divergence on RSI, suggesting that any rebound may be corrective rather than trend-reversing.

Btcusd techinical analysis.Btcusd.techinical analysis next move posibale at h1 time frame.not finchinical advice.

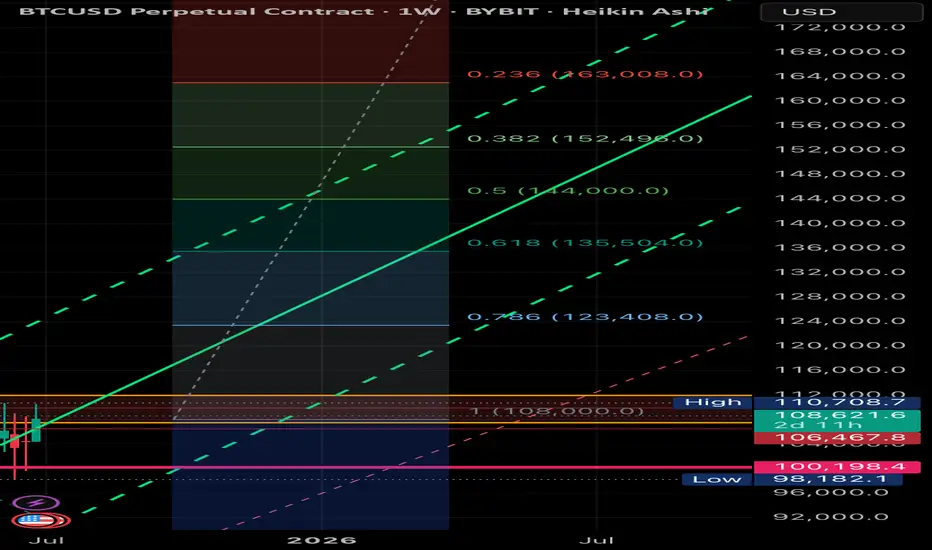
BTCUSD Halving Pic Cycle next top at 140 000 in next 3 MonthsFirst Halving (Nov 28, 2012)
- Price at halving: ~$12.
- Peak price: ~$1,150 (Nov 29, 2013, ~366 days later). Multiple: $1,150 / $12 ≈ 95.83x
- Bottom after peak, before second halving (Jul 9, 2016): ~$185 (Jan 14, 2015, ~413 days after peak).Drop from peak: $1,150 to $185 = -83.9%.
Price relative to halving: $185 / $12 ≈ 15.42x the halving price.
Second Halving (Jul 9, 2016):
- Price at halving: ~$651.
- Peak price: ~$19,700 (Dec 17, 2017, ~526 days later). Multiple: $19,700 / $650 ≈ 30.31x.
- Bottom after peak, before third halving (May 11, 2020): ~$3,122 (Dec 7, 2018, ~355 days after peak).Drop from peak: $19,700 to $3,122 = -84.2%. Price relative to halving: $3,122 / $650 ≈ 4.80x the halving price.
Third Halving (May 11, 2020):
- Price at halving: ~$8,800.
- Peak price: ~$67,549 (Nov 8, 2021, ~546 days later). Multiple: $67,549 / $8,750 ≈ 7.72x.
- Bottom after peak, before fourth halving (Apr 19, 2024): ~$15,479 (Nov 21, 2022, ~378 days after peak). Drop from peak: $67,549 to $15,479 = -77.1%. Price relative to halving: $15,479 / $8,750 ≈ 1.77x the halving price.
Fourth halving (Apr 19, 2024):
- Price $65,000.
- Dipped to $49,577 on May 7, 2024 (18 days post-halving. Estimated multiple: ~2.21x (based on trend analysis).
- Projected peak price August-November 2025: $64,000 × 2.21 ≈ $140,000.
- Drop from peak: $30 000 August–September 2026
at 80% drop from peak and 0.5x of last Halving price
Price Fifth Halving April 2028 $123456

Bitcoin – ATH Sweep or Breakout?Bitcoin is pushing into a critical decision point as it challenges the previous all-time high near 110k. After a strong push out of a rounded bottom formation with clean higher lows, price has now broken above the last visible resistance area and is hovering just under the ATH liquidity. This rally has been aggressive, but the reaction here will determine whether this move becomes an extended breakout or a classic trap.
Liquidity and Key Resistance
The ATH zone around 110k carries a large pool of liquidity, and price is now testing it for the first time since the breakout. We’ve already had a clean break above the prior resistance zone, but we haven’t yet seen a confirmed close above ATH with convincing volume. If price manages to close strongly above this level on the 4H or daily chart, that would be a sign that bulls are in full control. Until then, the possibility of a sweep and rejection remains firmly on the table.
Sweep Scenario and Downside Levels
If we fail to close convincingly above the ATH and instead see a wick through followed by a strong reversal, that would confirm the sweep. In that case, I’d expect short setups to activate quickly, with downside targets sitting around 105k. This level marks the structure support below the most recent breakout, and would be a logical point for price to rebalance before continuing any broader uptrend. A rejection from current levels would also trap late longs and provide fuel for a quick retracement.
Bullish Breakout Scenario
If we do get that proper breakout above 110k, backed by strong volume and continuation candles, the upside opens fast. There’s very little structure above the ATH, so price could move cleanly up into the next round psychological target around 115k. This move would confirm continuation of the higher timeframe trend and offer short-term breakout retests for potential long re-entries.
Volume and Candle Confirmation Are Crucial
At this stage, the setup is binary and all about confirmation. A clean 4H or daily close above ATH with follow-through volume will flip the bias fully bullish. But if we get signs of exhaustion and a failed breakout attempt, the sweep setup becomes highly probable. Waiting for confirmation here is key, rather than trying to front-run the move.
Conclusion
Bitcoin is sitting right at a high-stakes level. We either continue into price discovery toward 115k if momentum follows through, or we see a classic liquidity sweep and rejection back into 105k. The clean structure and recent higher lows support both sides of the argument, but execution will depend on how price reacts around the ATH. Either way, this zone is the key pivot for the next major swing.
Disclosure: I am part of Trade Nation's Influencer program and receive a monthly fee for using their TradingView charts in my analysis.
___________________________________
Thanks for your support!
If you found this idea helpful or learned something new, drop a like 👍 and leave a comment, I’d love to hear your thoughts! 🚀

"BTC - Time to buy again!" (Update)Bitcoin is now at a point where it cannot be ignored! In my view, the bullish wave has started after the corrective wave ended. This wave could continue until it breaks the ascending triangle, then with a slight correction, push the price upward again. The current period and the coming days could be crucial in determining the market's trend.
Best regards CobraVanguard.💚

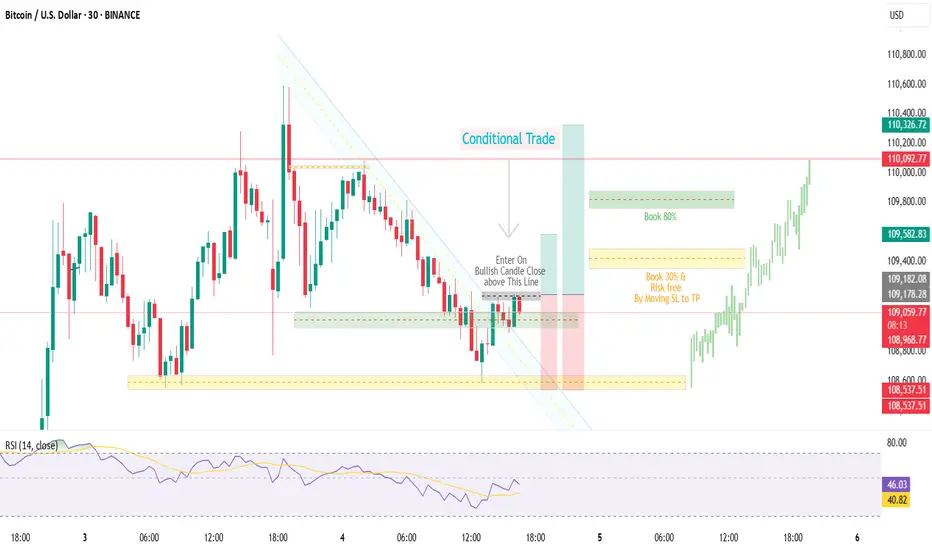
BTCUSDBTCUSD | Quiet Market Play – Conditional | Trade Based On Bearish Candle Closure
After a sharp upward move, price is now losing momentum and consolidating.
Currently entering a short position after breaking the resistance
Trade includes full risk management, marked on chart. 🔴📉

BTCUSD BTCUSD | Quiet Market Play Conditional | Trade Based On Candle Closure
After a sharp impulsive move, price is now in consolidation.
Currently entering a long position after support And trenline confirmation
Trade includes full risk management, marked on chart.🟢📈
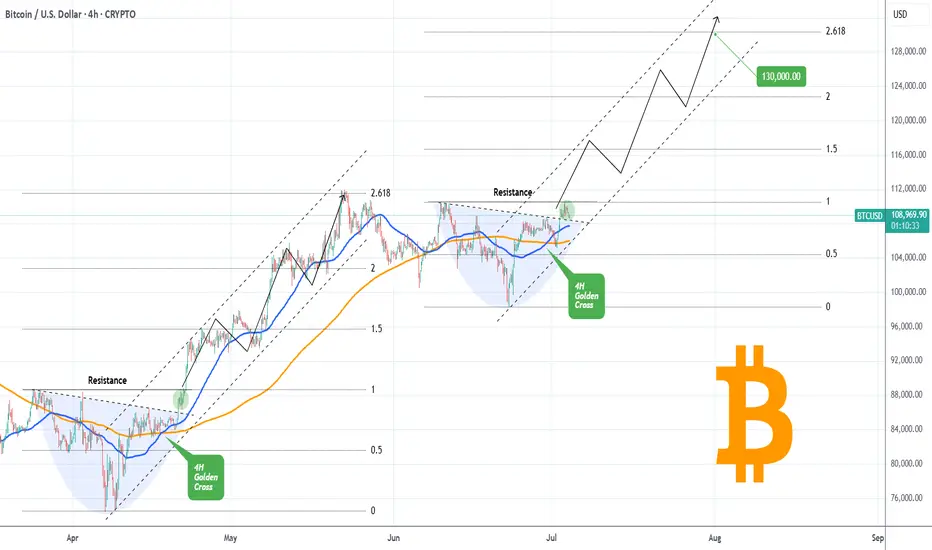
BITCOIN Golden Cross going to slingshot it to $130kBitcoin (BTCUSD) has completed a Golden Cross on the 4H time-frame and is attempting to keep the 4H MA50 (blue trend-line) as Support. If successful, it has high probabilities of staging a Channel Up similar to April - May, which peaked on the 2.618 Fibonacci extension.
So far, the bases of those to fractals are virtually identical, with a Lower Highs trend-line initially acting as a Resistance, which broke and on the current one it is testing the final Resistance (dotted trend-line).
This is the green circle, which on April 21 staged a quick consolidation before breaking aggressively upwards. If the pattern continues to repeat itself, we can get $130k (Fib 2.618 ext) at the end of the Channel Up.
Do you think it will? Feel free to let us know in the comments section below!
-------------------------------------------------------------------------------
** Please LIKE 👍, FOLLOW ✅, SHARE 🙌 and COMMENT ✍ if you enjoy this idea! Also share your ideas and charts in the comments section below! This is best way to keep it relevant, support us, keep the content here free and allow the idea to reach as many people as possible. **
-------------------------------------------------------------------------------
💸💸💸💸💸💸
👇 👇 👇 👇 👇 👇
Market ViewWatch
Trade
Manage
SmileWatch
Trade
Manage
SmileWatch
Trade
Manage
SmileWatch
Trade
Manage
SmileWatch
Trade
Manage
Smile

BTCUSD Daily TF Bull FlagThe daily timeframe bullish flag is a strong indication that the market is preparing for another bull run. The target for this will be around $140k - slightly higher.
I am anticipating a minor pullback to either one of the daily demand zones - (most likely the highest one) before the bulls take over.
