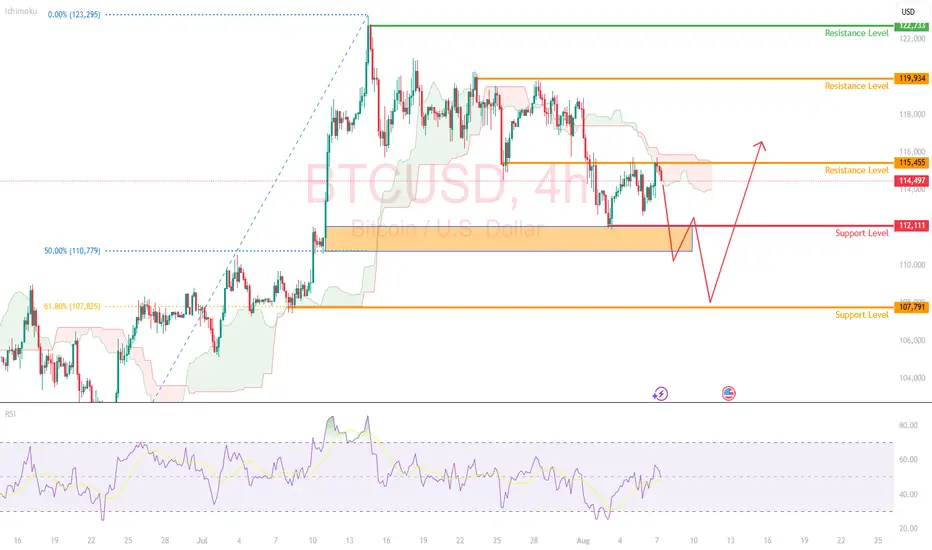
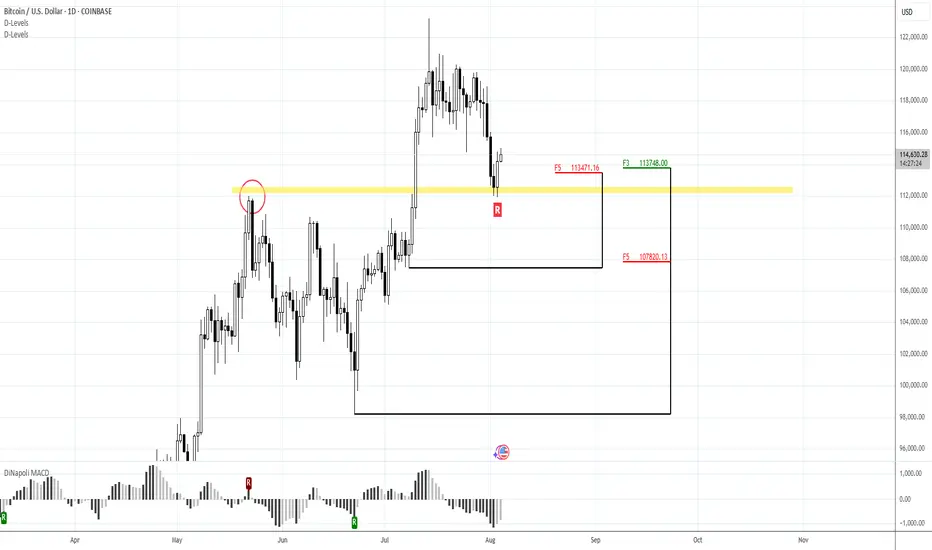
BTCUSD Retrace to ReboundBitcoin is currently trading around $114,500 price level and continues to be held below the $116,000 level.
Price remains in a short-term range between $112,000 and $116,000. But signs are emerging that a breakout may be brewing.
Ichimoku Cloud
BTC is trading into a bearish cloud, which further highlights the possibility of continuation within the range.
RSI
RSI is turning lower from the 60 level, away from the overbought region. This could indicate some downside to come (back into the range).
The Anticipation
Look for a possible break to the downside (below the support level of $112,000 and the 50% retracement level).
Eventually, we could see BTC retest the 108,000 support level before a strong rebound, with possibly a new ATH created.
BTCUSD trade ideas
BTC ON THE EDGEBitcoin topped out at \$123,231 last month and has been pulling back ever since – but not in a chaotic way. The chart tells a familiar story: bearish divergence on the RSI as price made new highs, momentum quietly faded, and eventually the inevitable correction hit. Classic. Now we’ve pulled back into the \$112,000 region, which happens to align with a critical horizontal support zone and the 50-day moving average. This is where bulls need to make a stand.
The good news? The drop came on declining volume, suggesting there’s no real panic here. Sellers aren’t exactly stampeding for the exits. But let’s not pretend buyers have stepped up with any conviction yet either – this is a wait-and-see moment. If \$112K fails, things could accelerate quickly, with downside targets around \$105,787 and \$100,703. That red line lurking around \$97K is the 200-day moving average – the last line of defense before the structure starts to fall apart.
Momentum has reset and the RSI is hanging around the neutral zone. That’s not bullish, but it’s not death either. It just means we’re in purgatory – waiting for the next move. If the uptrend is going to stay intact, we need a higher low right here, right now. Bulls better start buying their own bags.

Do you think I'm joking ???As I said, Bitcoin broke the triangle, and now with a slight price correction(109k), it could surge to $150k , and you still think I'm joking!!
Previous analysis

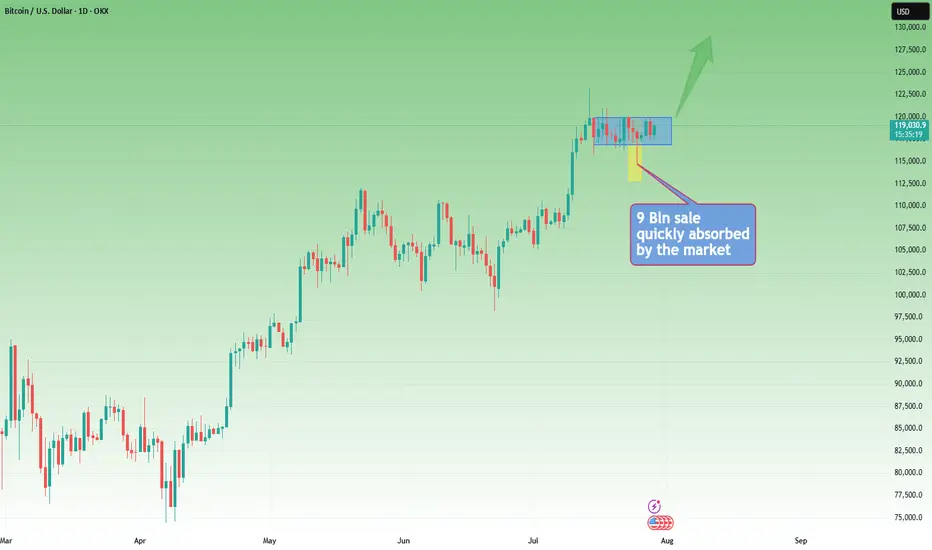
Rectangle Consolidation + Bull Trend = BTC Setup for ATHYesterday, Bitcoin dipped and recovered again, following last week's sharp spike down, triggered by the $9B Galaxy Digital sale on behalf of a Satoshi-era investor.
________________________________________
🧠 Why is this important?
Despite being one of the largest BTC sales in history, the move only caused a temporary spike down.
That’s a clear sign of market strength and strong interest on dips.
________________________________________
📉📈 Current Technical Context:
• If we ignore the spike, price is consolidating in a tight rectangle
• That’s typically a continuation pattern
• The broader trend remains strongly bullish
📌 Put all of that together, and we have at least 3 reasons to expect upside continuation
________________________________________
🎯 Key Levels:
• Break + daily close above $120K → likely leads to a new ATH and a potential test of $130K
• Invalidation only comes with a break below $114K
________________________________________
Conclusion:
BTC just absorbed a massive $9B sell without blinking.
As long as $114K holds, I'm bullish and expecting continuation.
Next leg could (and I hope it will) be explosive. 🚀
BITCOIN Bullish setupBTCUSD bullish setup
Entry - 113090
Stop Loss - 112717
Target - 114260
Risk Reward - 1:3.14

BTC #This 1-hour Bitcoin (BTC/USD) chart showThis 1-hour Bitcoin (BTC/USD) chart shows a clear recovery from recent lows, breaking through a resistance zone around $115,000. The projected red path suggests a bullish continuation toward the $117,000–$119,000 area, supported by a parabolic curve and upward trendlines. However, the price is currently facing resistance near $117,000, as indicated by the minor rejection at the top. Key support lies near $112,000 if the bullish scenario fails.

Bitcoin Tightening@e are currently on the 4th straight daily candle that has either opened or closed at $15,051 - pretty crazy. We all know that Bitcoin is choppy, consolidating at the moment. But this has become a clear level to watch in the short term.

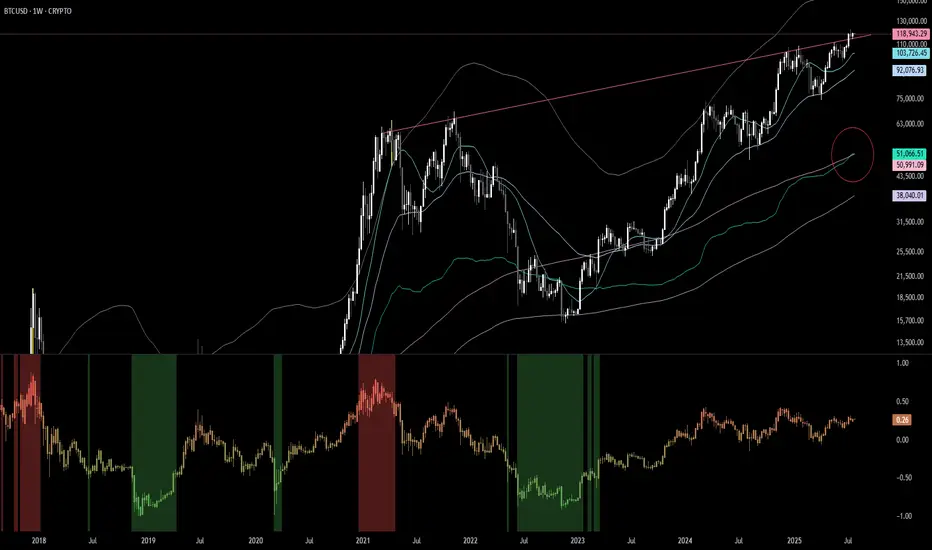
BITCOIN One last rally left in the tank?Bitcoin (BTCUSD) has been on a non-stop rally following the April 07 2025 rebound on its 1W MA50 (blue trend-line). Being inside a 3-year Channel Up since the November 2022 market bottom, that was the second time it rebounded on the 0.236 Channel Fibonacci level.
The previous one was during the last Bullish Leg, which was a +106.37% rise, absolutely symmetrical with the Channel's first such Leg in late 2022 - most of 2023.
If the September 2024 (Higher Low) on the 1W MA50 was the start however of a greater expansion Leg similar to late 2023 - early 2024, which delivered a +197.23% rise, we can claim that by October we may see it peaking at around $155500.
That seems to agree with the majority of Cycle Top models we have come up after many analyses. Do you think that will be the case? Feel free to let us know in the comments section below!
-------------------------------------------------------------------------------
** Please LIKE 👍, FOLLOW ✅, SHARE 🙌 and COMMENT ✍ if you enjoy this idea! Also share your ideas and charts in the comments section below! This is best way to keep it relevant, support us, keep the content here free and allow the idea to reach as many people as possible. **
-------------------------------------------------------------------------------
💸💸💸💸💸💸
👇 👇 👇 👇 👇 👇

BTC-M2 / Cycle End?Do you see what I am seeing? It appears that M2 is significantly dipping at the end of September. I'd bet my BTC that will be the cycle ending. Remain vigilant!
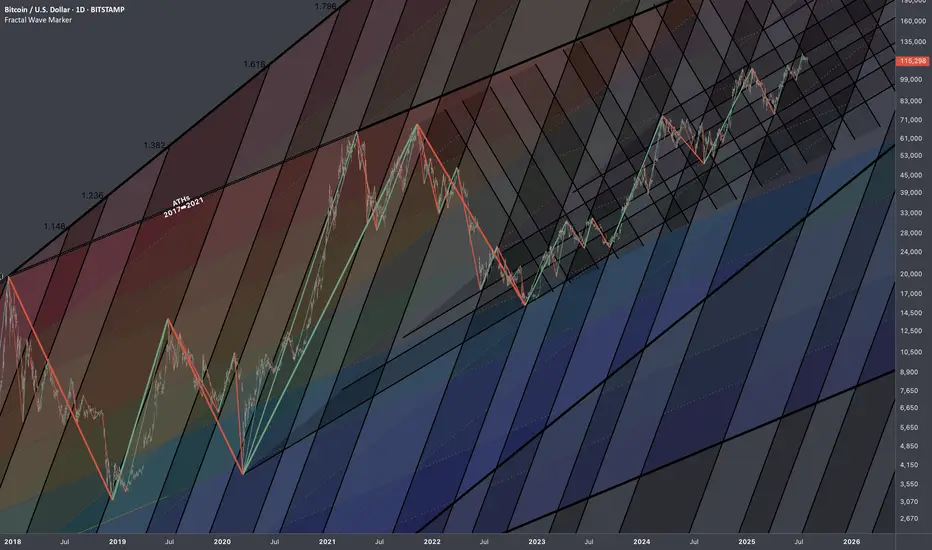
Bitcoin: Interconnections Rewired🏛️ Research Notes
Keeping fib channel of the rising trend angles as they've number of times covered well that aspect of cycle texture.
The other frame of reference would be with fib channel that covers drop from 2021 ATH to late 2022 bottom.
Last bit would be integrating fib channel discovered while ago that connects covid & late 2022 bottoms
Together they create a framework that addresses the complexity and makes even the most chaotic price movements seem to be a part of structural narrative.
Bitcoin - The cycle is just starting!⚔️Bitcoin ( CRYPTO:BTCUSD ) just created new highs:
🔎Analysis summary:
Bitcoin is currently - especially with the new all time high breakout - just perfectly following previous cycle behavior. Since there is no real resistance above current price, apart from psychological levels, I do expect a substantial rally back to the upper channel resistance trendline.
📝Levels to watch:
$300.000
🙏🏻#LONGTERMVISION
Philip - Swing Trader

Realized Price / 200 SMAThe realized price has crossed above the 200 SMA. The last time that this happened was November 2020. BTC then went on a tear in the following 90 days gaining 212%. Even if BTC gains only 50% of that 212% this time we will see the BTC price hit 250k.
We aren't bullish enough.
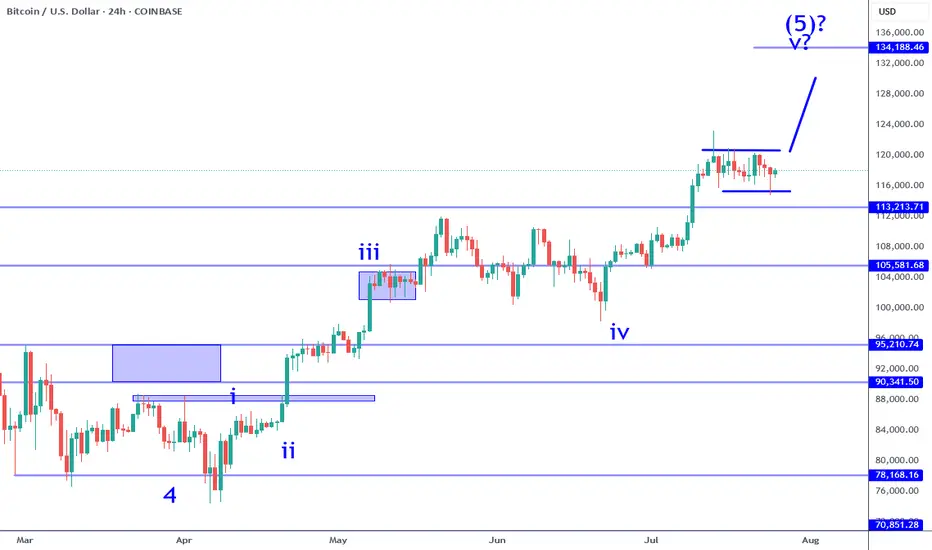
Bitcoin Still Consolidating For Wave 5 RallyBitcoin sub wave 4 consolidation continues to persist. While there was a failed break out over the previous week, it has not changed the bullish impulse at all. The current structure implies that there is a higher probability that one more leg higher (sub wave 5) is likely. It could be the coming week or next, it is all a function of catalyst. Keep in mind this consolidation can test as low at 113K and still be within the criteria of a wave 4. There are numerous opportunities in this situation when it comes to day trade and swing trade longs.
The break out: IF price pushes beyond 120K with conviction (large sustained candle on this time frame) that would be a swing trade long signal. IF there is no instant pullback (fake out), this can be the momentum required to test the 130Ks. Keep in mind, there is an inflection point in the 133K area which serves as a profit objective to measure from. Price can potentially go beyond that point, but participating in that is all about waiting and watching how price behaves. There is NO way to know how this will play out in advance. You have to adjust as new information becomes available.
The retest: if price pulls back into the 116K to 113K area and establishes a reversal on this time frame (or on adjacent time frames like 4H). This can appear in numerous ways: pin bar, engulfing candle, inverse head and shoulders, etc. This scenario would offer greater potential especially if the break out occurred soon after (high probability). IF the 113K level breaks instead, it will put the impulse structure into question. Meaning the probability of a wave 5 to follow will become lower.
This environment in my opinion is not easy to navigate for traders. People who bought into the alt coin weakness months ago are now getting paid and enjoying "alt season", which is great but not good if you are looking to buy something now with a longer time horizon in mind. Wave 5's often signal a corrective move is likely to follow and Bitcoin is potentially completing a very large magnitude Wave 5. I have been pointing this out for months. Most investors will ignore this because they will be biased by greed. The wise this to do is lock in profits along the way at inflection points such as whole numbers, price proportions (like 133K) and/or clear candle reversal signals after significant moves.
Thank you for considering my analysis and perspective.
BTC cares US liquidity risks in AugustMorning folks,
So, in general as you can see our upside AB=CD that we discussed last time is working. But...
as you know BTC is strongly related to liquidity dynamic on US domestic system. This month Mr. Bessent wants to re-finance 1Trln in debt, with net borrowing around 250 Bln. Hardly BTC will get a small chunk of this funds.
it means that the volatility could rise significantly in nearest 1-2 weeks with downside price gravitating. Overall action looks rather heavy. Maybe BTC somehow will complete AB=CD target around 116.20-116.25K, but now this action looks like retracement - no thrust, slow action a lot of overlapping candles. So lows might be re-tested or even broken.
In current situation we think it would be better to not take any new longs and watch for clarity. If you have position already - move stops to breakeven.

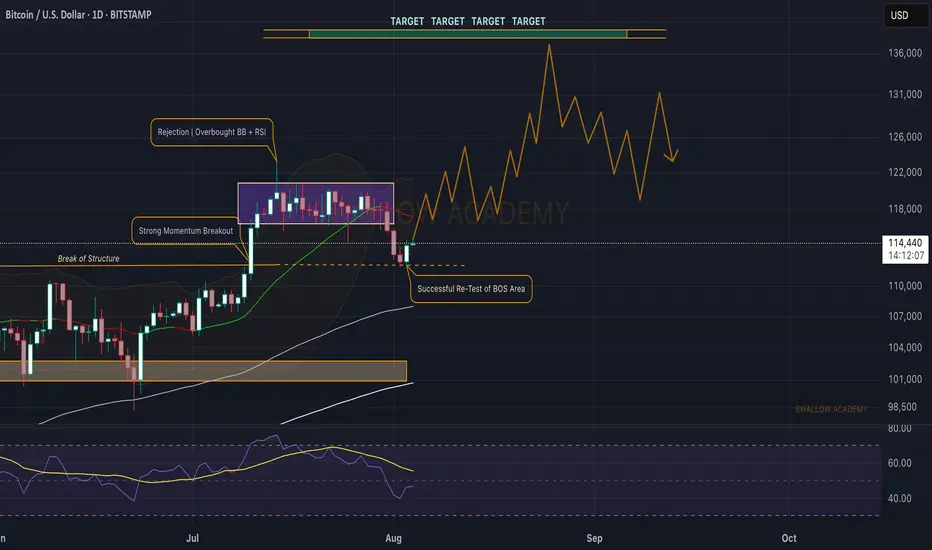
Bitcoin (BTC): Successful Re-Test on Break of Structure AreaBitcoin is showing a good start at the beginning of the week, where we are seeing a successful retest happening, which again might send the price back into the accumulation zone and then the breakout we have been looking for.
So as long as we are above the retest zone of BOS, we are bullish; if we break it, then 101,000-104,000 is going to be our next target!
Swallow Academy
Bitcoin(BTC): History Never Lies | 3-5 Months Before Bear MarketBull Market - Bear Market - Accumulation - Expansion - Reaccumulation: this is the pattern we have been going with since 2012, where currently, after some help from Trump, in combination with the 2024 halving, we had really good upside momentum, which formed the new ATH and led us into the bull run that we have been looking for (by we I mean most traders).
Now, since the last time we shared this kind of analysis on the markets, we have successfully entered the bull market, where currently, based on previous bull runs, we still have around 90-150 days left of further upside movement, which would be a perfect opportunity for altcoins to have their momentum as well.
But bear in mind, each cycle is different, so we have to be ready for anything. What we see is that 2026 should be a bearish year, so be ready for that!
Swallow Academy

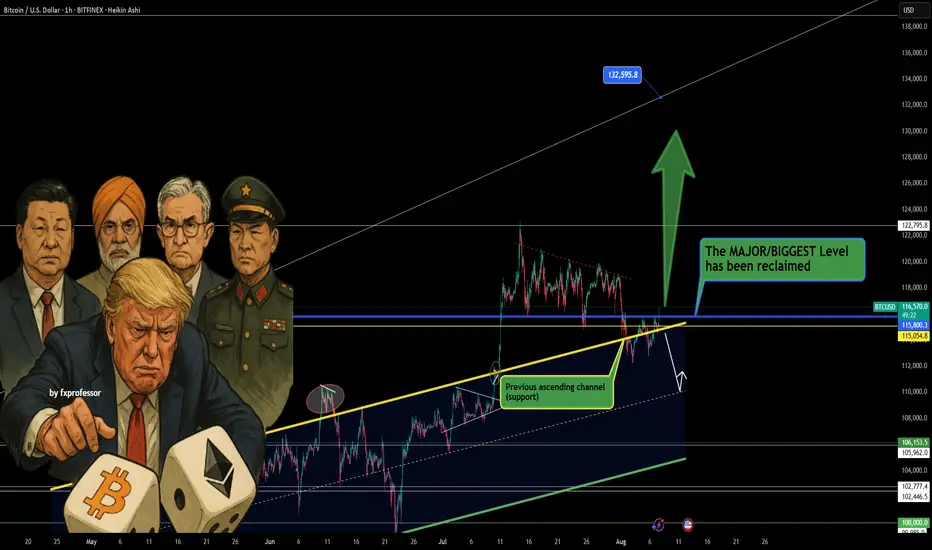
Trump Boosts 401K Crypto Talk, But BTC Levels Lead the Way UP📢💥 Trump Boosts 401K Crypto Talk, But BTC Levels Lead the Way UP 🧠📊
News just dropped that President Trump may sign an executive order allowing crypto into 401(k) retirement plans. 🇺🇸📜 While that’s a massive headline, let’s stay grounded—we play the levels, not the politics. 🧘♂️📉📈
⚠️ A quick disclaimer: It’s Trump, so… let’s see if the ink even hits the paper. But price is king, and the chart already gave us the real signal.
🔄 Bitcoin just reclaimed the single most important level: $115,800. This isn’t just a number—it was the previous ascending channel’s support, and it’s now acting as strong support again. This changes the game.
🟢 As I’ve mentioned in previous ideas, I remain hedged:
✔️ Long BTC
❌ Short S&P 500
That ratio is working out well, as shared earlier today in the post:
“Bitcoin vs S&P 500 – Ratio Signals Strength” — it’s clear which asset the market favors. BTC is holding structure. SPX? Not so much. 📉🔍
🎯 Next upside target: $122,795
🚀 Bigger extension level: $132,595
🛑 Breakdown invalidation: Loss of $115,800 would weaken the case.
News or not, structure always wins. Stay sharp, stay level-headed. The market rewards those who listen to the chart, not the noise. 📡🧠
One Love,
The FX PROFESSOR 💙
Disclosure: I am happy to be part of the Trade Nation's Influencer program and receive a monthly fee for using their TradingView charts in my analysis. Awesome broker, where the trader really comes first! 🌟🤝📈
$BTC DO NOT BE REKT!bitcoin can create an accumulation process in the mini timeframe after the major rally, which will serve as fuel before another parabolic run

Watching for intraday BTC bounce firstMorning folks,
So, neither NFP data nor technical picture helped BTC to stay above 117. While US Treasury is started drain liquidity and borrow (they need 1 Trln this month), sending ~ 150 Bln to its TGA account with the Fed - BTC got hurt.
Now price stands at vital area - previous tops. If BTC will drop under 110K, collapse could start. Let's hope that this will not happen...
Meantime, we're at 112-113K support. We already talked about it before. Here we have reversal bar and bullish engulfing pattern, so maybe we could get a bit higher pullback on intraday chart. 113.8 and 113.1K support areas on 1H TF might be considered for long entry. Invalidation point for this plan is the low of engulfing pattern.
BTCUSD--SHORT---short term SELL possibility
--entry is around green horizantal line
--TP is around black dotted line which is monthly support

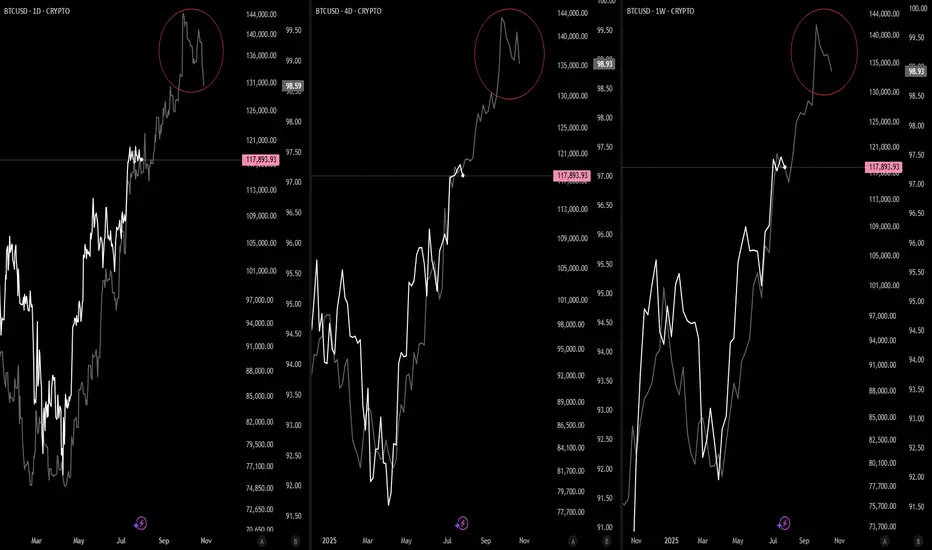
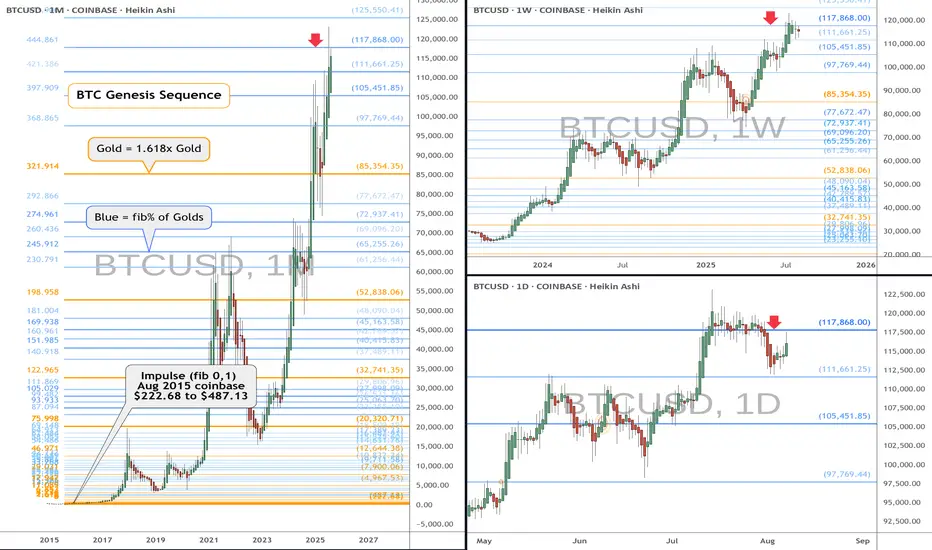
BTC heads up at $117,868 coinbase: Genesis fib trying to TOP it Shown here is a single fib series in 3 different time-frames.
The "Genesis Sequence" has called all major turns since 2015.
Exact reactions at the last few fibs confirm a warning here.
.
See "Related Publications" for previous analysis ------------->>>>>>>>>>
Such as the last post with a "Road Map" that played out PERFECTLY
.
Hit BOOST and FOLLOW for more such PRECISE and TIMELY charts.
=========================================================
.
BTCUSDBTCUSD is getting ready for upside towards 116K-117K.
Disclosure: We are part of Trade Nation's Influencer program and receive a monthly fee for using their TradingView charts in our analysis.

BTC # Bitcoin (BTC/USD) 30-minute chartThis Bitcoin (BTC/USD) 30-minute chart shows a symmetrical triangle pattern forming, with price action compressing between a descending resistance (red trendline) and an ascending support (gray trendline). The price is currently near the apex of the triangle at $118,149, suggesting a potential breakout or breakdown soon. Key support and resistance levels are marked at $115,200 and $120,200 (blue lines). A breakout above the red line could indicate bullish momentum, while a drop below the gray support may signal bearish continuation. Traders should watch for a decisive move outside the triangle for confirmation.
thanking you
