BTCUSD long my predict up to 128100
long possible entry 115150
take profit 128100
stop loss 113000
swing long
BTCUSD trade ideas

BITCOIN BULLYING Bitcoin hit take profit previously and now I will be looking at another buy within this trend and price action combined with patterns

BTCUSD: Long Signal with Entry/SL/TP
BTCUSD
- Classic bullish formation
- Our team expects growth
SUGGESTED TRADE:
Swing Trade
Buy BTCUSD
Entry Level - 11326
Sl - 11231
Tp - 11516
Our Risk - 1%
Start protection of your profits from lower levels
Disclosure: I am part of Trade Nation's Influencer program and receive a monthly fee for using their TradingView charts in my analysis.
❤️ Please, support our work with like & comment! ❤️

Bitcoin at $110,000?After reaching its last ATH, Bitcoin practically went into a coma. Now, with the strengthening of the dollar, it's undergoing a correction — and if that correction deepens, there's a possibility it could drop to \$110,000. We'll have to see whether it finds support around the \$112,000 level or not.

BTC/USD – Strong Buy Opportunity from Demand Zone BTC/USD – Strong Buy Opportunity from Demand Zone
🟢 Technical Outlook:
Bitcoin (BTC/USD) has tapped into a well-defined Demand Zone near 115,000–116,000, showing early signs of a potential bullish reversal. This level aligns with key liquidity zones, smart money concepts, and price inefficiencies — offering high-probability long setups.
🧠 Key Technical Highlights:
🔻 Equal Lows + Sell-Side Liquidity:
Market swept equal lows, grabbing liquidity below support — a common institutional setup before a bullish push.
✅ Break of Structure (BOS):
A prior BOS indicates a shift from bearish to bullish structure after liquidity collection.
📉 Fair Value Gap (FVG):
Price created and respected an FVG after the BOS, validating bullish intent.
📊 Imbalance Filled:
A prior price inefficiency has now been filled, completing a clean move from imbalance back into structure.
📈 Target Zone: 119,000 USD
Marked as the logical next stop — sitting near prior resistance and a liquidity zone.
🎓 Educational Insight:
This is a textbook Smart Money Concept scenario:
Sell-side liquidity sweep
Demand zone tap
Imbalance rebalancing
Shift in market structure
It shows how institutions often engineer liquidity grabs before a large directional move.

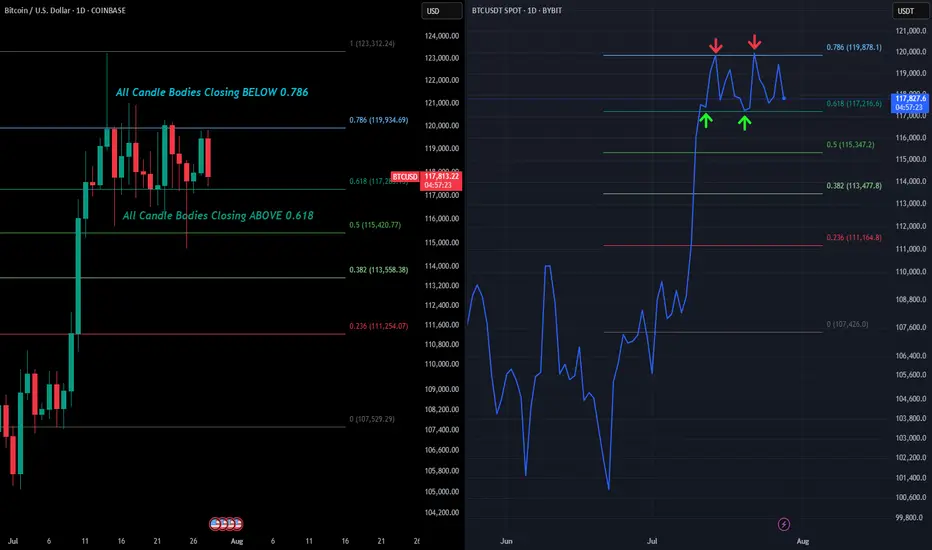
BTC - 1D RangeboundIf you saw our recent post on the warning signs of BTC's weekly chart, we are now going to zoom into the daily and examine how that structure will be decided.
For the last 2 weeks BTC's daily price action has been rangebound between 2 very important levels. The 0.786 (as we have been outline for the past couple weeks) and the 0.618.
So far every rejection (wick high) has happened around the $120.4k level. This is the 1.618 extension target we have had outlined for a while.
And if you look at the actual candle bodies, each has closed below that 0.786 confirming the rejections. The only way to negate this would be to close a daily candle ABOVE the 0.786 which would be over $120k on the Binance chart.
What we have also seen is bulls holding strong support at the 0.618. Everytime we wick below bulls quickly buy it up thus creating our range.
This can clearly be seen by the line chart we have added on the right. The line chart only takes into account candle body closes which shows the perfect bounces between support and resistance.
However if we close a daily candle below the 0.618 $117.2k then that would signal lower price action tests are likely to ensue. Will update this post once we get the confirmation breakout or breakdown from this micro range.
BITCOIN Wait For Breakout!
HI,Traders !
#BITCOIN has formed a Bullish Wedge pattern
While trading in an uptrend As
we mentioned in a previous analysis
So we are bullish biased and
IF we see a bullish breakout
We will be expecting a
Further bullish move up !
Comment and subscribe to help us grow !

Ethereum is Trending HigherSince April trough, Ethereum has risen by 179%, delivering a higher rate of return than Bitcoin at 66%. But most of our attention is on Bitcoin, breaking above the 120,000 level.
Why is Ethereum quietly gaining ground —and what does the future hold for Ethereum?
Mirco Bitcoin Futures and Options
Ticker: MET
Minimum fluctuation:
$0.50 per ether = $0.05 per contract
Disclaimer:
• What presented here is not a recommendation, please consult your licensed broker.
• Our mission is to create lateral thinking skills for every investor and trader, knowing when to take a calculated risk with market uncertainty and a bolder risk when opportunity arises.
CME Real-time Market Data help identify trading set-ups in real-time and express my market views. If you have futures in your trading portfolio, you can check out on CME Group data plans available that suit your trading needs www.tradingview.com

Bitcoin: 130K AREA Upon Triangle Break Out.Bitcoin consolidating in a sub wave 4 and poised to break out (see triangle formation on chart). This breakout would be the sub wave 5 which can take price as high as the 133K to 134K area. In my opinion, this can be the completion of the broadest impulse wave (5th of the 5th). Wave counts aside, this is EXTREMELY important to recognize because it highlights significant price vulnerability and implies very high risk for longs (especially for investors). Of course, these price moves do not play out unless accompanied by a specific catalyst. We have the catalysts in place to drive price higher, but what can lead to a broad corrective structure? Who knows.
There are numerous drivers in play at the moment: the weakening dollar, tariffs, favorable legal environment, etc. And all the talk, videos and other propaganda all point to the continuation of this trend. The broader markets, metals, Ethereum, whatever asset it is, it is continuously going higher with little to no variance. The recipe for total complacency while risk is increasing. Back in April, before the pullback, things looked similar, and then the unexpected reaction to the tariff news at the time. No one saw that coming, and when it came, NO ONE saw or expected that we would be pushing all time highs across EVERYTHING in just a matter of months. When the top is in, the correction will likely be similar or worse. The market is be driven by a declining dollar, not a growing economy.
For the next leg higher into the 130's, what for swing trade or day trade setups. The trend is pretty clear, so it is all a matter of confirming mini pullbacks and continuation or reversal patterns on smaller time frames. Risk can be managed using reference levels on smaller time frames like 4H or 1H for swing trades. The Trade Scanner Pro also provides precise confirmations along with risk and profit objectives. There is plenty of opportunity and ways to play this, without having to get caught as an investor.
The scenario on the chart that illustrates price going to the 130K area assumes a break out occurring this week. IF the market chooses otherwise, like it breaks the low of the triangle instead, then it lowers the probability of the bullish scenario playing out. It's up to the market to choose, all I can do is map out scenarios based on the structure that is in play at the moment.
Either way, it is important to always accept that markets are mostly random. Price action is shaped by the perceptions of the future which can change on a whim. There is no need to feel like you are missing out because when things look their greatest, that is often the worst time to buy and vice versa.
Thank you for considering my analysis and perspective.

BTC highs in, new lows coming soon?~$122.5k was the top of the range. Now we'll need to go test the lows before we can continue higher.
Alts are clearly not confirming a trend change .
Many still bearish on HTFs (including ETH), I think the reason is because Bitcoin goes lower before we see a continued run and that will drag down alts with it. I think people holding alts here with hopes for new highs (in the near future) are about to have their hopes crushed, that also goes for people long crypto miners.
I don't think the real run starts until end of 2025 or 2026.
Time will tell.
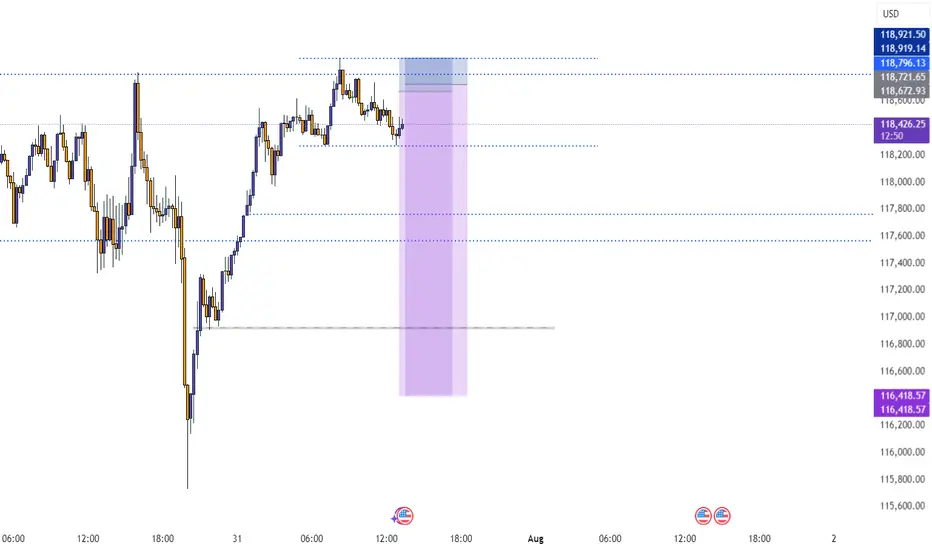
The price re-entered the supply and showed signs of rejectionPrice is reacting from a supply zone marked in grey, suggesting potential short (sell) opportunity.
A clear Change of Character (ChoCH) is visible, indicating a possible shift from bullish to bearish structure.

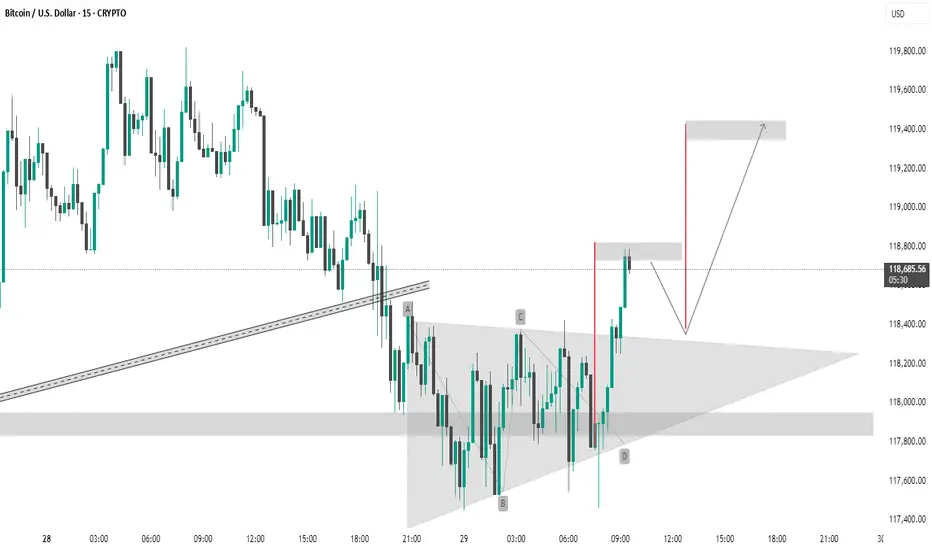
BTC #This Bitcoin (BTC/USD) 15-minute chartThis Bitcoin (BTC/USD) 15-minute chart shows a symmetrical triangle breakout. The pattern labeled A-B-C-D indicates consolidation within the triangle, followed by a bullish breakout. The price has broken above the upper trendline and is approaching the resistance zone around 118,800–119,400 USD. The chart suggests two scenarios:
Immediate breakout to the 119,400 resistance.
Short-term pullback to retest the breakout zone (~118,600), followed by a continuation to 119,400.
The setup implies a bullish bias with a potential upside target around 119,400 USD.
thanking you
BTCUSD The Week Ahead Key Support and Resistance Levels
Resistance Level 1: 119,000
Resistance Level 2: 121,030
Resistance Level 3: 122,862
Support Level 1: 111,683
Support Level 2: 110,450
Support Level 3: 108,720
This communication is for informational purposes only and should not be viewed as any form of recommendation as to a particular course of action or as investment advice. It is not intended as an offer or solicitation for the purchase or sale of any financial instrument or as an official confirmation of any transaction. Opinions, estimates and assumptions expressed herein are made as of the date of this communication and are subject to change without notice. This communication has been prepared based upon information, including market prices, data and other information, believed to be reliable; however, Trade Nation does not warrant its completeness or accuracy. All market prices and market data contained in or attached to this communication are indicative and subject to change without notice.

BTCUSD IdeaWe are waiting for our asset to reach our action zone, and based on the reaction, we’ll decide on our next moves.ALWAYS WAIT FOR A CONFIRMATION TO SEE IF THE PRICE VALIDATES THE ZONE.and you what is your vision of the EURUSD its interests me! i wait you in the commentary

BTC Retrace RoadMap and 3 nearby supports worth watching NOWThis is a near-term followup to my big picture linked below.
Dip is underway after orbiting our Genesis Fib at 117.9k.
Quickly approaching the next three supports worth watching.
Supports get stronger below but each one needs to slow the dip.
$ 115,140 is a minor fib but possible end of dip wave.
$ 113,9xx is a double fib that should be pretty strong
$ 111,661 is the sister Genesis fib, and a MUST HOLD
.
Big Picture chart and why 117.9k was KEY
=======================================================
.

Beyond ICT & SMC: The Mathematical Revolution in Zone TradingIn the world of trading, there's a fundamental divide between traders who rely on subjective interpretation and those who trust mathematical precision. While concepts like ICT (Inner Circle Trader), SMC (Smart Money Concepts), and naked chart analysis have gained popularity, they all share one critical flaw: they're based entirely on personal interpretation.
The Subjectivity Problem
Ask ten ICT traders to mark their Order Blocks, Fair Value Gaps, or Breaker Blocks on the same chart, and you'll get ten different answers. Why? Because these concepts rely on:
Personal bias in identifying "significant" levels
Subjective interpretation of market structure
Discretionary decision-making on what constitutes a valid setup
Emotional influence on analysis
The same issue plagues SMC, CRT (Candle Range Theory), time-based analysis, and naked chart trading. One trader's "liquidity grab" is another trader's "breakout." One person's "strong support" is another's "weak bounce zone."
The Mathematical Solution
This indicator eliminates this guesswork entirely. Instead of relying on subjective interpretation, it:
Calculates exact entry levels using mathematical formulas based on session params
Identifies precise support/resistance zones
Standardises signals across all timeframes, ensuring consistency whether you're on 1m or 15m charts
Removes emotional bias by using algorithmic detection of significant price levels
Numbers Don't Lie
While an ICT trader might debate whether a level is "mitigation" or "inducement," our indicator simply states: "Entry at 1.0847, Stop at 1.0832." No interpretation needed. No second-guessing. Just mathematical precision derived from actual price action.
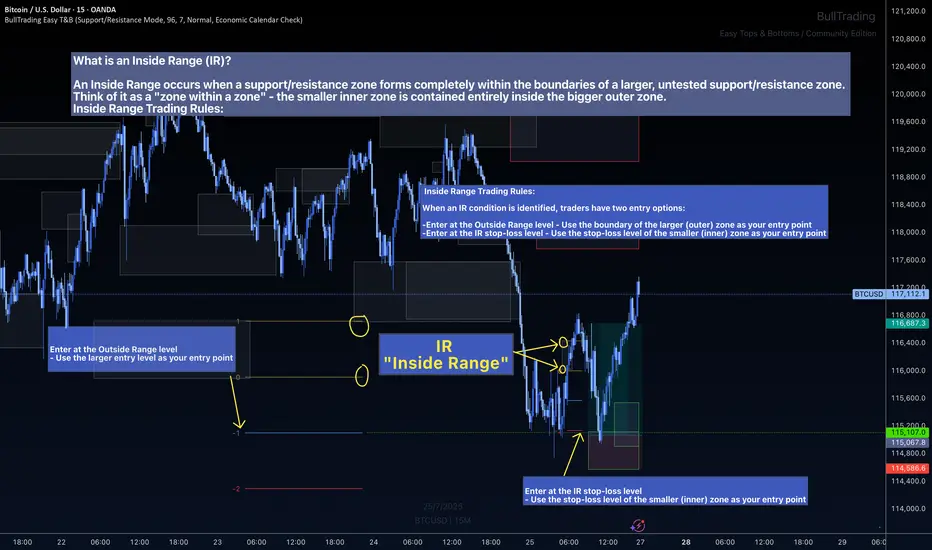
The Inside Range Advantage: When Zones Within Zones Create Superior Trading Opportunities
Most traders miss one of the most powerful setups in technical analysis: the Inside Range (IR). While ICT traders debate "nested order blocks" and SMC followers argue about "refined zones," you can easily identify Inside Ranges with this indicator and mathematically identify these high-probability setups with zero ambiguity.
What Makes Inside Ranges Special?
An Inside Range occurs when a new support/resistance zone forms completely within an untested larger zone. Think of it as the market revealing its hand twice – first showing you the broader area of interest, then pinpointing the precise level within it.
The Mathematical Edge
While discretionary traders struggle to identify these setups consistently, this indicator:
Automatically detects when a smaller zone forms within a larger untested zone
Calculates two precise entry options without any guesswork
Eliminates the confusion of nested levels that plague subjective analysis
Two Entries, Zero Confusion
Documentation and full trading system instructions can be found on the indicator's publication
When an IR forms, the indicator provides exactly two mathematically-derived entry options:
The Outside Range entry – Using the larger zone's entry level
The IR Stop-Loss entry – Converting the inner zone's stop level into an entry point
Compare this to SMC's "refined OB" or ICT's "nested FVG" concepts where traders endlessly debate which level is valid. With Inside Ranges, there's no debate – just two clear, calculated levels.
Inside Ranges represent areas where institutional interest overlaps. The larger zone shows initial interest, while the smaller zone within reveals refined positioning. By mathematically identifying these setups, you're trading where smart money has shown its hand twice.
Real Consistent Precision
Instead of squinting at charts trying to identify subjective "zones within zones," let mathematics do the heavy lifting.
In trading, consistency beats creativity. Stop drawing arbitrary lines and hoping for the best. Start trading with mathematical precision.
Documentation and full trading system instructions can be found on the indicator's publication →
Trade with confidence. Trust in mathematics. Trust in your Edge.
Bitcoin Has Bearish DivergenceOverbought bearish divergence.
I pointed this out last week. In my mind, this is the most reliable signal for tops (bullish divergence for bottoms) that exists in technical analysis. We can see that this continues to play out, and know that it usually leads to RSI making the trip to oversold.
It looks like more correction is likely, standard fare in a bull market.

Btc long term targetsOnce Btc & alt coins bottom, the Btc pump to $130K- $140+ is possible.
I would expect a retrace at that point, which would conveniently
bring Btc down to fill a CME gap at $92K (right within the Fib retracement
ratios I would expect). This is just an idea, but wouldn't it be interesting.
Note: This pattern is a fractal

btc parabolic curvebitcoin parabolic curve pattern exits the base3 accumulation area and continues to rise sharply, with more to come

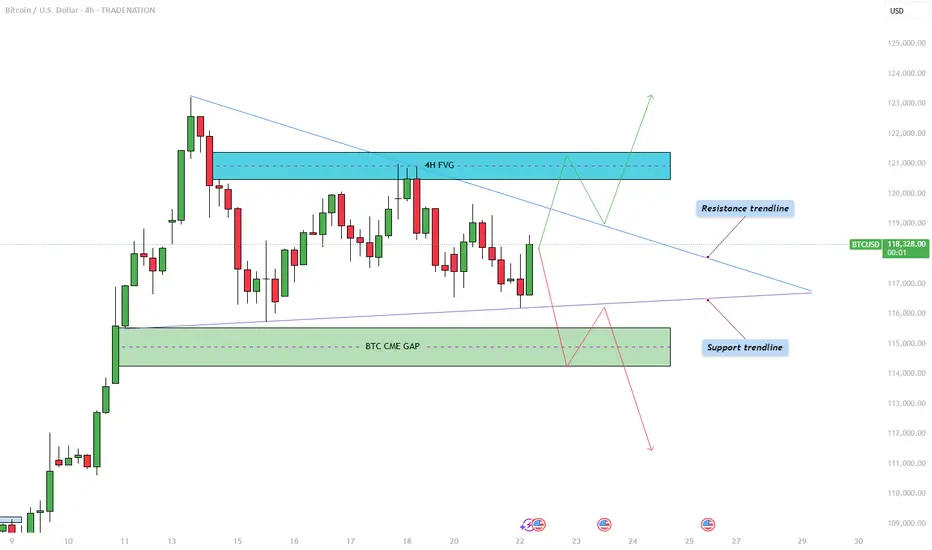
Bitcoin - Triangle pattern consolidation!The Bitcoin price action is currently coiling within a symmetrical triangle pattern on the 4-hour chart, as illustrated in the chart provided. After a significant bullish move earlier this month, BTC has now entered a phase of consolidation, marked by a series of lower highs and higher lows. This has formed a triangle pattern, suggesting an imminent breakout as price nears the apex. The upper boundary of the triangle acts as dynamic resistance, while the rising lower trendline provides firm support. Given the preceding upward momentum leading into this consolidation, the bias slightly favors a breakout to the upside, though the market can always surprise.
Bullish Scenario
In the bullish case, Bitcoin would need to break convincingly above the descending resistance trendline. Should that occur, the next key level to watch lies within the 4-hour bearish Fair Value Gap (FVG) between $120,500 and $121,400. This region represents an area of inefficiency where price moved rapidly in the past, and it is likely to attract selling pressure again. Bulls would ideally aim to reclaim this zone with strong momentum and potentially use it as support in a retest scenario. A successful retest of the triangle’s upper boundary could also trigger a liquidity grab above recent highs, particularly above the all-time high levels.
Bearish Scenario
On the flip side, a bearish breakout would involve BTC breaking below the ascending support trendline. If this happens, the most probable downside target would be the CME gap left behind from two weekends ago, located between $114,300 and $115,500. This price gap occurred due to the discrepancy between Friday’s closing price and Sunday’s opening price on the Chicago Mercantile Exchange, often a magnet for price reversion. After this gap is filled, it is possible that BTC sees a short-term bounce to retest the triangle from below, before potentially continuing lower to address further imbalances in price action.
How to Confirm a Valid Breakout
Trading triangle patterns can be deceptive, as BTC often exhibits false breakouts designed to trap traders on the wrong side. To confirm a valid breakout, it's crucial to observe at least a few 4-hour candles closing decisively above or below the triangle boundaries. Additionally, breakout strength should be accompanied by a noticeable increase in volume. A breakout without volume confirmation is often a sign of a fake move, and entering trades under such conditions can be highly risky.
Final Thoughts
BTC is currently consolidating within this symmetrical triangle formation, signaling a period of indecision and potential volatility ahead. While both bullish and bearish scenarios are plausible, it is essential to wait for clear confirmation before committing to a position. Patience and discipline are key, especially when navigating patterns prone to fake-outs. For now, remaining on the sidelines until a confirmed breakout occurs may be the most prudent strategy.
--------------------------
Disclosure: I am part of Trade Nation's Influencer program and receive a monthly fee for using their TradingView charts in my analysis.
Thanks for your support. If you enjoyed this analysis, make sure to follow me so you don't miss the next one. And if you found it helpful, feel free to drop a like and leave a comment, I’d love to hear your thoughts!
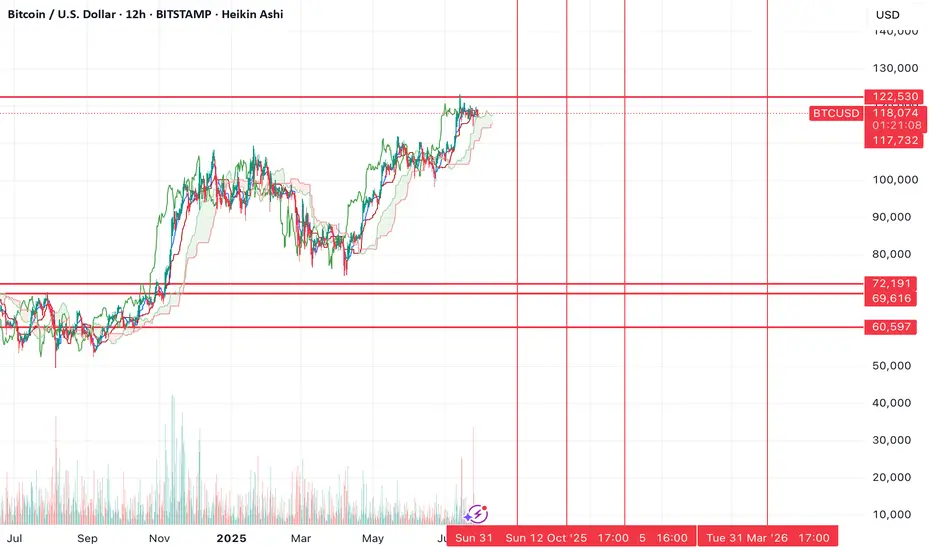
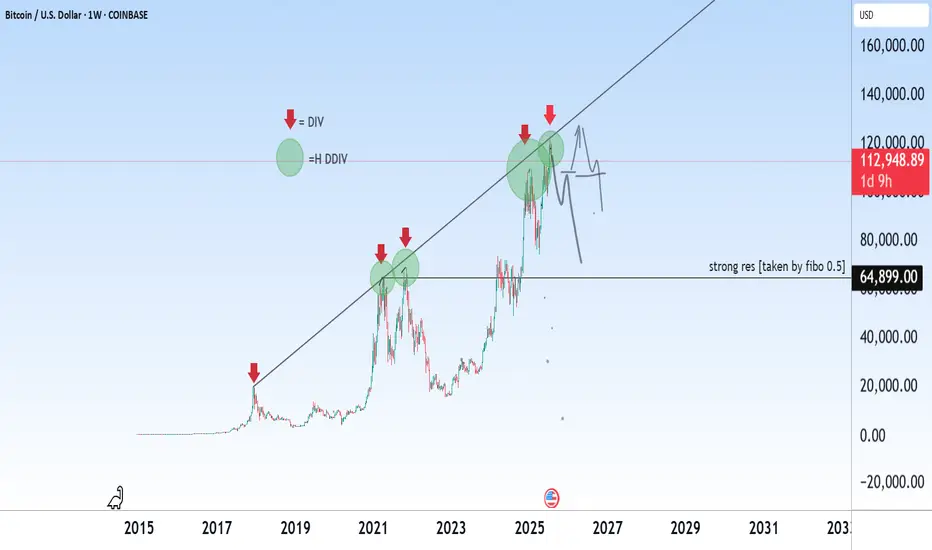
Bitcoin is experiencing a major collapse!BTC/USD – Historical Cycle Analysis & Mid-Term Outlook (1W)
Exchange: Coinbase
Timeframe: Weekly (1W)
Key Observations:
Long-Term Trendline Resistance
The black ascending trendline has historically acted as a major resistance zone since 2017.
Every touch of this line in the past has been followed by a significant correction.
Bearish Divergences (DIV / HDIV)
Red arrows indicate historical bearish divergences on RSI/MACD.
Each divergence marked a local or macro top before a sharp retracement.
Major Historical Resistance – $64,899
Derived from 0.5 Fibonacci retracement of the primary cycle.
Served as a key ceiling during previous cycles before new all-time highs.
Bitcoin Cycle Behavior
BTC historically forms parabolic tops followed by deep corrections.
The current cycle (2024–2025) mirrors 2017 and 2021 structures, suggesting we may be approaching a macro inflection point.
Mid-Term Scenario
Price near the trendline (~$120K) implies high risk of volatility and correction.
Primary support zone: ~$65K (historical + Fibonacci confluence).
Likely scenario: range-bound movement between $65K–$120K before any sustainable breakout or new parabolic leg.
Btcusd techinical analysis.Btcusd techinical analysis next move posibale at h1 time frame not finchinal advice.
