Update on last BTCUSD trade idea.Price successfully broke the pattern and made a significant rally.
Cheers to who followed. Want to be part of my Telly?
Chat me privately on TV’s private chat section
BTCUSD trade ideas


BTC Elliott Wave medium term analysisCRYPTOCAP:BTC is still consolidating, as shown on the charts.
The structure is shaping up like a classic Elliott Wave 1–2–3–4–5 pattern, with the 4th wave now in play.
This could mean another retest of $110,500 before launching into the final, larger 5th wave 🚀.
The 4th wave might present a solid long entry opportunity heading into the 5th.
📊 DYOR – trade safe.

BTCUSD manages to hold the lower border of the – Rebound LikelyBTCUSD manages to hold the lower border of the descending channel, ready to rebound.
BTCUSD broke below 116,000.00 support level on August 1 and declined towards 112,000.00 support level. Afterwards, the asset successfully rebounded from it. Although, we noticed 2 false breakouts of the channel, in general the asset tries hold itself within the descending channel, still showing us the strength of this formation.
Here, the rebound towards 118,000.00 level is expected with intermediate consolidation slightly above the 116,000.00. In the long term, the asset still moves within the descending channel, so no new long-term bullish momentum is expected.

BTC TO TO 130k!!!Price successfully break Above $120000.00 level. This is a validation/confirmation that BTCUSD is gonna trade a new all time high after we had a higher low around the $112,078 Technically, we’d be waiting for a slight retracement for get in a buy. Next buy target is at the 130k psychological level.

BTC Breakout Watch – Red Resistance Being Tested! 🚨 CRYPTOCAP:BTC Breakout Watch – Red Resistance Being Tested! 🔴⏳
CRYPTOCAP:BTC is testing the red resistance zone.
📊 If breakout confirms, next move could target:
🎯 First Target → Green line level
A breakout could trigger bullish continuation and upside momentum.

Bitcoin remain bullish Btcusd remain bullish, with price showing signs of strength.
I am seeing a stable trend with minimal vitality, indicating potential continuation of the uptrend.
Resistance and support level on daily timeframe
Resistance 117,672
Support 115,894
Trade setup
Entry 116,500
Stop loss 115,800
Take profit 117,500

BTCUSD resistance retest at 117,680The BTCUSD remains in a bullish trend, with recent price action showing signs of a corrective pullback within the broader uptrend.
Support Zone: 112,760 – a key level from previous consolidation. Price is currently testing or approaching this level.
A bullish rebound from 112,760 would confirm ongoing upside momentum, with potential targets at:
117,680 – initial resistance
119,760 – psychological and structural level
122,100 – extended resistance on the longer-term chart
Bearish Scenario:
A confirmed break and daily close below 112,760 would weaken the bullish outlook and suggest deeper downside risk toward:
111,070 – minor support
108,800 – stronger support and potential demand zone
Outlook:
Bullish bias remains intact while the BTCUSD holds above 112,760. A sustained break below this level could shift momentum to the downside in the short term.
This communication is for informational purposes only and should not be viewed as any form of recommendation as to a particular course of action or as investment advice. It is not intended as an offer or solicitation for the purchase or sale of any financial instrument or as an official confirmation of any transaction. Opinions, estimates and assumptions expressed herein are made as of the date of this communication and are subject to change without notice. This communication has been prepared based upon information, including market prices, data and other information, believed to be reliable; however, Trade Nation does not warrant its completeness or accuracy. All market prices and market data contained in or attached to this communication are indicative and subject to change without notice.

BTC BULL(2025)-SWING Your BTC/USD daily chart shows a Smart Money Concept (SMC) bullish setup with the following key points:
1. Market Structure
Price had a recent drop but is now retracing back upward.
The chart suggests accumulation and preparation for a bullish push.
There's a clear swing high liquidity above previous highs that price may target.
2. Key Zones
OB (Order Block) in pink:
This is the last bullish candle before a strong move down.
Price is expected to react here — either as a support retest before going higher.
Support (labelled in pink):
Aligned with the OB, acting as a confluence zone for buyers.
FVG (Fair Value Gap) in blue:
This gap represents inefficiency in price.
Price has tapped into it and could use it as a base to move higher.
3. Price Expectation
The red path suggests:
Small consolidation near the support/OB zone until around Tuesday (timing element in your plan).
Then, strong bullish expansion targeting above $122K, and potentially into the $135K range.
4. Liquidity
Liquidity sits above recent highs (marked near $122,021).
Market makers may push price up to take that liquidity before any reversal.
5. Trade Logic
Entry: On retest of the OB/support zone (around $116,000–$115,000).
Stop Loss: Below the OB or the $112,757 level.
Targets:
Short-term: $122,021 (liquidity grab).
Long-term: $135,809.

BTCUSD important support at 112,760The BTCUSD remains in a bullish trend, with recent price action showing signs of a corrective pullback within the broader uptrend.
Support Zone: 112,760 – a key level from previous consolidation. Price is currently testing or approaching this level.
A bullish rebound from 112,760 would confirm ongoing upside momentum, with potential targets at:
117,680 – initial resistance
119,760 – psychological and structural level
122,100 – extended resistance on the longer-term chart
Bearish Scenario:
A confirmed break and daily close below 112,760 would weaken the bullish outlook and suggest deeper downside risk toward:
111,070 – minor support
108,800 – stronger support and potential demand zone
Outlook:
Bullish bias remains intact while the BTCUSD holds above 112,760. A sustained break below this level could shift momentum to the downside in the short term.
This communication is for informational purposes only and should not be viewed as any form of recommendation as to a particular course of action or as investment advice. It is not intended as an offer or solicitation for the purchase or sale of any financial instrument or as an official confirmation of any transaction. Opinions, estimates and assumptions expressed herein are made as of the date of this communication and are subject to change without notice. This communication has been prepared based upon information, including market prices, data and other information, believed to be reliable; however, Trade Nation does not warrant its completeness or accuracy. All market prices and market data contained in or attached to this communication are indicative and subject to change without notice.

Moon Street Cheat Sheet
All same color lines are idendical to eachother ( copies )
3 times since BTC's beginning, they have been pretty accurate with both time and angle ( on log chart )
is 4th time the charm , or was it the 3rd ?
We shall see

BTCUSD – bullish momentum is backBitcoin is making a strong comeback, breaking above short-term resistance and reestablishing its uptrend after a prolonged consolidation phase. The technical structure now shows clear control from the bulls, with higher highs and higher lows beginning to form.
Positive risk sentiment and growing expectations of capital flowing back into the crypto space—especially after a series of weak U.S. economic data—are fueling the current BTCUSD rally. If momentum holds, the next target could be the upper boundary of the price channel.
Keep an eye on how price reacts at key levels and trendlines — this might be the launchpad for the next bullish leg.
Good luck, and if you enjoyed this analysis, don’t forget to hit like and drop a comment!

Bitcoin Pushes On A SundayBitcoin’s daily chart delivered what can only be described as the easiest trade of the bull market – a textbook retest of $112K as support. Price respected the former resistance level perfectly, bouncing cleanly and confirming it as a launchpad for the next leg higher.
The move has been technically sound from start to finish. Price reclaimed and held the 50-day moving average, grinding upward in orderly fashion before Sunday’s strong push through $120K. .
Today’s session is key – after a weekend breakout, follow-through is essential to confirm strength. If bulls can sustain this move and close firmly above $120K, the door opens for a retest of the $123K–$124K range highs. Failure to do so risks another round of consolidation beneath resistance, but for now, the trend remains firmly in the bulls’ favor.

BTC is heading to $130k+After 4 weeks of consolidation and strong liquidity grab from the weekly support BTCUSD started to rise to the upside with a bullish trend continuation showing possible upside bias. As 4h bull flag has broken the support and price started to trend, we may see this instrument reaching to $130k+?
A possible bullish trade is high probable!!

Wait for the BUY BITCOIN ON FIREthis is my newest strategy for bitcoin , the overall sentiment is bullish , we are just ranging and retracing the 112K zone , once its goes back to that levl give it a buy

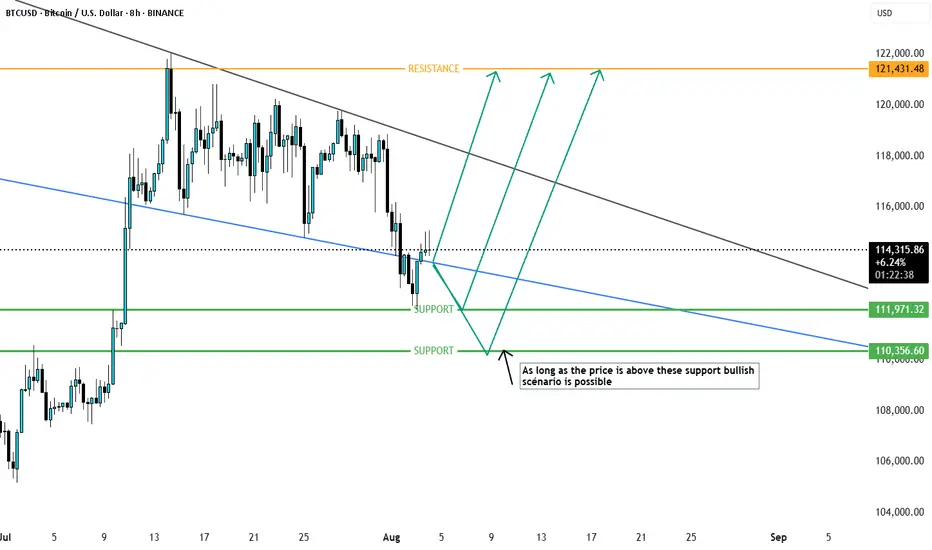
BTCUSD Possible senarioas long as the price is above this suport BTCUSD is bullish and if price drops below these support then short term bearish may be possible. let us see. currently price is rejecting from fib 0.5 of recent swing

BTC #Bitcoin/USD 1H Chart Overview:Bitcoin/USD 1H Chart Overview:
Price Action: Bitcoin is trading within an ascending channel after rebounding from the support zone near $112,400.
Resistance: Price recently rejected from the upper channel boundary and horizontal resistance around $117,600–$118,000.
Support Levels:
Immediate support near the 50% retracement level (~$116,000).
Major support around $115,000 (confluence of previous structure + 50% FIB zone marked “support 50% FIB”).
Reversal Zone: Highlighted around $115,600, suggesting potential bounce if tested again.
Trend Context: Currently a pullback within a broader short-term uptrend, but further rejection at resistance could lead to a deeper retracement.
thanking you

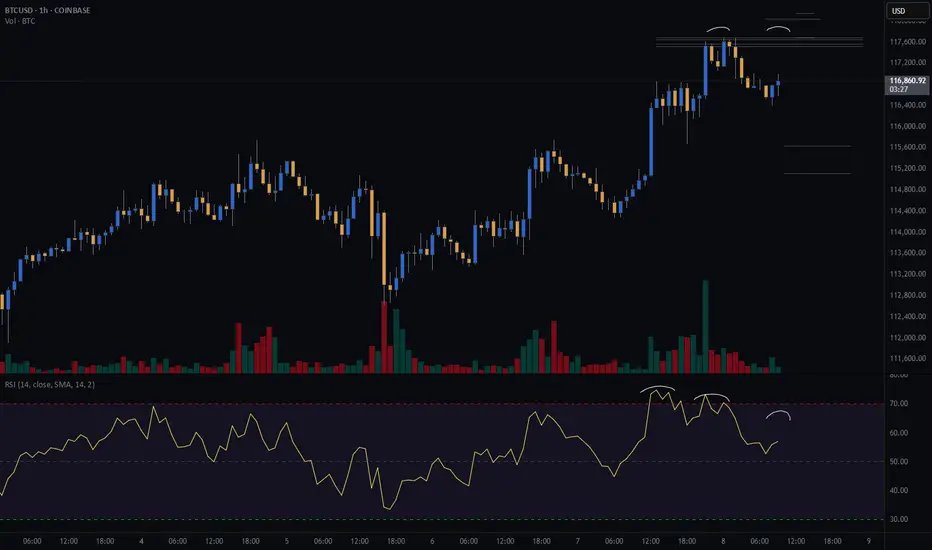
Bitcoin Bears Lining Up? My Short PlanBitcoin is flirting with a potential pullback, and I’ve got my eyes locked on this short setup.
The setup is a double top on the hourly chart.
📊 Risk/Reward: 3.7
🎯 Entry: 117 515
🛑 Stop Loss: 118 033
💰 Take Profit 1 (50%): 115 629
💰 Take Profit 2 (50%): 115 116
Seeing negative rsi divergence on the hourly chart, signaling slowing buying momentum.
I am looking for the hourly candle to close within the range drawn on the chart with lower volume.
I’ll be scaling out at TP1 and letting the second half ride if the bears get their way.
📅 Will today be the start of a deeper drop?
📍 I’m documenting my trades as part of my live trading journey – follow along to see how this one plays out and catch my next setups in real time.
Not financial advice – just my personal analysis.
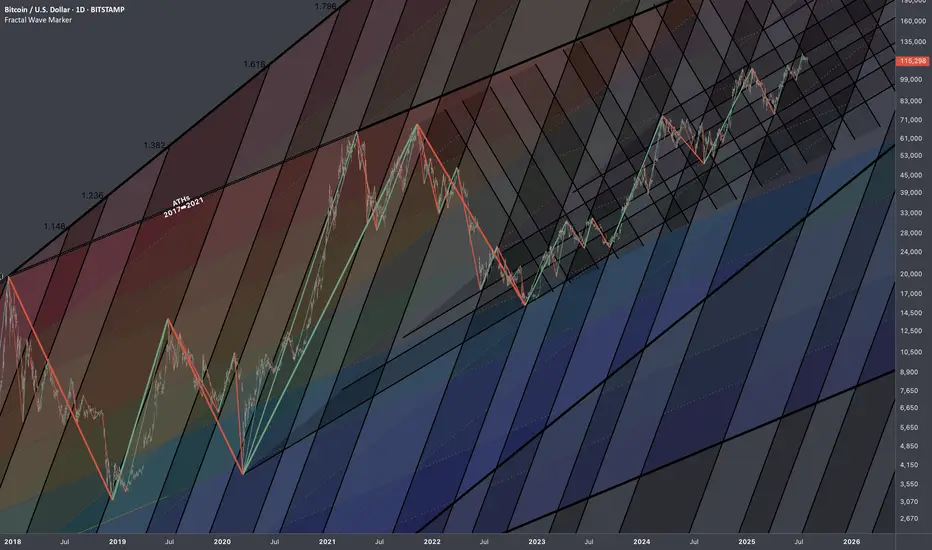
Bitcoin: Interconnections Rewired🏛️ Research Notes
Keeping fib channel of the rising trend angles as they've number of times covered well that aspect of cycle texture.
The other frame of reference would be with fib channel that covers drop from 2021 ATH to late 2022 bottom.
Last bit would be integrating fib channel discovered while ago that connects covid & late 2022 bottoms
Together they create a framework that addresses the complexity and makes even the most chaotic price movements seem to be a part of structural narrative.
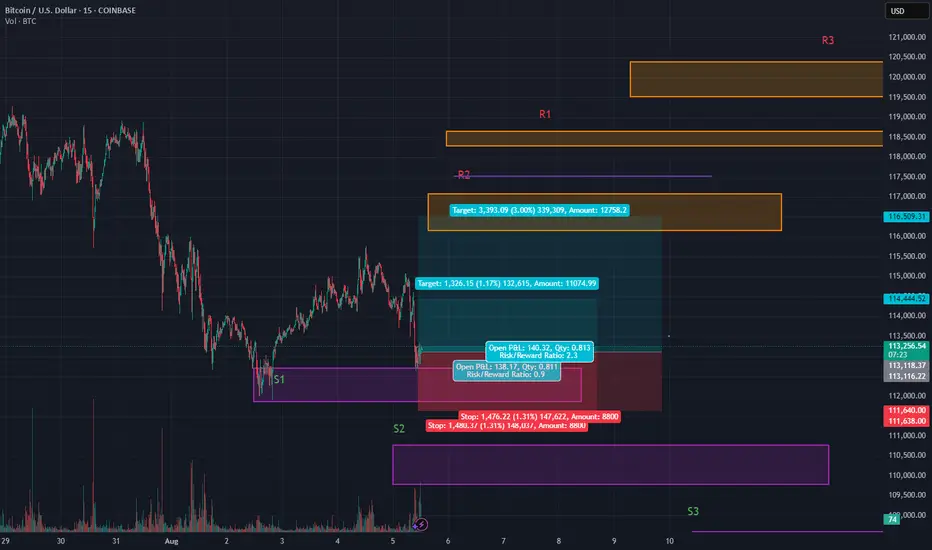
BTC Bleeding, Scalpel Please💣 Price just nuked back to our OG S1 zone and buyers are throwing hands at $113k 🥊
This is a quick scalp play while the dust settles
🎯 Entry: 113,159
🛡 Stop: 113,111 (just below S2's base. you can tighten this up, to the base if desired.)
📈 Scalp Target 1: 114,444
🚀 (Swing Trade) Target 2: 116,588
🧠 Setup: Reclaim after wick trap
📐 Structure: Bullish continuation off demand
📍 Zone: Micro-range base + sweep low trap
Scalpel sharp ✂️
Clean. Tight. Ruthless.
⚠️ Heads up — 30m still trending down
So lock those stops and stay nimble 🔪
⚠️If $113k fails, watch for a flush to S2 or even S3.
This bounce is a scalp — not a trend shift (yet) 🚨
BTC/USD – Double Scenario PlayPrice is now testing the Day High supply zone (117,644). Two possible plays from here:
1️⃣ Bullish Continuation – Clean breakout above 117,644 could fuel a rally straight into the 118,800 OB.
2️⃣ Deeper Retracement – Rejection at supply could send price back into the 116,660 OB Buy Zone for liquidity grab before a major push up.
Key Levels:
Resistance: 117,644 / 118,800 OB
Support (Buy Zone): 116,660 – 116,400 OB/POI
Bias: Bullish as long as 115,907 (Day Low) holds
📌 Plan your entries based on reaction at the supply zone — breakout or rejection will set the tone for the next big move.

Potential Roadmap for BTC/USD In the next 30-40 daysVolatility incoming. It seems like BTC/USD is heading down to sweep some liquidity range at around 107-110,000.
However, market will recover after that, we are still in the "buy the dip" scenario.
End of August, I can personally still bet that BTC will sit higher than the current level
