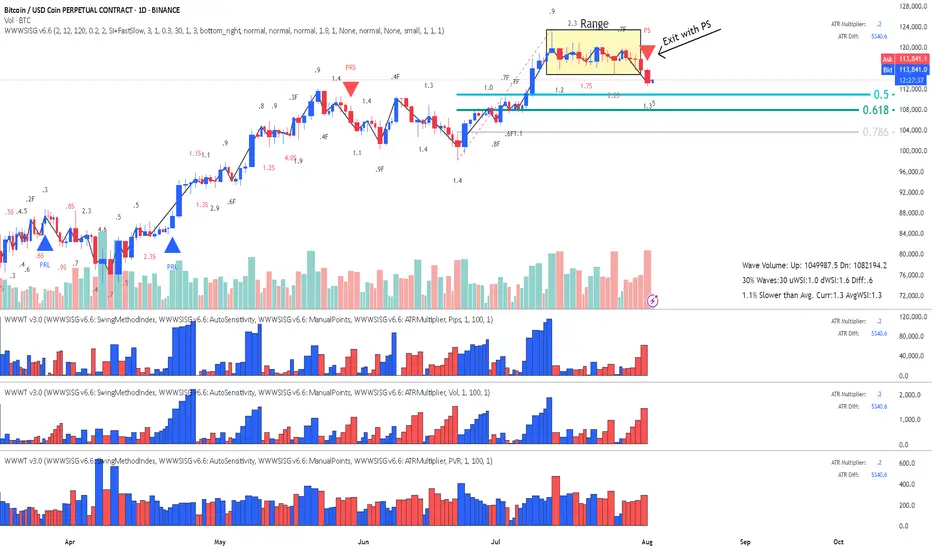
BitCoin - Is it heading for the Fib?This is a classic Entry Short for Weis Wave with Speed Index owners called " Exit from Range with a Plutus Signal" and in this case it was a PS. It looks that it's heading for the Fib, I will wait for some pullback on 1HR to confirm with Speed Index and the waves, as well as getting a better RR.
I
BTCUSDC trade ideas
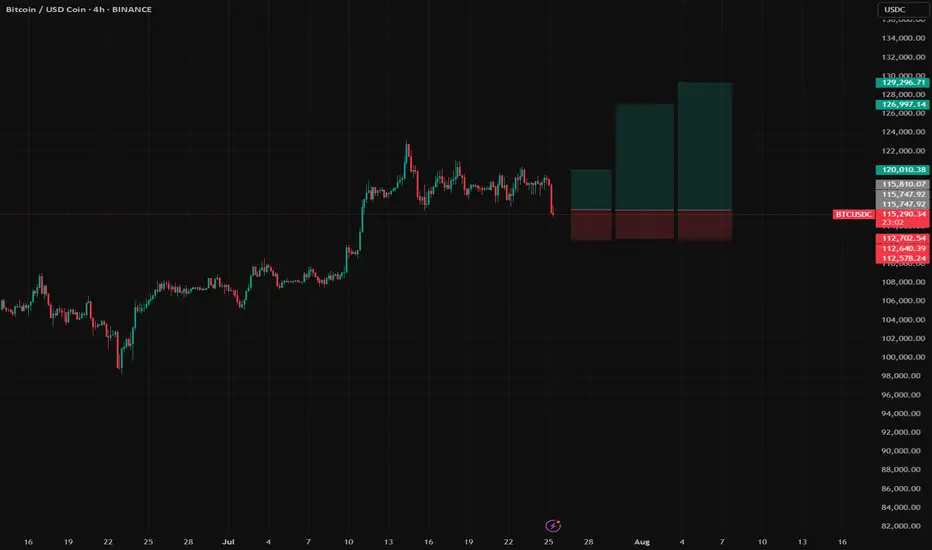
BTC Long Setup | Multi-target Swing Trade with Reasonable SL📝 Description:
Buy Bitcoin (BTC) based on continuation correction structure.
Entry: 115,800
Stop-Loss: 112,600
Risk: 1% per trade (position size adjusted accordingly, no leverage used trade spot only!)
🎯 Take-Profit Levels:
*Watch for a strong red candle at each TP zone.
If it happen, take full profit.
If not, let the position run and watch it again at the next target.
TP1: 120,000
TP2: 126,990
TP3: 129,296
RRR (Risk-Reward Ratio) across targets:
• TP1 = 1:1.3
• TP2 = 1:3.69
• TP3 = 1:4.36
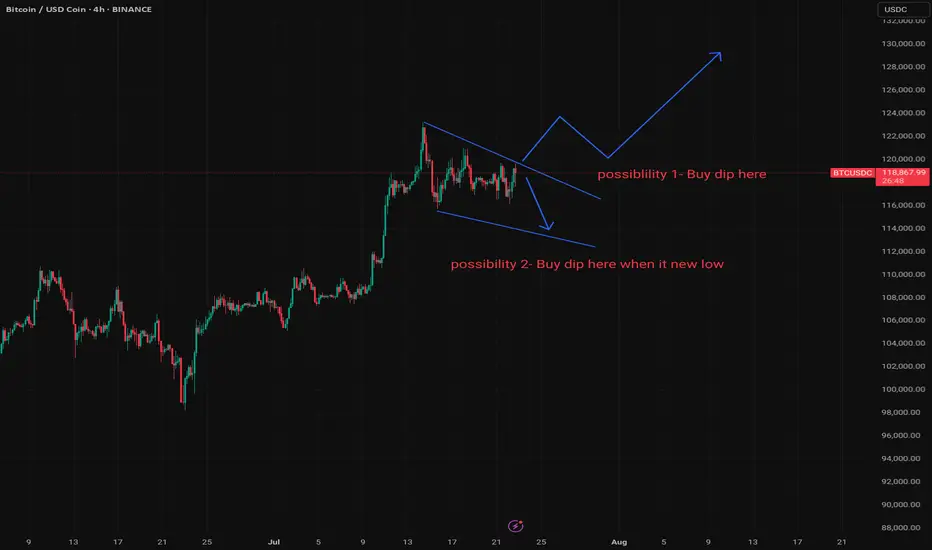
BTC Decision Point – Trade the Plan.BTCUSDC Outlook – Standby Mode Until Confirmation
BTC is currently forming a wedge on the 4H timeframe, typically a bullish continuation structure. However, now is NOT the time to enter. Patience is key — wait for price confirmation.
📌 First Plan (Possibility 1):
If price clearly breaks out to the upside, wait for a pullback
Drop to the 1H or 15min chart
Plan a long entry after price pulls back and forms a supportive structure and Stoploss below that pull back structure a little bit.
📌 Second Plan (Possibility 2):
If price breaks below the support line and forms a new low, do NOT panic sell
Switch to the 15min timeframe — it will likely appear as a downtrend. Wait for the first bullish impulse that may signal a potential reversal.
Enter only after price action confirms a shift from bearish to bullish trend (with green impulse) and Stoploss below that green impulse a little bit.
⛔ Conclusion: This is not an entry zone yet. Wait for clarity and confirmation from lower timeframes before taking action.
Long trade
15min TF
BTCUSD Perpetual – 15-Minute Chart Analysis
Key Trades Highlighted
Trade #1:
Type: Buyside trade
Entry: 114,171.5
Profit Level: 118,677.0 (+3.97%)
Stop Level: 113,635.5 (–0.47%)
Risk/Reward: 8.63
Entry Time: Thu 10th July 25, 5:15 pm (NY Session PM)
Target Reached: Fri 11th July 25, 5:30 pm
Trade Duration: ~24 hrs 15 min
Trade #2:
Type: Buyside trade
Entry: 116,411.5
Profit Level: 121,406.0 (+4.29%)
Stop Level: 115,751.0 (–0.57%)
Risk/Reward: 7.56
Entry Time: Tue 15th July 25, 11:30 am (NY Session AM)
Chart Structure & Technicals
Trend: Strong bullish impulse, minor retracement, continuation attempt.
Moving Averages:
EMA (blue): 117,873.4 (dynamic support/resistance)
WMA (yellow): 117,858.0 (price riding above, confirming bullish momentum)
Key Levels:
Resistance: 121,406 – 121,390 zone (Profit Target)
Support: 116,416 – 116,411 zone (entry confluence for current trade), 115,751 (stop)
Major Swing Low: 113,635 (protective stop on previous trade)
Volume/Orderflow Insights
Impulse up from below 114k, pausing at 121k resistance.
Volume is considered likely to increase at key support zones (116,400–116,000) and around target/profit-taking regions.
Actionable Trade Ideas
If Long:
Stay in: As long as price holds above the 116,411–116,416 support, with stops below 115,751.
Targets: 121,406 (major), consider partials at prior swing highs or if momentum stalls.
If Not In:
Re-entry Zone: Watch for bullish reaction at 116,416–116,000; enter on confirmation (engulfing, break of LTF structure).
Invalidation: Clean 15-min close below 115,751, or signs of heavy sell pressure.
If Short Bias:
Wait for a break and retest below 115,751 for a possible short to 114,700, but primary bias remains bullish above this zone.
Summary Table
Trade Direction Entry Stop Target R: R Duration Status
#1 Long 114,171.5 113,635.5 118,677.0 8.63 24h 15m Closed TP
#2 Long 116,411.5 115,751.0 121,406.0 7.56 In Progress Active trade
Outlook
Maintain bullish bias as long as 116,400 holds.
Look for trend continuation toward 121k+ on breakout.
Monitor for reversal signals if price fails to reclaim/hold above WMA or EMA.

Btc have big long chanceI want to get an optimistic scenario from Bitcoin, which can increase up to five times as far as the history of Hawings.
🇮🇷Long Live Iran🇮🇷
Swing D1 Double TopHigherHigh > HigherLow structure is broken.
LowerHigh > LowerLow has formed, so the main trend is Short at present.
Trendline break until it occurs, until then the Long direction is lost.
MovingAverage retest may give strength to another Long trend...

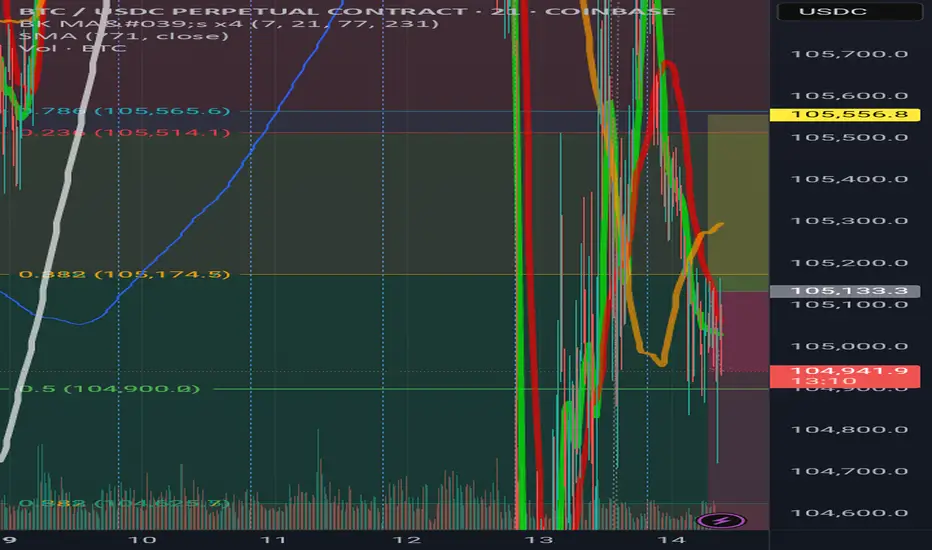
Bitcoin - Levels of the Range On the hourly time frame it is clear that BTC is within a rangebound environment. Using key levels such as the weekly highs and lows with Mondays highs and lows to to paint a picture of where support and resistance may be.
In the "weekly outlook" post for this week I suggested a retest of the $108,500 area, an orderblock that pushed prices lower and is notorious for protecting Stop losses of the shorts that pushed price lower, nearly instantly as the week starts we get that move to sweep the supply zone and stop hunt the short trades.
After a successful sweep the swing fail pattern typically follows when in a rangebound environment or absent of a trend. This structure plays out and the sell-off follows.
Price breaks through the Monday low with zero fight so momentum is with the bears in the low time frame. Should momentum continue the previous week low is @ $102,500 which is in line with HTF key level too.
RSI is also entering the oversold zone and in a rangebound environment can be when price reverses direction, as seen by the previous Monday High and Previous week low.
With FOMC just over 24 hours away volatility usually follows. No rate cut forecast however many think the interest rate should be brought down in line with inflation as the ECB has already done.
In conclusion, BTC is in a clear rangebound environment on the hourly time frame.
Stop loss hunt/supply zone sweep and then SFP, the LTF momentum is with the bears going into FOMC.
Next point of support at $102,500 (Previous week low) and could be boosted by the oversold RSI.
An FOMC rate cut should be bullish although currently thought to be unlikely.

Non Uclidean Fib BTC down after denial of Dual ZoneBTC keeps denying Zone the future of BTC spells a fall down a cliff
Bitcoin New ATH - Where now?After Bitcoin makes new all time highs, the next steps are very important. Where price goes now can be tricky to predict as there is the rare factor of price.
One of the only ways to predict where BTC may find resistance during price discovery is to use Fibonacci levels, using Fib extensions the first target for me would be between $117,500-$120,000. This area would be between the fib extension and the big even level, RSI would also be overbought on the daily time frame.
For the bearish scenario I think it's a much simpler play from a TA standpoint, lose the trend channel and get back under the old ATH level and I think we see a pullback towards $97,000. After such an extreme rally over the last 2 months with little to no rest a 10% correction would not be out of the ordinary despite such bullish ETF inflows. I have mapped a second target area should $97,000 fail, a SFP of the range can lead to a retest of the midpoint, this correction path would be much more severe with a more than 15% move lower.
To sum it all up Bitcoin has been on a great run in the last 2 months and has reached most traders common target of making a new ATH. Now there must be a new objective... Continue the move into price discovery or a corrective move? Price discovery has no previous selling history and so Fib levels along with big even levels are used to predict resistance levels. Corrective move would mean dropping out of the bullish trend channel and falling into a place of support, in my mind that would be ~$97,000 or failing that ~$91,000 (range midpoint).

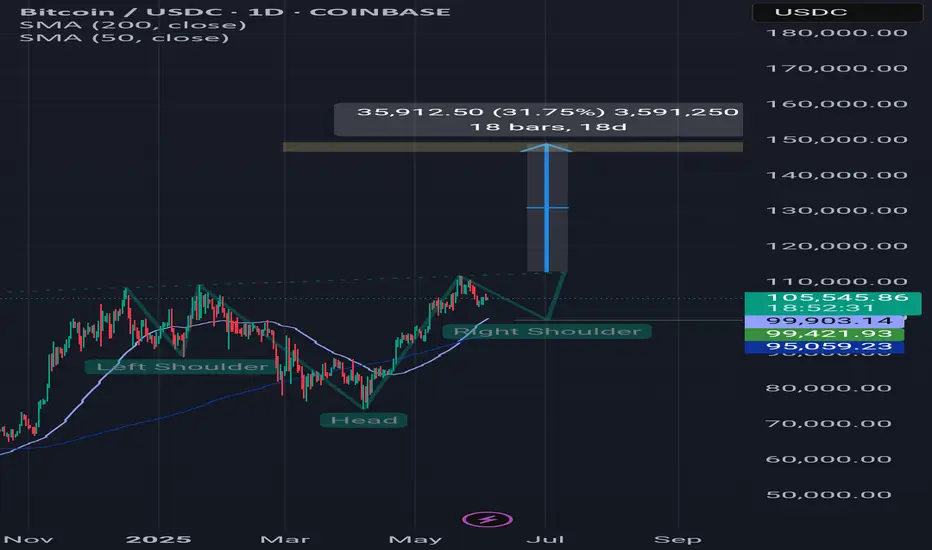
Btcusdt updateAnother scenario that can be imagined for Bitcoin is this. A head and shoulders pattern and a reversal from the $99,400 range and a rise to the $140,000 range, which could be the end of Bitcoin's celebration. In addition, we have a lot of news in these two weeks that may cause this 40% scenario to happen. Thank you for reading this text. Please share your opinion. Thank you.
BTC will drop from here to around 100k **Bitcoin Analysis Update**
Bitcoin has printed a **bearish divergence**, suggesting a potential reversal from the current level. Based on the setup, a drop toward the **\$100,000–\$101,000** range is likely.
This presents a **low-risk, high-reward trade opportunity**, with a **risk-to-reward ratio of approximately 8:1 or 9:1**, depending on whether the position is held through to the \$100K target.
As always, conduct your own analysis and manage your risk accordingly.
**This is not financial advice—trade responsibly.**

BTC short to 101!
**"Bitcoin is likely to retrace to at least the 101 level before resuming its upward trend. This area represents the next significant demand zone. Additionally, the next Fibonacci support 0.382 fib lies around the 98 level. Despite this expected pullback, the overall market sentiment remains very bullish, and I view this dip as a potential buying opportunity."**
---
This is not financial Advice, follow your own TA*****

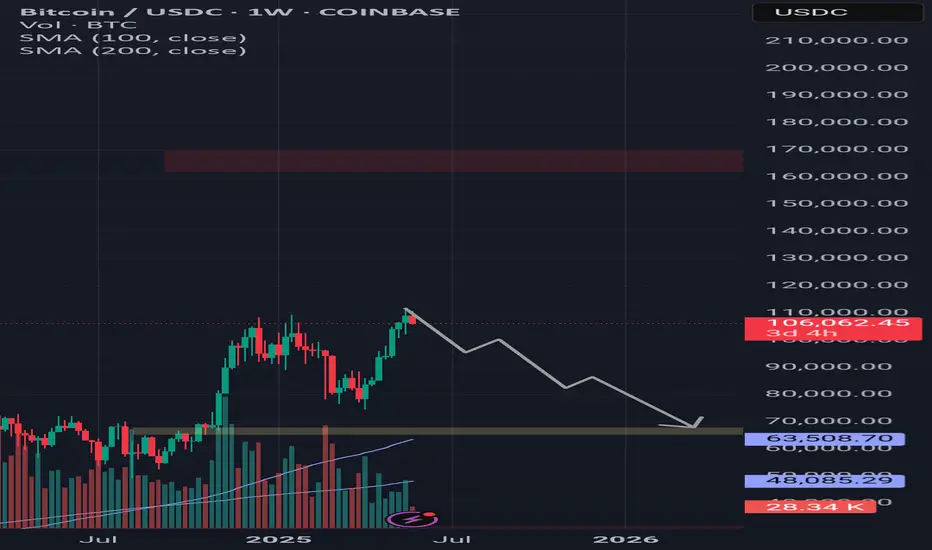
BtcusdtHello dears, I did a simple analysis of Bitcoin for you. If the next weekly candle is also bearish, it may happen with a probability of sixty percent. If you want to buy, buy at the specified price, which is about sixty-five thousand dollars. Good luck (⚠️A lot of data was reviewed for analysis, such as the Fear and Greed Index, Fibonacci, previous bullish periods, etc., but the responsibility for trading is yours⚠️)
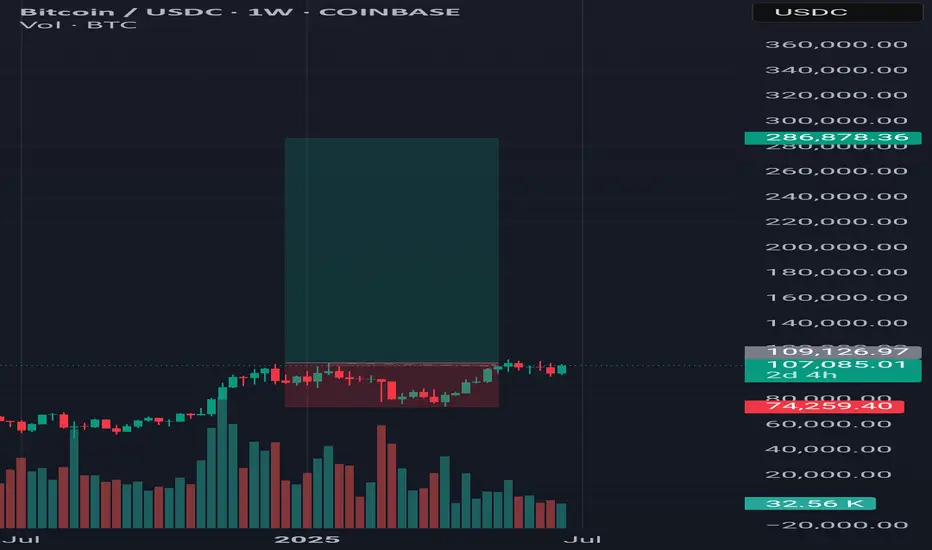
Bitcoin Levels in 2025Prediction levels on Bitcoin in 2025.
*first step - 143000 $ - 144000 $
* quick shot and back - 210000 $
* almost imposible in 2025 - 280000 $
We waiting for Fed decissions in this week.
- FOMC protocol 28 may 2025 - 19:00 (GMT +1)
- PKB USA 29 may 2025 - 2:30 PM (GMT +1)
- Core PCE 30 may 2025 - 14:30 (GMT +1)

Daily BTC OverviewThe daily chart in its simplest form can be broken down into this range. Since President Trumps inauguration, BTC has declined from a range high of $108,000 back to the lows of $74,500 closing the FVG caused by the US election rally. After a double bottom Bitcoin mean reverted back to the range midpoint which to me is the most important area on the entire chart because it decides if the bull run can continue or if it dies.
I like to keep a close eye on the 200 EMA on multiple timeframes but the 1D is important to gauge the momentum of the move. As the US election results came in a massive push away from this moving average causes the level to steepen in its climb showing strength. Since BTC spent quite some time in the top half of the range the 1D 200 EMA flattens out signaling a loss of momentum, once this level does become flat it no longer provides support. For a bullish cycle to be just that ideally the corrective moves do not spend too much time below this level before expanding above and beyond it once again starting the next leg of the move. A persistent move down below causes a rollover and the cycle looks to be over with a bear market beginning.
Bullish scenario - The correction is over and BTC consistently posts HH's & HLs bringing the 1D 200 EMA up with price and continues the previous bullish trend. I would want to see the retest of the midpoint be successful and then move to reclaim the next local high before targeting range high. The bull market correction looks to be over and bullish continuation resumes.
Bearish scenario - This move is nothing more than a LH, BTC wicks the supply above midpoint, swing fails back under and continues to make LH's & LL's back down to range low where the 1D 200EMA will have now rolled over providing more of a resistance level. The bear market looks to have begun.
I am not here to make a call on where BTC is going next as I do not have that answer, but I do have to plan for each eventuality and that is what I have done here from a TA pint of view. Now it is entirely possible that Geo-political news or an exchange hack etc throws TA out of the window and I have to rethink the plan but in a strictly chart structure perspective this is how I see it.
The indicator "TRADING ENVIRONMENT+V1.0" used in the Idea post is now publicly available for use, give it a try and leave your thoughts and suggestions on the post, thank you.

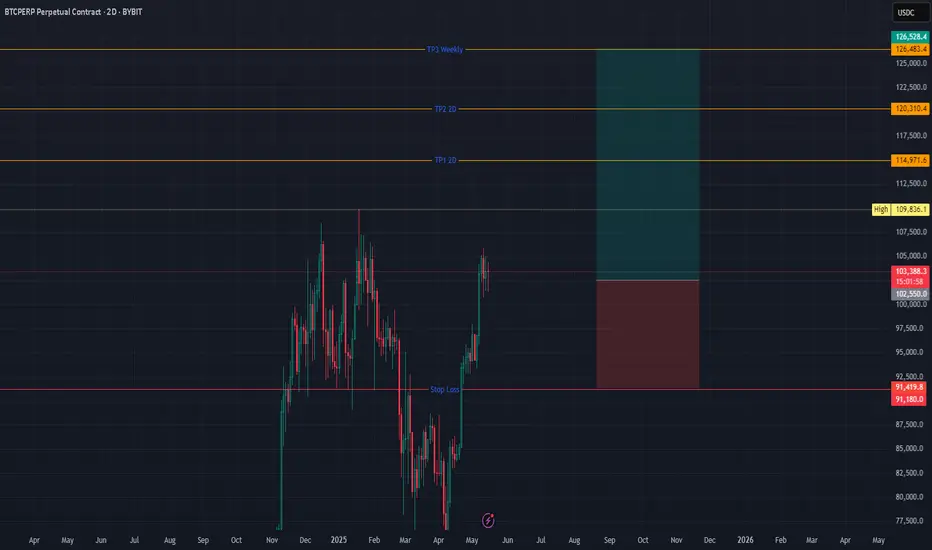
Long BTC Perpetual (BYBIT) | Breakout Confirmation?Here are my calculated levels in a bullish scenario with invalidation! This is only a future prediction and not a trade setup. Follow along:
Trade Rationale:
BTC has recently confirmed a higher low and successfully broken above the 100K psychological barrier. The price has been consolidating just above the breakout zone (~102.5K), suggesting strength and potential continuation to the upside.
A classic range breakout play is in effect, with the entry placed just above the recent consolidation and a clearly defined invalidation level (previous support zone near 91,180). The TP levels are aligned with historical resistance zones and Fibonacci extension targets.
✅ Scenario Validation:
Structure: Higher highs and higher lows confirm bullish market structure on the 2D timeframe.
Volume (Assumed): Breakout accompanied by volume expansion would validate momentum.
Confluence Levels: TP1 and TP2 are based on prior rejection zones; TP3 overlaps with weekly resistance.
Risk-Reward Ratio: R:R > 3.5, which is favorable for a swing setup.
Stop Placement: Below the major swing low, providing room for volatility without premature exit.
BTC - Bullish cup and handle 134kThe daily chart shows a bullish cup and handle formation for BTC.
The Fed will be reviewing interest rates on 19 June 2025.
There is a possibility that the rates will remain unchanged — a positive outcome. However, there's also a chance the Fed could cut rates by 0.25%, which could trigger a market rally.
At the moment, the bullish cup and handle pattern suggests a potential price target near £130K in the short term.
Happy trading!
Rafjj

Having a Mini ALT pump -but it may not last much Longer -CAUTION
The main chart is the Daily BTC PA and the BTC DOMINANCE ( BTC.D ) super imposed below, for the same period.
When BTC.D Drops and BTC PA remains stable, we see ALTS increase in Value, Mostly.
On the main chart, you can see that in Nov 2024, Till Dec, we had a mini ALT seasons and we are having another now
But will this last ?
If we look in more detail at the BTC.D chart below, we can get some ideas
Will it Last ? I do not think so.
We are on two areas of strong support right now.
The 618 Fib extension has provided support already and PA bounced. In fact, at time of writing, Many ALTS are in the RED on an hour chart. We need to watch and see where we go in the next 7 hours
Should this Fib extension Fail, Just below is a longer term line of support.
SO, I would head towards a High rate of Caution with the ALTS right now.
Does this mean that Bitcon will push higher ?
The potential is there, YES
High Level of Caution for th eALTS right now

Bitcoin and altcoins are entering a correctionWe expect Bitcoin to reach around 80-83k.
Closer to the time, we’ll monitor and look for entry points in altcoins 🤔.
During this rapid rise, Bitcoin was actively sold on the Bitfinex exchange, +1 for a correction:

"Bitcoin Analysis" (Update)The price has reached the 0.78 Fibonacci level, and as you can see, there is a low probability that this level will be broken. I expect that, from a technical perspective, the price will form a double top here and then decline to the Fibonacci levels. After reaching the support levels, I anticipate a strong push to GETTEX:98K . Additionally, the tensions from the India-Pakistan conflict could drive the price downward.
Stay Awesome , CobraVanguard

Bitcoin ($BTC) Long trading ideaOKX:BTCUSDT Long trading idea
Breakthrough of quarterly POC
+
Return for confirmation of quarterly POC
=
POE Limit 96969
+
TP 108108 (50% of position + 50% Price Discovery)
+
SL 95259 (breakeven when TP is reached)
=
RR 1:6.5
I am interested in your opinion on risk and money management data, local algorithm and tactical actions
Entry on a positive news background
+
With positive support from trendsetters
+
No nearby reports, speeches
+
Bullish graphic and candlestick patterns
+
Pool of indicator indices signals an uptrend
#DYOR

SHORT ON BITCOINBTC is currently printing a bear flag on its chart.
We are currently consolidating within the flag structure. Given the preceding bearish trend, the probability favors a downside breakout, with potential targets in the $90,000 - $88,000 zone.
It is crucial to closely monitor volume during the potential breakout to confirm the validity of the signal. Furthermore, confluence with other technical indicators and key support levels in the target zone could offer greater conviction to the trade.

05/05/25 Weekly OutlookLast weeks high: $97,941.18
Last weeks low: $92,845.16
Midpoint: $95,393.17
FOMC week returns once again on Wednesday, the forecast suggests no change to the interest rate is expected with 4.5% staying as is. The tariff acceleration we saw last month brought into question the timing of rate cuts and if they would be brought forward, it looks like this FOMC is too early to see a cut but it is coming in the future if president Trump gets his way.
The chart is an interesting one but one that isn't too surprising. The orderblock that sent Bitcoins price to $74,500 was at ~$97,000, naturally that area would be major resistance and so a huge amount of Stop Losses were placed there, price swept that supply zone wiping out SL and SFP back under the resistance zone, a textbook move.
An accumulation under the resistance area would be a sign that the bulls are building to flip the zone, however a gradual sell-off from here would then look like a HTF lower high, a very bearish pattern.
Going into the FED interest rate decision there is usually a lot of de-risking/ sidelining from traders until the decision is made, therefor the second half of the week would give us more directional information.
