Bitcoin maybe setting up for some big moves?Check out the IH&S on the monthly....could hit the target around $11k
BTCUSDC trade ideas

BTC USDLONG POSITION @ 9132 WITH TARGET PRICE @9331
NEED VIP SIGNALS DEEL FREE TO JOIN ME VIA TELEGRAM LINK IN MY STATUS


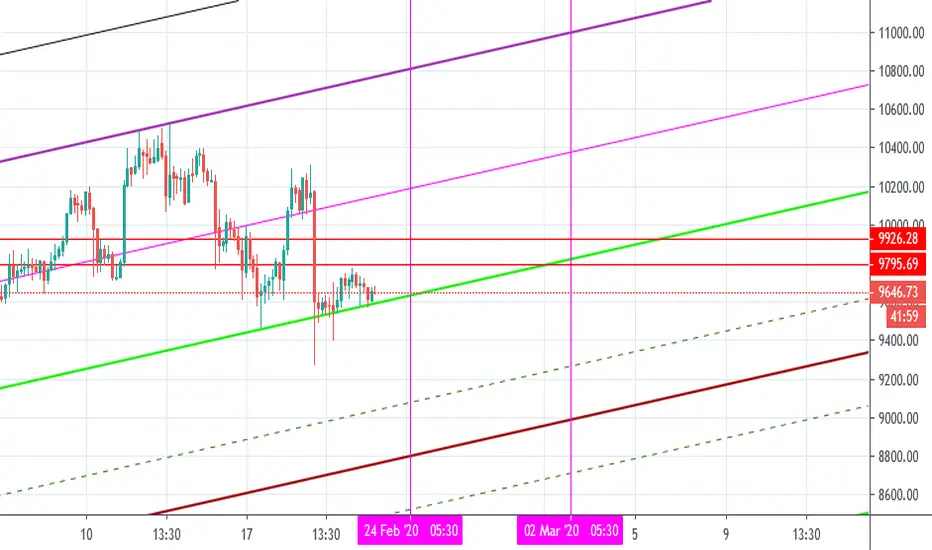
BTC/USD Bounce to around 9.200-9.600 oversold territory 1DGuys it’s my first technical analysis, please let Me know what you thinking about that. I would appreciate your comments.
Thank you and wish you all best luck!


BTC are we truly bullish or was this a failed wedge breakout?I decided to spend some time on the inverted chart. Clearly looks like our 4th wave collapsed out of the wedge. if we continue going lower I anticipate $5700, before turn around.

BTC triangle trade the breakoutwatch for any breaks of s/r levels in the above chart and trade off of those.

Decision pointDecision point - BTC's Pac-man ready to eat-up all your shorts with a vertical move. (90 degrees or breakdown for re-coil)

A case for bitcoin bearsSee how break of the trendline last july gave us the signal that the end of the bull run was near. Could we possibly see something similar again?
It is better to be cautious of this run till price closes above 11k on monthly, a better indicator would be price closing above 11.5k on weekly.
Till that time its better to be not too bullish


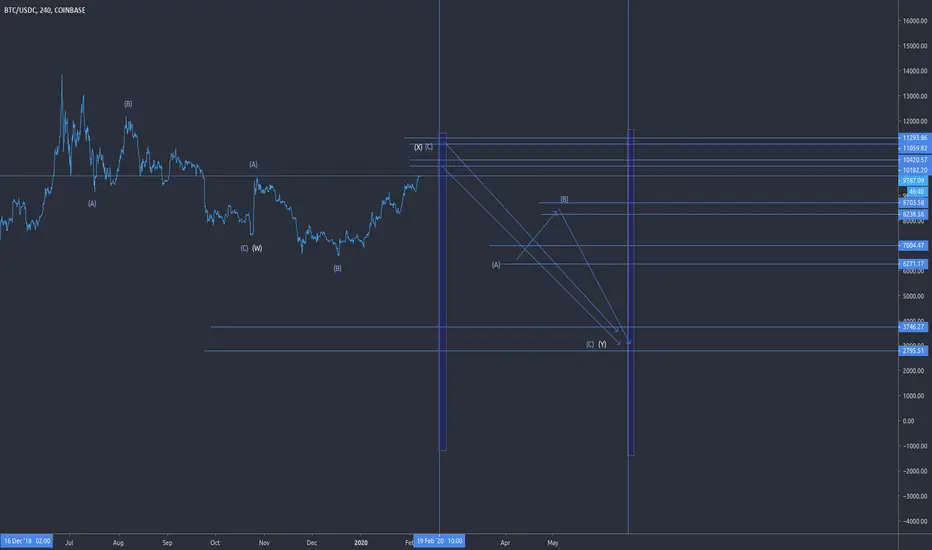
btc crypto ethAccording to this count, wave B is over and wave C can lift the price to $15 000 from now on.

the last target of BitcoinIn point of my view bitcoin has started a new targe in 2021. First of all, bitcoin will build another triangle like the past then reaching to targe two as shown in the chart.


BTCUSDCGuys, if you like the idea please put like button, this will be the best thanks. Thank you for your support, I appreciate it.

btc / usd but we should think both sides too , this one looks something fissy ,note everything is probalities , so this count might be invalid above 10k$ !!

BTC USD quick bull 2020 q1My personal inclination is good times are coming in the cryptosphere, and they'll be here promptly. Picking the right alts will offer substantial leverage, but it's so darn hard to pick the right ones... so maybe I'll just stick with BTC for the ride.
As always, just doodling. Time will tell if right or wrong.

BTC Highway to Hell after 9423? This channel is what I'm currently working with. I had a strong to desire for 8k, but I'm personally hoping it under-shoots to 7920. From there we get a small mercy pump to 8640, before coming back down to test 8k for support. Ultimate move back up would be 9423. Then watch out below. There is hard core potential to dump to $5500. Stay un-REKT.

8960 or Dump? This feels very unfinished and struggling to hit that target. I'm planning for a sharp pullback to 7980-8k before giving it another go. Happy pump Friday everybody.

BTC USD : SHORTI'm a simple trader
i follow the trend
i buy at supports
i sell at resistences . EASY !

Why we may go to 11.2k before dropping lowerI have been aiming for up to 8900 and crash. This is just one bullish 3 wave move Idea, that caught my attention. Look to the left and the support in the blue box. We will correct down from here, but I'm starting to want to buy that 7500ish dip.
