BTCUSDC trade ideas

new update for BTC-setupafter seeing lots of bearish volume i considered entering on the bottom rather than middle. if it get to my willing area i'll take a 6 RR trade . lets see what happens ...

BTC long setup DO NOT FOMO!!!wait patiently for price to come back to the demand zone and then enter for a 2RR trade and enjoy the ride. dont jump in on the pump . its gonna blow up your account

The DOWNTREND BECOMES STEEPERDeveloping
As posted earlier The Downtrend of Falling price Becomes Faster.
The Descending Trendline Becomes Steeper

$btcWho nuke the corn from the nuky bar?
Who me?
Not me
then who?
Mmmmmm
SPX
3400 point could be our next bottom in btc500

BTC still within the Bearish channel | week is not over yet.ON the daily we see a respect of the Fib bearish channel, this short pump is nothing but a false bull trap in my opinion, I might be wrong. Don't take it as fin-advise, think on your own. Best Regards.

FALL OF BITCOIN ACCELERATES. THE DOWNTREND BECOMES STEEPER
Sometimes the Fateful Watershed-Momenet IS CLEARLY VISIBLE.
Well, such moment is Now - the RATE OF Price FAll of Bitcoin becomes Faster.
The DEcline of the Trendline Visibly STEEPER

where to long btc???I prefer to wait for btc to come to the demand area and long it for a 4RR trade to take.set your alert and wait...


$BTC MacroMaybe most forget about this level and most are looking into usdt pair which had FUDs during that days, hence I think wave 4 is done and we have our range finally.
42K is 24K
30K is 17K
But I think the range we be bigger and almost 124 days, maybe the spring in mid oct then up only.
Invalidation1: if clean breakout above 24 level.


Bircoin BREAKS Lower Support of a WEDGE - BIG Move has BegunA day-long very methodical oscillations have built a strong wedge -
AND IT HAS JUST BEEN BROKEN ON THE LOWER SUPPORT.
LONG AND STRONG DROP IN PRICE HAS JUST BEGUN

BTCUSD Clear Bearish Double Top has formed. SHORTS CONTINUEA BEAUTIFUL, CLASSICAL Double Top in BTCUSD - thsi is a STRONG Bearish formation has been completed on 4 H and 8 H time frames.
As the Markets of Nasdaq and S&P will continue the fall today - a VERY GOOD OPPORTUNITY for SHORTING bItcoin TODAY.

AND THE BITCOIN CAME TUMBLING DOWN - BREAKS TRENDLINE SUPPORTGentlemen - THIS IS serious.
The major lower Supporting trendline has been crossed down by BTC.
As well as final Departure lower from a 240 hours MA.
Next support - possibly 20,000 $
As the famous song on Jericho walls "and the Walls came TUMBLING DOWN"

Bitcoin has just broken multi-day Lower trendlineBitcoin has just broken multi-day Lower trend-line.
And Once again - the market maker has Opted to dump on Saturday, to sell at the time the Institutionals are closed, and thus at the best price to sell

Bitcoin SUDDENLY FALLS - ON SATURDAY...
When a big Fund or Whale intend to sell and LIQUIDATE a big Chunk of its soon-to-be-worthless Bitcoin - it OPTIMIZES the time and day.
The smallest participation in the Market is of course on Saturdays and Sundays when almost all the Institutionals are closed.
Then The price reaction to a big sale will be the least on weekends.
This IS A REPEATING trend - BIG BITCOIN SELLOFS start on weekend.


MEME DOOM CHART (short 29000 -> 9666)Disclaimer: entertainment purpose only. What IF saylor, elona and "stable" coins are rekt? Crypto as we know it will be doomed, IMO LOL

BTC bulls capitulation18-19k is a minimum target linked to h&s formation. achiving that level is a good news for all risk assets

BTC inverted chart bull flag, next target 16.5kinvert charts and you will see a bull flag , we going to dump
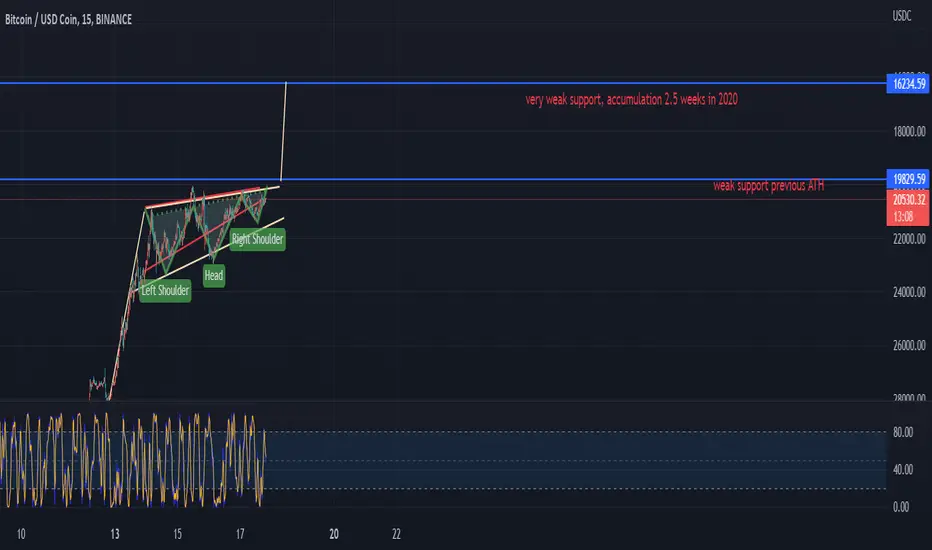
BTC will bottom at 12k, accumulation 12k and 19k, 2025 135kIf we break 20k and flip it to resistance then we will indeed go to 12k levels, where there is big support.
This is possible from fundamental analysis
1. more rate hikes for about three quarters
2. stock market has not bottomed out, there is support coming in, though
3. borrow protocols like celsius and 3ac who needs to be liquidated
4. 4 year cycle respected
Adam and Eve inverted pattern is also very strong, don't underestimate it


Bitcoin 60% move to $48k near termIt is sickening. Glassnode is continuing to indicate wallets that bought Bitcoin last year are the ones selling. Yet I know there’s a high probability price action is about to move back up to $48k. Regardless of ‘how’ I feel about this, the market needed to move those players off the board.
On the above 10hr chart price action has corrected a massive 40% since the sell signal.
>> Side note: As far as I can tell price action has never corrected this deeply in such as short space of time, not even during the March 2020 crash. That’s saying something.
Now is an excellent time to be long. Why? Seriously? Ok here’s why:
1) A buy signal.
2) The green trend line on the 2-day chart. Very little coverage of this out there. Look left. If support to target of this idea is confirmed, well…. we’re going to see a blow off top rally like in 2013 and 2017. This is an important trend line.
Is it possible price action falls further? For sure. For last year’s wallet holders no price is low enough.
Is it probable? No.
Good luck!
Ww
Type: Trade
Risk: <=6% of portfolio
Timeframe: 1-3 months
Return: 60% minimum
2-day chart - that green line
Looking left and zooming out:
