BTCUSDLONGS trade ideas

BTC/USDT
bitcoin may form Shark pattern at D point
and also ab=cd
I will wait for price action at the price of 11220
will update entry if the price go to this level

14 Nov 22 BTC/USDTMarket is expected to make HH and HL for the short term.
Not a financial advice just an analysis.

Indecision is the enemy of success.The most successful traders have one thing in common: they know when to pull the trigger. They don’t hesitate. They don’t second-guess themselves. They make a decision and they stick to it.
Indecision is the enemy of success. It’s what causes trading losses. If you can’t make a decision, you’ll never make any money in the markets.
The trick is to not let indecision steal your opportunity. When you see a good trade setup, don’t hesitate. Take action and be confident in your decision. Remember, even if it turns out to be a wrong decision, it’s better than no decision at all.
Follow Me For More 👉 @MarketsCoach


BTC PA 23WTFDIK SD
BTC fib channel analysis from 2020 to 2023. A possible mid term pump then regulatory/stock market driven dump to a generational low around the halving.

BTC downward trend to potential upward trendBTC is in a funnel right now. has a higher chance to go down but after that might go up.

BTC/USDTBitcoin may form a Bat pattern at 15920
Potential Reversal Zone (PRZ) from 16175 to 15920
Permissible Execution Zone (PEZ ) from 16175 to 15778

BTCSHORTSbtc still works fine...
squeeze here before continued selloff or nah?
shorts breaking trendline
with potential mini ihs in the works on somecharts

coming down to the weekly supertrend with xbtbitcoin is making the bear rounds, and is in a snapback phase counter to the bear trend. basically right when this strat says sell is where you want to buy. that point should occur soon.

Downtrend did resume, and what's next?
The chart would be self-explanatory.
Here we are rebounding from FE 0.886.
I marked 1.000 and 1.114, respecting the H & S.
This article is tagged as "short," but beware of possible extensive upside moves. Better be cautious until the candle crosses down the arcs' crosspoint (at least in a lower timeframe).
By the way, this is an update for my most notorious chart.
While my previous analysis has astonishingly been trolled, the chart didn't take care of what they felt-
Like it or not, this is the fact.

Weekly candle to close red suggesting trend continuation
Gann Square, the built-in smart tool of TradingView, is provided with many fans and arcs. Every single one of them, if properly plotted, is considered to serve as S & R. Not to mention their crosspoints.
In this chart, I applied it so that only the strong movements (progressive waves in the E.W. Theory) in the trend direction penetrate the arcs and the crosspoints.
So if the weekly candle closes red, the arc resistance is confirmed together with the trendlines, making any upside to mark HH more difficult (implying a continued downtrend).
Let's check this scenario.
Although this is not textbook theory but my empirical analysis, the light-green shaded zones act as resistance zones like the Ichimoku cloud.
Considered in conjunction with the low of 17600, we would see a large or small rebound there.
However, a move beyond 25k, especially over 28k, within one or two weeks is almost unlikely, given the overhead crosspoints and the likely continued macro downtrend.
Gan Fan 1 x1 (thick black) may serve as support. Watch 16500 if 17600 support is lost.

BTC... Bear Market is over soon !!!BTC is close to the strongest supply it has ever been. ONLY UP FROM THAT SUPPLY !!! 10k-12k

Bitcoin's Significant Upward Resistance Suggests Drop Is NearBitcoin is facing significant resistance from both moving averages and the combined wedges that have been forming over the last few months.
Equity markets and Bitcoin are closing into key technical make or brake moment. I believe we might see more bull traps before a significant drop over the next week.
Goodluck

short head and shoulders pattern made on chart head and shoulders pattern made on this chart so ready for short of target 17700 in few days


Big Bull Trap is Over Be Ready to hard PAIN (BTC to 6680)I guess the bull trap is over for now and we are going to fall down to the maximum pain without mercy without feelings
hey guys be carefully they manipulate the major move to take your money
best luck to all

FLAG IN BTCafter breaking the flag , we can enter in a long position by a stop bellow the support zone and a good target .
good luck

BTCUSD correcting to 8000 USD before move upNow in wave 4 of (3) to complete with (4) and (5) and then ((B)) to end (((2))) begin 2023
Expecting 5 to complete in an ending diagonal

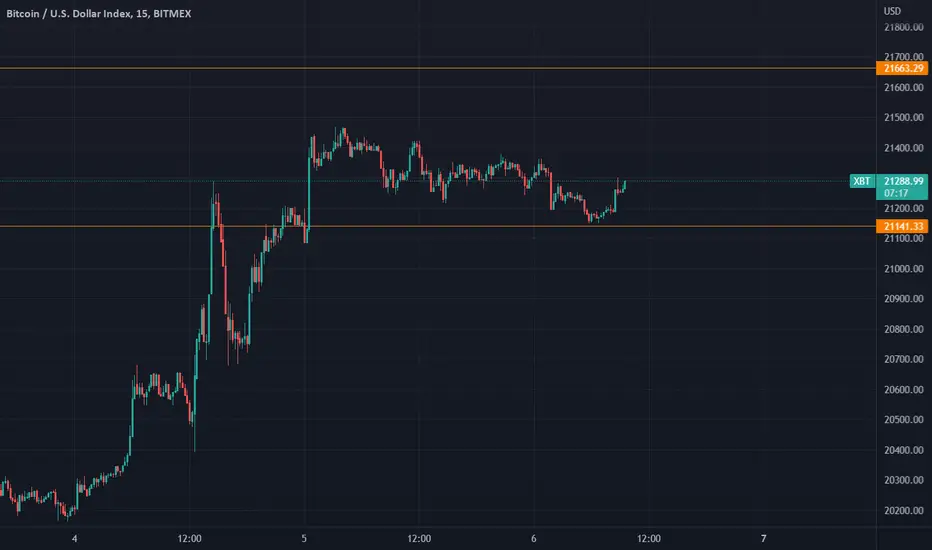
Static support and resistance For XBT UpdateAs you can see, the price reached the specified support and was supported.
Trade Setup - expecting a completion of the c wave Assumption - this is the final attempt to capture C and go down from there
Risk : massive upside haha . tight SL in place . low chances of success , but high reward if successful

Static support and resistance For XBTThe static support and resistance of the price is determined based on the past of the chart.

BTC 2018 vs 2022notice comparison of .236 fib between
2018 and 2022. Maybe what we are anticipating has already happened? Maybe.
MA and RSI study
