BITCOIN 15MINPreferably suitable for scalping and accurate as long as you enter carefully the price behavior with the drawn areas.
With your likes and comments, you give me enough energy to provide the best analysis on an ongoing basis.
And if you needed any analysis that was not on the page, you can ask me with a comment or a personal message..
Enjoy Trading... ;)
BTCUSDLONGS trade ideas

BTC BuySHOULD I BUY AND HOLD ONTO BITCOIN?
You can buy and hold onto Bitcoin, especially if you want to make a bigger profit long-term. As more and more people buy and use Bitcoin, you have a chance of gaining more value and purchasing power from the BitCoin you buy today.
Keeping your Bitcoin can also be smart if you buy it when the price is somewhat high. Not only will that keep you from losing money, but you could still make a profit in the long term.
Of course, the value of Bitcoin will continue to change. If you follow the market, you can watch your purchasing power grow rather than diminish due to inflation.
THEORY #1
One reason why Monday and Sunday tend to be the best days to buy Bitcoin is the weekend. Since many business people trade Bitcoin, the market isn’t as active over the weekend.
Getting in before the market starts back up means you have a better chance of landing a good price. If you wait until the middle of the week, odds are the market will be more active and prices will be higher.
THEORY #2
The weekend also acts as a time for people to consider and decide on buying in. As people start to buy Bitcoin on Monday, the price and demand increase.
Once the week finishes, the demand drops off. The cycle then continues each week.
If you want to buy Bitcoin, try to beat the rush so that you don’t have to pay more for the same amount of Bitcoin.
THEORY #3
If you want to avoid high prices, avoid common paydays. After all, when you have more money in your account, you might be tempted to spend it.
Since many people get their paychecks in the middle and at the end of the month, Bitcoin prices can rise quickly. If you can, wait a week after payday before you invest so that you can get a better deal.

Bitcoin Big Bull TRAP before the major move to 6500 Bitcoin Big Bull TRAP before the major move to 6500
We are near from the major move and it will destroy your feelings and emotions be carefull


BTC.USDTBitcoin is on the previous ceiling. This is one of the best places to buy and hold for a long time

BITCOIN 1WPreferably suitable for scalping and accurate as long as you enter carefully the price behavior with the drawn areas.
With your likes and comments, you give me enough energy to provide the best analysis on an ongoing basis.
And if you needed any analysis that was not on the page, you can ask me with a comment or a personal message..
Enjoy Trading... ;)

target is near 4/5k wave 5's flash crash is approaching, notice the pattern on the stoch as well, the last 2 times the stoch has been maxed out have been right before wave 1 and 3's crash. nfa, but i recommend holding stablecoins, usd, or shorting.

THE MEDIANLINE Hello friends i look good BTC buying inside candel I use 15 minute time frame. BTC chart higher high pattern and support red median line my target is 19550 upper median line . 2nd target 19640.

BTSUSD- 4H Long Term Bullish ideaThe price action has formed a famous butterfly üattern. which indicates a bullish move UP.
If the price respects the rising trendline and moves UP to TP1 and TP2.

BTCUSDT/ D As you can see, the price has moved positively from the important range of 17,600 to 25,200 thousand dollars, and with the accumulation of liquidity, it has been accompanied by selling pressure, and the price has started to correct again to the range of the support zone. The price has reacted to its important resistance 💹
The price is currently in the range of 20,268 thousand dollars. If the range of 20,000 / 19,700 thousand dollars is maintained and the candle close is above the range of 20,500 / 20,800 thousand, we can expect growth up to the range of 21,800 / 22,000 thousand dollars.⚠️
Otherwise, the possibility of price correction towards the specified area. Support ranges of 17600/18200/19100 have been identified.

btc longs vs. btc shorts on Bitfinex I squared the chart added fib circles. based off this idea, today October 3rd could be a major pivot point, either longs take control and break above resistance or the bears are back in action, pulling the price downwards.

Support/Resistance lineswe go down
down to like 12k down
but anywhere between 10k-15k
but regardless
we go down

10k will come very quickliking these manufactured pump and dumps where whales are exiting? get ready, the day is coming.

btc perfect waychoffI see that BTC finished the Waychoff pattern and finished the d phase.
strong support
positive rsi
negative news
break negative trend
it's perfect for massive pump.

Watch out below this levelThis level is weekly support, if it breaks, I think price action will fall into the 14,000 region.

BITCOIN 1DPreferably suitable for scalping and accurate as long as you enter carefully the price behavior with the drawn areas.
With your likes and comments, you give me enough energy to provide the best analysis on an ongoing basis.
And if you needed any analysis that was not on the page, you can ask me with a comment or a personal message..
Enjoy Trading... ;)

BTCUSDSHORTStarget hit but it didnt go as deep as last time, btc might retrace this move to bait more shorts or it could continue on to the same lvl as last time unsure tbh

BitcoinHello Traders,
this is an intraday trading idea.
Btcusd is making an inverted h&s looking to 20 K resistance test.

Bitcoin 4h chart As long as bitcoin does not break the trendline, then we can see some pumps.
However, it's important to note that bitcoin need to retest 17.5k before moving up

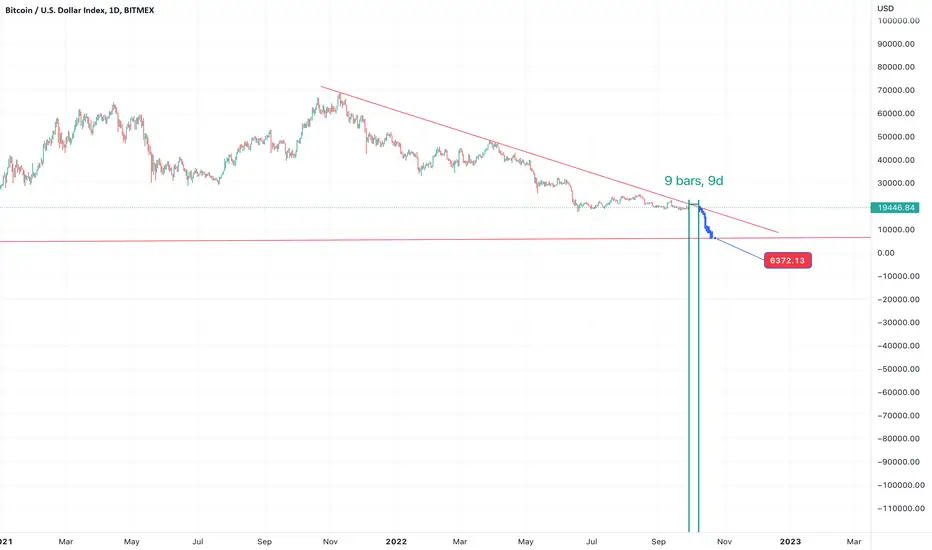
Bitcoin on the way to visit 6300 $Bitcoin on the way to visit 6300 $ before we going to the moon I guess it will be the best time and the pest price ever
Bitcoin's inevitable drop to 16k underway?Long term I am bullish on Bitcoin and Cryptocurrency.
Short term, I think we are likely to see a rapid sell off to around $16.6k.
When setting this trade up, I considered a way to lower the risk and increase the return. Rather than using leverage directly on Bitcoin, an asset with solid fundamentals and the safe haven in a cryptocurrency rout. I have taken shorts on two other cryptocurrencies, that I have priced as over valued.
1) I believe Ethereum Classic (ETC) is currently overvalued, due to a recent rally spurred by Ethereum's (ETH) 2.0 network upgrade. ETC has been pumped with the sales pitch >> ETH miners will move to ETC, dragging over a significant portion of the ETH user base over. This is not likely in my opinion and therefore the rally is not supported with fundamentals. I foresee a sell off to the $18-20 range, a range in which I will close out my position. Current trade entry of $41.60.
2) The second short is Optimism (OP), a relatively new cryptocurrency that has been pumped from $0.50 to $2.30. Even considering it's retreat from $2.30 to $1.15, I see a further pullback to $0.80 likely, maybe $0.60 will see. Entry of position at $1.46.
Best of look out there.
RISK: Crypto might rally with the upcoming upgrades of both ETH and ADA.

BTC Market Analysis 27/09/2022BTC again bounced from the trend-line of the symmetrical triangle and consolidation in the symmetrical triangle continues.
Bulls have tried to break the resistance trend-line many times but ended up in fake-outs or rejections.
Now we have to wait for a breakout with a retest, which will confirm a bullish move in the market, and a breakdown of the demand zone with a retest below it would be a sign of a bearish move in the market.

BTC LongBTC has printed bullish divergence on the weekly along with bullish divergence on the daily, expecting a move up to complete wave 4 of C.
TP below FVG fill.
SL above June low.
