BTCUSDLONGS trade ideas

Bitcoin Sell Scenario Btc has broken down the 2nd support and is looking very weak right now, tread carefully! www.shareawarefinancialresearch.com


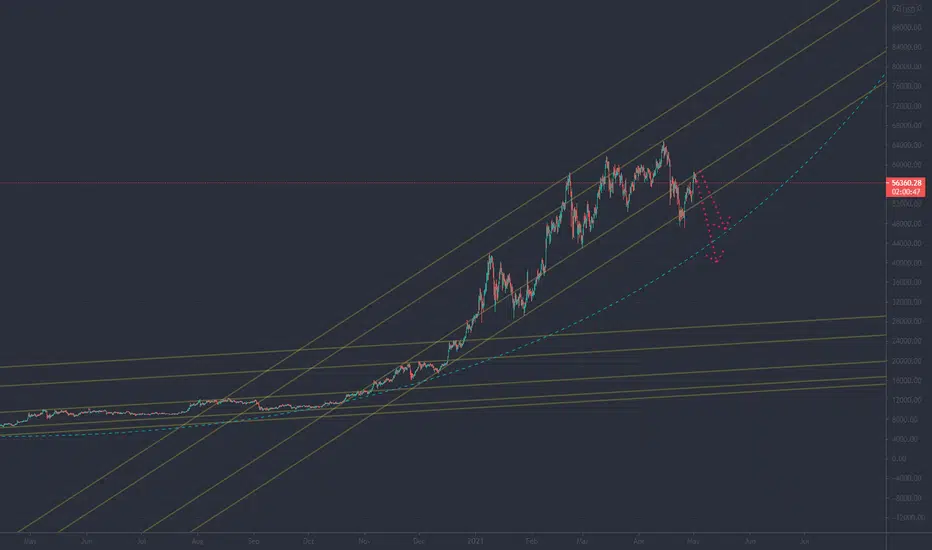
Possible Bitcoin ScenariosBitcoins weaking the last weeks more and more. Best, but very unreliable version would be sidewards trend. More possible is a draw down.
So targets are 42k $ and maybe 22k$
So fasten your seatbelts :)


BITCOIN Entry just above previous high- Strong momentum to the upside
- Entry earlier today off the 382 predicts 618 extension
- New targets at 65k+


In the Great Falls Only important support ma 200 Yellen Warning Treasury Secretary Yellen says Jrates may have to rise somewhat to keep economy from overheating ...cnbc


BTC/USD 105 MinBTC is in a Long neutral ....... is Ready to Brake a apparent weak supply zone, is between $58100 and $60000, if BTC break hard 60K it cam reach 61K and 63K but if not pass 60K with power then turn down to Sell if Turn down in 57K and 56K, if brake 60K can reach 61.5K if brake 64K can reach 65K and rejected in that area forcing sideways or down the price.

Multi-Timeframe Analysis: BitcoinHourly Chart: Expanding Triangle(Bearish)
Daily Chart: Bearish Flag + Doji followed by confirmation Candle at 0.618 Fibonacci level. (Bearish)
Weekly Chart: Closing below Flat Top triangle for 2 weeks, and Bullish Engulfing after a Spinning Top and confirmation. (Neutral-Bullish)
Monthly Chart: Spinning Top after 13 months of Parabolic price move.
Change in Average Dollar Value of Trades: in the first 4 months of 2021 in comparison to the last 4 months of 2020.
Conclusion: Bearish is the most probable scenario.
Moshkelgosha
Educational Articles:
1-Triangle:
www.investopedia.com
2- Retracement vs reversal:
www.investopedia.com
3- Fibonacci Retracement Levels:
www.investopedia.com
4-Flag:
www.investopedia.com
5- Bullish Engulfing:
www.investopedia.com
6-Spinning Top:
www.investopedia.com
7- Parabolic uptrend:
www.investopedia.com

look on bitcoinsome consolidation but exponential phase yet to come
trend development can be divided in start phase, acceleration phase and an exponential phase, we already got a very long start phase and currently ended the acceleration phase of bitcoin, this gets way clearer on 4 hr timeframe, im so far assuming exponential phase is yet to come,
this is also fitting perfectly to the halving cycle, according to which we will see a bullish continuation for minimum 3 to 6 month
Updated target for BitoinBitcoin failed to close above its 50EMA and the most probable scenario could be another down leg to 41k.
Bitcoin was 63800 when I said history could repeat itself and compared the Coinbase IPO to Emil Oldenberg selling all his bitcoin indecember 2017.
