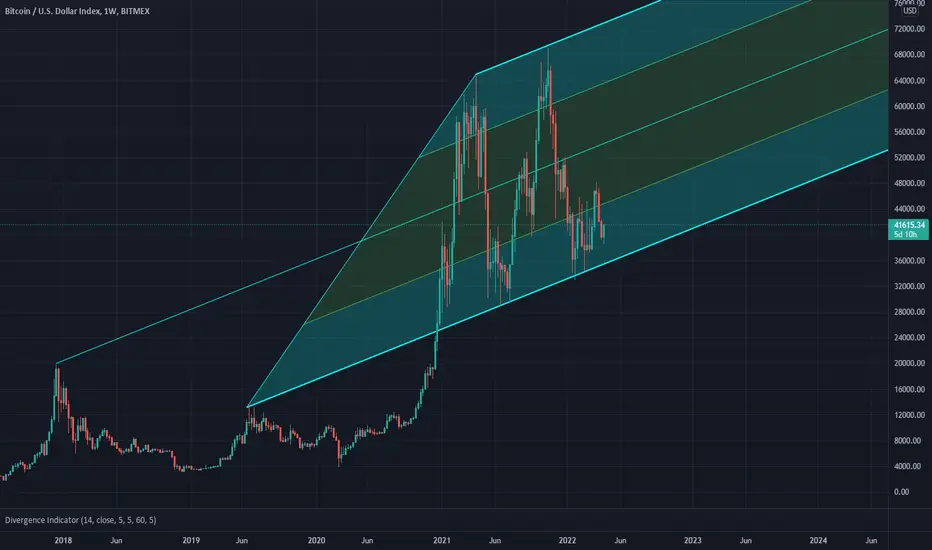
BTC Pitchfork Support and ResistanceInteresting view of BTC and support resistance on a weekly chart using the pitchfork.
BTCUSDSHORTS trade ideas
Bitcoin LONG vs SHORT! THIS COULD BE ITHey there,
tin this chart we can see, that when longs and short both decreased a short term uptrend was the result.
We can see it in the rectangles in the purple areas.
The white line is BTC. The red line are the shorts to visualize it more visually.
The verticals show the points when btc longs AND shorts both fall down- this happened 3 times.
Stochastic & normal RSI are at an oversold level, this is a bullish indicator as well!
Anyway, I hope you enjoy this observation and it feeds your technicals analysis with more data.
Have a nice day,
Have a nice day,
Roman
--------------------
Focus on the journey, not the destination. Joy is found not in finishing an activity but in doing it.
Hope you enjoyed it as I did reflecting on this one…you can follow me if the content pleased you :-)
Feedback would be awesome

BTC in Bullish zoneBtc now joined the bullish zone. Here's the signal, and entry anywhere between the targets
Targets 41400 - 42800 - 44000 - 46720
Stop Loss 38200
Leverage : 5 -10x

BTC PumpAs we can see we are about to break this trendline resis and go into bullish zone with massive pump. Green are tp's and red is sl. Enjoy profits

Analysis Review (Persian)This video is a review of my analysis since 24-dec-2021
I have my own analysis style , result of this style is 76% win rate. 💪💪💪

The new Bullish cycle is just started..!Question: Is this a good time to buy?
Answer: No
So what is the plan?
Wait,,!
Wait for what?
For the Pullback to 44-45K and buy..!
What would be the target?
1st target would be 50-52k
Best,
Dr. Moshkelgosha M.D
DISCLAIMER
I’m not a certified financial planner/advisor, a certified financial analyst, an economist, a CPA, an accountant, or a lawyer. I’m not a finance professional through formal education. The contents on this site are for informational purposes only and do not constitute financial, accounting, or legal advice. I can’t promise that the information shared on my posts is appropriate for you or anyone else. By using this site, you agree to hold me harmless from any ramifications, financial or otherwise, that occur to you as a result of acting on information found on this site.


The Best Bitcoin ChartI created this chart based on my years of experience in the market. The object of the game is to keep it emotionless and trustful. I have been playing this chart for a while now and look forward to sharing it with you

Short BTCUSD at market price now!! Futures Trade Free SignalBased on the analysis in my video i did ealier, this is a quick trade. lets hope things go as planned.
NOT FINANCIAL ADVICE

What to expect from btc this week BTC UPDATE FOR APRIL WEEK 2NOTE: THIS IS NOT A FINANCIAL ADVICE
Btc is back into its wedge that controlled it for more than 2 months, this video will guide you on what to expect next.

Accumulation or Redistribution that is the question?Do you think the picture is similar to the chart pattern?
I think soon we will have the answer to this question, I would rather wait for a clear breakout and confirmation to enter trade..!
Previous analysis:
Conclusion:
Wait for breakout..!
Best,
Dr. Moshkelgosha M.D
DISCLAIMER
I’m not a certified financial planner/advisor, a certified financial analyst, an economist, a CPA, an accountant, or a lawyer. I’m not a finance professional through formal education. The contents on this site are for informational purposes only and do not constitute financial, accounting, or legal advice. I can’t promise that the information shared on my posts is appropriate for you or anyone else. By using this site, you agree to hold me harmless from any ramifications, financial or otherwise, that occur to you as a result of acting on information found on this site.

BTC USD 4 HOURAs long as BTC can stay above on this trend line, it has a bullish look on short time frame and I will be looking for a long, at golden area of Fibonacci channels. Not a financial advice.

Bitcoin is in two forms of transition, and whatever that trend iAfter two months of rebound, bitcoin's current weekly trend is shown in the figure, forming a standard high box, which is relatively easy to grasp.A high before the higher breakthrough, means the formation of a new bull market, a lower breakthrough before the low, means the beginning of a new decline.
In theory, the high box upward breakthrough is a high probability, but here it should be noted that if the current rebound high can not break through the high in April last year, it is possible to form the head and shoulder top shape.Therefore, there is a certain probability of forming both forms of head and shoulder roof or box.
Of course, the current macd gold fork, good for the bulls.No matter what the future goes, once the trend is formed, it will continue.
So if you want to do more heavy warehouse, you should be in the breakthrough before the high, that security is much higher, and want to sell short, should also be in the break below the lower edge of the box, so that the certainty is better.

BTCAround the 50000 price zone, BTC could reverse due to the completed wave structure wxy. Please pay attention.

BTC on the 2 dayrising wedge type bearish pattern followed by massive bearish divs on large time frames
TP $12,000 on short
this will take time to play out, alot more retail needs to be trapped

Bitcoin Roadmap Chapter 4BTC now can complete this extension pattern , as far as I mentioned on this Idea we can not name a harmonic before it appears , but we can talk about probability ...
So in this case we go up to 42k , there we have a strong resistance , after a while , price can violate this resistance and grows up to 46k. And then I will update this Idea.
This in NFA and be careful about the news in March .

BTC Moving Average SimilarityHello, the daily chart shows similarities of Bitcoin moving average price lines. In this case, I think we will enter a bull trend just like at the end of July. The only difference between July and the current situation is that the Stoch RSI lines are not exactly similar.(NOT INVESTMENT ADVICE)

PO3 and fractal on bitcoinThis accumulation range feels like it needs a big capitulation move before any meaningful upside. Best case scenario is a move below last year's support to grab insane amount of liquidity, establish bottom, and run it up turbo. NFA DYOR

Everyone Just Wants to Short to BeLongPlease provide a meaningful and detailed description of your analysis and prediction.
I closed my eyes and focused on the heart of the coins. They whispered to me a secret I haven't heard since. The wind whistles by the trees. My portfolio speaks to me in ways I cannot describe. A tear in my eye not from a grain of sand but a grain of eye opening truth. The place is here. The time is now.
It's time for all of us to belong.


Huge market volatility could be loomingHuge market volatility could be looming...
COINBASE:BTCUSD
COINBASE:ETHUSD
BITFINEX:BTCUSDSHORTS
BITFINEX:BTCUSDLONGS
Top 69 BTC whales only bought about 7000 BTC despite over 30,745 BTC leaving exchanges on 3/11.
I also notice this big order (30745 BTC) splits into multiple smaller orders (98 BTC) subsequently, and "BTCUSDSHORTS" in Bitfinex exchange rising fast (The vertical black line represents that more than 10,000 BTC flowed out of the exchanges).
There are 3 possibilities:
1. OTC or it could be an internal transfer of exchanges (Neutral)
2. Actual market demand (Bull market: Supply squeeze)
3. Whale's trick that will cause wild swings in the market (Wash the market: Short-squeeze and Long-squeeze)
Please be aware of possible events: Short-squeeze and Long-squeeze, that is huge market volatility could be looming.
Addition, keep the eye on "Exchange Netflow" to monitor whether these small orders (98 BTC) returned to the exchanges quickly.
----------------------------------
Analyst of cryptocurrency Yu-Shiuan Chen (CQ & Tradingview Taiwan)

Double top on btc shortsDouble tops or "M"s usually mean dumpy times. If this is the case for btc shorts, it could indicate that btc will pump from liquidating the shorts. Or pump *to* liquidate the shorts. Just a thought.

BTCUSDTIf we look at the Bitcoin chart with the closing price, we see such an Elliott pattern. The price appears to be at the end of wave 2 or B (in a triangle pattern). If this pattern is approved then I expect the price to reach around $ 50,000. Of course at least!!!
