Analysis of Bitcoin Market StrategyTechnical Analysis of Bitcoin (BTC) Contracts: In terms of today's market, the daily chart of the large cycle closed with a small bullish candle yesterday. The K-line pattern shows consecutive upward movements, with the price above the moving averages. The attached indicators are in a golden cross, indicating an obvious upward trend in the long term. However, the current upward momentum and sustainability are relatively weak. Therefore, it is recommended to maintain short-term trading and strictly control risks.
In the short-term hourly chart, the overall price has been consolidating at high levels. The current K-line pattern is in consecutive bullish candles, with the price above the moving averages, and the attached indicators are in a golden cross. Therefore, an upward movement is highly probable today, with the support level near the 106,300 area.
you are currently struggling with losses,or are unsure which of the numerous trading strategies to follow,You have the option to join our VIP program. I will assist you and provide you with accurate trading signals, enabling you to navigate the financial markets with greater confidence and potentially achieve optimal trading results.
Trading Strategy:
buy@106300-106500
TP:108000-108500
BTCUSDT.3L trade ideas

2/1/15I promised to update the idea of what will happen with the graph in the future. At 22 cm, we should now fall down.

BTC TRrade Plan 08/06/2025Dear Traders,
📊 BTC/USDT 4H Analysis – June 8, 2025
Bitcoin is currently testing the upper boundary of a descending wedge pattern. We are monitoring two main bullish scenarios:
🔹 ALT 1: If the price breaks above the wedge resistance and holds, a continuation towards the $115,000–$120,000 zone is likely. This would confirm the breakout and a potential new bullish leg.
🔹 ALT 2: In case of a rejection from the current resistance, we expect a retracement toward the demand zone around $100,000–$101,600. If price action remains bullish in this zone, this could be a strong re-entry point for long positions.
🟥 Invalidation: A confirmed breakdown and consolidation below $100,000 would invalidate the bullish outlook and open the door to deeper corrections.
⚠️ Wait for confirmation and observe price action in key zones before entering any trades.
if you enjoyed this forecast, please show your support with a like and comment. Your feedback is what drives me to keep creating valuable content."
Regards,
Alireza!

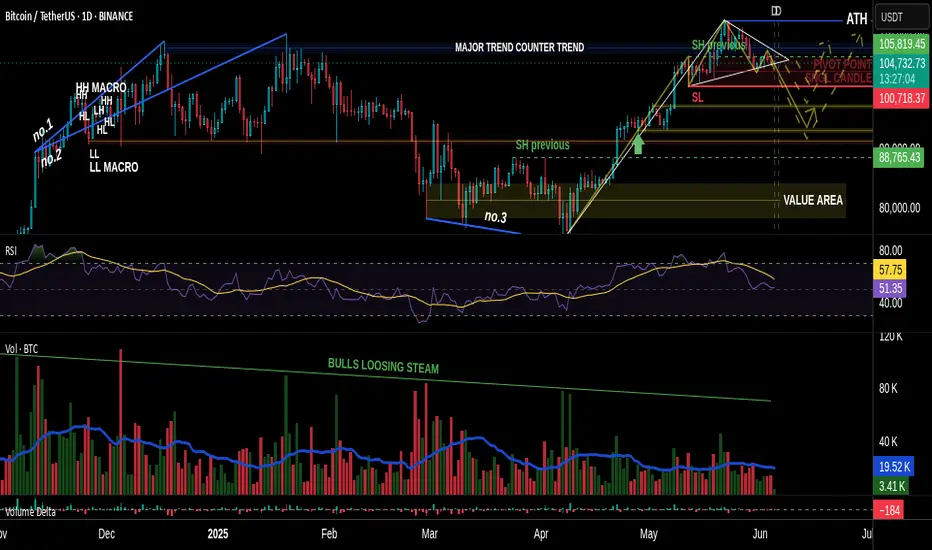
VSA vs BTC: Into a Bearish Scenario or Not?Predicting the market requires skill.
Most traders fail at one crucial point: they don’t see the market as a living, breathing organism—a structure where one move leads to another, like cause and effect in motion.
That’s what we often call reading the psychology of the market. When you begin to grasp the fundamental principles behind that, you step into the realm of elite traders.
And yes—Volume Spread Analysis (VSA) is a powerful tool, but only if you know how to read it properly.
I’m not a certified trader or financial advisor, and I don’t give signals, entries, or exits. I’m simply a solo observer, sharing a slice of what true technical and fundamental analysis looks like.
And yes—it takes time. It takes skills. Now, if we want to even attempt predicting the future of price action, we must understand something: A chart is not a single truth. It’s a battlefield of conflicting signals.
Patterns, marks, levels—some suggest bullish continuation, others hint at sharp reversals. Confusion is inevitable if you don’t learn to distinguish which signs matter.
In our current BTC chart, we’re witnessing this contradiction unfold clearly:
• A bullish flag formation...
• Yet within it, the emerging completion of a Head & Shoulders pattern!
How arrogant can the market be! 😄
A moment to laugh—but also a moment to observe how cleverly the crowd is misled.
This is classic manipulation, wrapped in a textbook setup.
But what’s most telling isn’t the pattern on the surface—it’s the volume beneath the structure.
It’s always the quiet details that speak the loudest.
Before price shows its true face, volume often leaves footprints. In our case, those footprints were already leading toward a bearish path—long before the structure began to shape itself clearly.
So while retail eyes focused on the bullish flag, the underlying volume had already begun withdrawing support.
Not aggressively—no. Subtly, almost elegantly, in that familiar way institutions mask intention:
• Spikes that don’t hold
• Buying that doesn’t follow through
• And a steady fade in commitment as price climbs into weakness
It’s in those quiet inconsistencies where VSA earns its value.
It tells us: the move isn’t about what’s obvious.
It’s about what never fully materialized.
So yes, the pattern may still remain incomplete. The Head & Shoulders may yet fail to validate.
But for those who were watching volume first—not structure—the script was already being written.
✒️ From now on, professionally speaking, we must still wait:
• For the Head & Shoulders to confirm or dissolve. So eyes targeted at the swing low level near 107k
• And for volume to either legitimize or invalidate the entire setup
Only then does the chart grant us permission to speak in certainties.
🐾 But so far…
• The clues have favored the bears.
• Sell opportunities appeared early and often—for those who know what to look for.
• Bullish spikes in volume? They were met with silence.
• Momentum fizzled under a macro backdrop of fading demand.
If you were in the right mindset, and aligned even the lower timeframes to basic structural zones,
you already saw the path ahead wasn’t being carved by the bulls.
Let them finish the patterns.
Let the candles paint the story.
But for those trained in volume, the ink has already dried.
And if you're still reading, maybe you already sense it—
real insight doesn’t shout, and it never floats in abundance.
Value has never been about noise. It’s about what’s rare, quiet, and overlooked by the crowd.
Just like in the markets—the true signals aren’t loud, and they’re never free in the economic sense.
Just as price rises where supply thins, the same applies here:
what’s scarce... holds weight.
PS For last A little exercise, something to grasp on. Have you noticed how Volume & RSI behaves in lower time frames? 4Hour or 1Hour for example. Can you identify how volume confirms a bearish move. Do you discover the correct correlation and combined use between VSA & RSI. Remember my previous insight
See you next time!
BTC next bull runBTC is expected to undergo a short-term retracement before reigniting its bullish momentum and advancing toward new highs

Forecast for BTC. New ATH on July ? In my opinion , BTC have 2 scenario .
1. Price will retest area 104-106k and retest previous ATH and then go up
2. Price will retest area 98-104k and retest previous ATH and then go up
3. In my opinion , BTC will not go down below 100k .
Now BTC can make a bullish flag pattern , but not valid yet
But anything can happen , so DYOR

bearish engulfing candleA bearish engulfing candle is a two-candlestick pattern in technical analysis that suggests a potential reversal of an uptrend to a downtrend. It consists of a small bullish (white or green) candlestick followed by a larger bearish (black or red) candlestick that completely engulfs the body of the first candle. This pattern indicates a shift in market sentiment, with selling pressure overpowering buying pressure and potentially leading to lower prices.

Title: BTC at the Upper Trendline – Breakout or Breakdown IncomiTechnical Analysis (4‑Hour Timeframe)
🔺 Upper Trendline Resistance: BTC is touching the upper line of a descending channel—firm resistance around 107.5k–108k.
📉 Bearish Pressure: Failing to break out here could trigger a downward move.
🔻 Key Support: A decisive break below 99.5k–100k opens the path to 98k–95k, and potentially down to 92k if trend weakness persists
🔺 Bullish Scenario: If BTC closes above 108k on 4h, it could rally toward 110k–112k
binance.com investopedia.com binance.com
.
Geopolitical volatility (U.S.–Iran/Israel tensions) drove BTC briefly below 99k, low of 98.2k, before bouncing back near 101.2k
Volume & momentum: RSI dropped with the dip; watching volume near critical levels like 107k–108k is key


BTC midterm plan possibility
The current Bitcoin chart shows a P.O.3 pattern formation. Looking at the price targets, we can see a clear path to $100,000, which stands as a major psychological price level. The ongoing A-B-C pattern structure supports this price movement. If Bitcoin successfully breaks through the $100k level, we could potentially see an extension to around $120,000. After January, there's a strong possibility of a bullish trend that could help reach these targets, though this remains speculative and uncertain. Market movements depend on various factors, so always do your own research before making any investment decisions.This is one of the scenarios.Other way is going beyond 85k strongly and make pull back or continuation pattern (sideways)after that reach 100k.

BTC at Decision Point: Symmetrical Triangle Breakout Incoming ??BTC is now trading within a symmetrical triangle, bouncing strongly from the trendline support at $98,898, and now faces overhead resistance of around $106,000.
Price is moving between higher lows and lower highs; a breakout in either direction could trigger a significant move.
Key Levels:
Support Zones:
$101,409 – Near-term support
$98,898 – Strong ascending trendline support
$93,343 – Critical structure base
Resistance Zones:
$105,807 – Immediate ceiling
$106,057 – Triangle breakout point
$108,895 – First major upside target
$111,785 – Higher target if bulls take control
Analysis:
The structure shows clear compression, and BTC has already made a sharp bounce off the lower range, suggesting bulls are stepping in. However, a clean breakout above $106K is needed to confirm the momentum shift.
A breakout above this triangle could lead to a fast move toward $111K, while failure could send the price back toward $101K or even lower.
This is a make-or-break zone.
DYOR | Not Financial Advice

BTC\USD SHORT TRADE SETUP BTC/USDT – Short Trade Setup Breakdown (Technical Outlook
Trade Thesis
The area between 103,800–105,000 serves as a strong supply zone, and we’re seeing signs of exhaustion in bullish momentum. The setup suggests a high-probability short opportunity with tight confirmation.
🔸 Entry: Positioned at 103,800, just below resistance, to capture early weakness and avoid chasing.
🔸 Risk Level: The resistance at 105,000 is critical — any break and close above may invalidate this setup.
🔸 Targets:
🎯 Target 1: 97,000 – conservative exit at mid-range demand zone
🎯 Target 2: 96,000 – full target near bottom of the descending channel

Bitcoin Overall: Likely Short to SupportI think bitcoin will likely find resistance at the current range, or slightly higher, and move down in a stepwise fashion to the indicated supports in the near future.

Bitcoin Offensive plan for S/R, risk-on scenario confirmed__________________________________________________________________________________
Technical Overview – Summary Points
__________________________________________________________________________________
Momentum : Strong across all timeframes, driven by the Risk On / Risk Off Indicator (“Strong Buy” bias from 1D to 1H).
Key Supports : 98–100k remains the crucial zone to defend. Interim supports at 103.6k and 106k.
Major Resistances : 107–110k critical cluster, intermediate resistance at 108.2k.
Volume : Normal to moderately increasing volumes on all timeframes, short-term spike at 15min (caution warranted).
Multi-TF behavior : No signs of euphoria or capitulation except for 15min (behavioral overheating & high volume detected).
__________________________________________________________________________________
Strategic Summary
__________________________________________________________________________________
Structural bias : Strong bullish, confirmed by technical and sector data.
Opportunities : Pullback entries at 107–107.5k, trend-following plans on validated breakouts >108.2k/109.9k.
Risk zone : Major break under 106k then 103.6k = invalidation, watch for seller excess (ISPD)/extreme volume on 15min.
Macro catalyst : No major event expected; wait & see climate, caution around Middle East geopolitical headlines.
Action plan : Buy support, monitor breakout/volume, stop-loss below 106k then 99k.
__________________________________________________________________________________
Multi-Timeframe Analysis
__________________________________________________________________________________
1D – 12H – 6H : Durable bullish structure, price capped below 107–110k, momentum confirmed by Risk On / Risk Off Indicator (“Strong Buy”), no volume climax, healthy volume. 98–100k supports remain crucial.
4H – 2H – 1H – 30min : Aligned uptrend, no sell signals. Pullbacks absorbed at 103.6–107.5k pivots. 108.2k–109.9k breakout is pivotal, volumes healthy outside 15min.
15min : Emerging behavioral excess (ISPD = Sell), very high volume → risk of short-term overheat, avoid chasing without validation.
Summary : Bullish multi-timeframe confluence, but caution on ultra-short-term excess and geopolitical news flow.
__________________________________________________________________________________
Synthesis & Strategic Plan
__________________________________________________________________________________
Directional bias : Structurally bullish on all higher TFs, supported by Risk On / Risk Off Indicator, MTFTI, no major alert signals.
Action scenarios :
Buy pullback at 107–107.5k, SL below 106k (Swings) or below 107k (Scalps).
Confirmed breakout (vol./no behavioral excess) above 108.2–109.9k, targets >110k.
Risk/invalidation : Any break under 106k then 103.6k then 99k = bullish bias neutralized.
Risk management : Take partial profits on 109–110k extensions; avoid persistence if ISPD turns red & volumes spike on lower TFs.
Fundamental & on-chain factors : No macro catalyst, healthy consolidation, $99k–$100k on-chain supports decisive, breakout requires new inflows.
Decision summary:
Bias = Bullish, buy supports and validate breakouts with volume, watch for 15min excess and Middle East headlines. Strict SL below 106k/103.6k, risk-off below 99k. Partial profit taking on 109–110k extension. No immediate macro catalyst.

LONG BTC TILL 129,000Hi, I am expecting BTC to continue its uptrend with little fluctuations till 129K. Can go more till 140K but would be needing confirmation before we long again.
DISCLAIMER: ALL MY SHARED IDEAS ARE ONLY FOR EDUCATIONAL PURPOSES. I AM NOT RESPONSIBLE FOR YOUR ANY PROFIT OR LOSS.


Lower highs / lower lows BTC....what will happen next?History doesn't repeat itself, but it certainly rhymes. Let's look at the BTC chart: lower highs, lower lows from double top. What have we seen in the past -> significant drops. Personally, I'm all for innovation and technology, but make no mistake that institutions are not blindly buying at the top and BTC is veering away from it's core principles after the financial crisis (there's still a middle man!). With this level of volatility and automated trading, there is bound to be a major pull back and it's starting to crack. Economic numbers are not horrible, but they are "lagging." Unemployment is not great with more layoffs being announced every day, interest rates are still high, unsecured debt is ultra high, and affordability is at 30-40 year low. Don't let the champagne effect of S&P fool you, things are NOT rosy!
Always do your own due diligence and all the best!

BTC - Key Level Being TestedRight now BTC is fighting a pivotal level in its current trend. After falling slightly below the $100k level price has seen a strong uptick after a 4H reversal doji was created at the bottom of the trend.
Now price is at the $105k level which has shown lots of volume with flips between support and resistance. What we are watching for now is our red "Upper Resistance Trendline". The level is currently around $109k.
If we see a rejection of that level then it would show the bears are still in control and the momentum to the downside will continue. If we can close candles above the red trendline we could see a swift move back to our white trendline and a break of that could see a strong surge to new all time highs.
If we see the current uptrend start to fade and price close below our 0.236 fib that could be an early indication of lower levels needing to be tested. If we do start to fall rapidly the most important level to hold to keep the macro uptrend intact is the 0.618 fib level. Currently this level is around $88k and if that level would be flipped into new support it would be the best level to create a macro higher low.

Bit coin buy for long term.It is very break out to almost double. The profit booking will be update when it reaches target.

DeGRAM | BTCUSD once again trading above $105k📊 Technical Analysis
● Fresh bounce off the confluence of the 8-month up-sloping purple trend-line and 102-103 k green demand box prints a higher-low inside the rising wedge, keeping bulls in control despite June’s pull-back.
● Price is reclaiming the minor down-trend line from the 12 Jun high; a daily close above 106 k confirms a bear-trap and unlocks the 111.8-112.5 k supply at the wedge cap.
💡 Fundamental Analysis
● Spot-ETF desks absorbed >5 400 BTC in the last three sessions while exchange reserves fell to a four-year low, signalling supply drain.
● Cooling US PCE expectations trimmed real yields, and Mt Gox repayment delays ease overhang fears—both supportive for risk assets.
✨ Summary
Long 102–104 k; hold above 106 k targets 111.8 k → 115 k. Bull thesis void on a 16 h close below 99 k.
-------------------
Share your opinion in the comments and support the idea with a like. Thanks for your support!

Bitcoin BTC Pullback Strategy: How I’m Planning My Next EntryI’m currently watching BTCUSDT 👀. Yesterday, we saw a bullish break of structure 🔼, and my bias is to follow that momentum moving forward 📈. Right now, price is overextended 📊, so I’m looking for a retracement into equilibrium, ideally around the 50–61.8% Fibonacci zone 📏.
If price pulls back into that range and holds above the bullish imbalance (discussed in the video) 🧱, I’ll be watching for a long opportunity 🎯. My targets are set at the previous highs and the Fibonacci extension levels 🔝.
⚠️ Disclaimer
This is not financial advice. Trading involves risk, and you should only trade with capital you can afford to lose. Always do your own analysis or consult a qualified financial advisor.

Bitcoin Crash Will Continue to Levels that will REKT majority!??MARKETSCOM:BITCOIN crashed towards $98k so far! Almost 10% drop so far! Crypto noobs and mass media manipulators will blame this CRYPTOCAP:BTC crash on the Iran and Israel conflict! Professional traders will, however, tell you that this was orchestrated and the crash was already planned beforehand, and the best traders caught the crash from the top at $109k and made a profit on this Bitcoin correction! Professional insider trading against news manipulation, artificial conflicts, and emotional trading !

BTC is breaking out of a falling channel 🚀
Bitcoin has pushed strongly off the lower boundary and is approaching the top of a descending parallel channel on the daily chart 📈
A confirmed breakout could lead to a continuation rally toward key upside targets ✈️
🎯 Targets:
1️⃣ $111,233.01
2️⃣ $114,942.31
3️⃣ $118,490.33
