Final move by the bears? Bulls lining up for ATHHi traders and investors!
Buyers have reached the first target at 108,952.
On Binance spot, BTC missed the second target (110,530.17) by just 99 cents.
Is this a setup for a breakout and a run toward a new ATH?
So far, the price action looks like a level manipulation around 108,952: volume in all 3 bars interacting with this level is concentrated above it.
Just below lies a buyer zone (107,500 – 105,100).
I am watching for buyer reaction once the price reaches this area.
This analysis is based on the Initiative Analysis concept (IA).
Wishing you profitable trades!
BTCUSDT.3L trade ideas

BTC - Bullish retest to ATH?Made a composite profile of that little range we had last week.
We took out the lower npoc, then took out the higher npoc and the internal equal highs (which was the only short I see for now)
I'm looking for 107.2-3 to get a bullish reaction, long from there into a clean-up of the 112k highs.
If the July 2nd lows don't hold, I'd look for the 101k npoc, or maybe a frontrun of that at the imbalance fill around 103k.

BTCUSDTBitcoin has two paths: if it stabilizes above 111,800, it can go to the target of 144,540, but if this move is a fake break, it can go to the targets of 91,410 and even 85,662, but it is expected to fall and then move.

Bitcoin - Rejection From Major Resistance, Eyes on 103.8K SupporBitcoin is once again reacting to a major resistance zone around 108.8K, a level that has consistently rejected price in the past. The market attempted a breakout but failed to sustain momentum, forming multiple wicks and signs of weakness near the highs. This repeated rejection suggests that sellers are still in control up here and that this zone remains a strong ceiling for price.
Immediate Downside Scenario
With bearish pressure building at resistance, price is now pulling back and eyeing the first key support level around 103.8K. This zone previously acted as a significant base, with an imbalance overlap and structural demand from past price action. If price taps into this zone and buyers defend it, we could see a recovery bounce and potentially another retest of the upper resistance.
Breakdown Risk and Bearish Expansion
However, if 103.8K fails to hold, this opens the door for a deeper correction. The next logical downside target would be in the 98K region, where a higher timeframe imbalance sits and where price last found strong demand during the last major push up. This would also align with a full sweep of recent liquidity build-ups below.
Bullish Recovery Path
In the bullish case, holding 103.8K could initiate a rebound back toward the 108.8K resistance. This would likely depend on a solid reaction and displacement from the support zone, potentially forming a new higher low structure. For bulls to regain full control, we would need to see a clean breakout above the resistance zone with continuation.
Key Zones to Watch
The red resistance zone near 108.8K remains the clear invalidation for further upside, while the grey support block around 103.8K is the first major level that could decide the short-term trend. If that breaks, the purple demand zone near 98K is a high-probability area for price to find support again.
Conclusion
Bitcoin is still stuck between a strong resistance ceiling and a critical mid-range support zone. The rejection from the top signals that we may see downside in the near term, but whether this turns into a full reversal or just a retracement depends entirely on how price reacts around 103.8K. Hold it and we bounce, break it and we likely drop toward 98K. Keep watching how price behaves at these levels to gauge momentum and direction.
___________________________________
Thanks for your support!
If you found this idea helpful or learned something new, drop a like 👍 and leave a comment, I’d love to hear your thoughts! 🚀


Understanding SFP In Trading1. What is a Swing Failure Pattern (SFP)?
A Swing Failure Pattern (SFP) occurs when the price temporarily breaks a key swing high or low but fails to continue in that direction, leading to a sharp reversal.
This pattern is often driven by liquidity grabs, where price manipulates traders into taking positions before reversing against them.
An SFP typically consists of:
A false breakout beyond a previous swing high/low.
A sharp rejection back within the prior range.
A liquidity grab, triggering stop-loss orders and fueling a reversal.
SFPs provide powerful trade opportunities, signaling potential reversals and the exhaustion of trends.
2. Understanding Liquidity Grabs & Stop Hunts
The financial markets are structured around liquidity. Large institutions and algorithmic traders require liquidity to execute their large orders efficiently.
One way they achieve this is by triggering liquidity grabs and stop hunts.
Liquidity Grab:
Occurs when price moves beyond a key level (e.g., swing high/low), activating orders from breakout traders and stop-losses of trapped traders.
Smart money absorbs this liquidity before pushing the price in the opposite direction.
Stop Hunt:
A deliberate price movement designed to trigger stop-loss orders of retail traders before reversing.
Often seen near major support and resistance levels.
These events are crucial for understanding SFPs because they explain why false breakouts occur before significant reversals.
3. Why Smart Money Uses SFPs
Institutions, market makers, and algorithmic traders use SFPs to:
Fill large orders: By grabbing liquidity at key levels, they ensure they can enter large positions without causing excessive price slippage.
Manipulate retail traders: Many retail traders place stop-losses at obvious swing points. Smart money exploits this by pushing the price beyond these levels before reversing.
Create optimal trade entries: SFPs often align with high-probability reversal zones, allowing smart money to enter positions at better prices.
Understanding how institutions operate gives traders an edge in identifying manipulative moves before major price reversals.
4. Market Structure & SFPs
Market structure is built upon a series of swing highs and swing lows. Identifying these key points is crucial because they represent areas where liquidity accumulates and where price is likely to react.
Swing High (SH): A peak where price makes a temporary high before reversing downward.
Swing Low (SL): A trough where price makes a temporary low before reversing upward.
Types of Swing Points in Market Structure
Higher Highs (HH) & Higher Lows (HL) – Bullish Trend
Lower Highs (LH) & Lower Lows (LL) – Bearish Trend
Equal Highs & Equal Lows – Range-Bound Market
5. Liquidity Pools: Where Traders Get Trapped
Liquidity pools refer to areas where traders' stop-loss orders, pending orders, and breakout entries accumulate. Smart money uses these liquidity zones to execute large orders.
Common Liquidity Pool Zones:
Above swing highs: Retail traders place breakout buy orders and stop-losses here.
Below swing lows: Stop-losses of long positions and breakout sell orders accumulate.
Trendline & Range Liquidity:
Multiple touches of a trendline encourage traders to enter positions based on trendline support/resistance.
Smart money may engineer a fake breakout before reversing price.
6. Identifying Bullish SFPs
SFPs can occur in both bullish and bearish market conditions. The key is to identify when a liquidity grab has occurred and whether the rejection is strong enough to confirm a reversal.
Bullish SFP (Swing Low Failure in a Downtrend)
Price sweeps a key low, triggering stop-losses of long traders.
A strong rejection wick forms, pushing price back above the previous low.
A shift in order flow (bullish market structure) confirms a potential reversal.
Traders look for bullish confirmation, such as a higher low forming after the SFP.
Best bullish SFP setups occur:
At strong support levels
Below previous swing lows with high liquidity
After a liquidity grab with momentum confirmation
7. Identifying Bearish SFPs
Bearish SFP (Swing High Failure in an Uptrend)
Price takes out a key high, triggering stop-losses of short traders.
A sharp rejection forms, pushing the price back below the previous high.
A bearish shift in order flow confirms downside continuation.
Traders look for bearish confirmation, such as a lower high forming after the SFP.
Best bearish SFP setups occur:
At strong resistance levels
Above previous swing highs where liquidity is concentrated
With clear rejection wicks and momentum shift
8. How SFPs Signal Reversals
SFPs provide early warning signs of trend reversals because they expose areas where liquidity has been exhausted.
Once liquidity is taken and the price fails to continue in that direction, it often results in a strong reversal.
Key Signs of a Strong SFP Reversal
Long wick rejection (indicating absorption of liquidity).
Close back inside the previous range (invalidating the breakout).
Increased volume on the rejection candle (confirming institutional activity).
Break of short-term market structure (trend shifting).
Divergences with indicators (e.g., RSI divergence at the SFP).
9. Identifying High-Probability SFPs
One of the most critical aspects of a valid SFP is how the price reacts after a liquidity grab. The candle’s wick and close determine whether an SFP is strong or weak.
A. Wick Rejections & Candle Closes
Key Features of a Strong SFP Wick Rejection
Long wick beyond a key swing high/low (indicating a liquidity grab).
Candle closes back inside the previous range (invalidating the breakout).
Engulfing or pin bar-like structure (showing aggressive rejection).
Minimal body size relative to wick length (e.g., wick is 2–3x the body).
Bullish SFP (Swing Low Failure)
Price sweeps below a key low, triggering stop-losses of buyers.
A long wick forms below the low, but the candle closes back above the level.
This signals that smart money absorbed liquidity and rejected lower prices.
Best bullish SFPs occur at major support zones, previous swing lows, or untested demand areas.
Bearish SFP (Swing High Failure)
Price sweeps above a key high, triggering stop-losses of short sellers.
A long wick forms above the high, but the candle closes back inside the range.
This signals that smart money absorbed liquidity and rejected higher prices.
Best bearish SFPs occur at resistance levels, previous swing highs, or untested supply areas.
❌ Weak SFPs (Avoid These)
❌ Wick is too small, meaning the liquidity grab wasn’t significant.
❌ Candle closes above the swing high (for a bearish SFP) or below the swing low (for a bullish SFP).
❌ Lack of strong momentum after rejection.
B. Volume Confirmation in SFPs
Volume plays a crucial role in validating an SFP. Institutional traders execute large orders during liquidity grabs, which often results in spikes in trading volume.
How to Use Volume for SFP Confirmation
High volume on the rejection wick → Indicates smart money absorption.
Low volume on the breakout move → Suggests a lack of real buying/selling pressure.
Increasing volume after rejection → Confirms a strong reversal.
Spotting Fake SFPs Using Volume
If volume is high on the breakout but low on the rejection wick, the move may continue trending rather than reversing.
If volume remains low overall, it suggests weak market participation and a higher chance of chop or consolidation instead of a clean reversal.
Best tools for volume analysis:
Volume Profile (VPVR)
Relative Volume (RVOL)
Footprint Charts
10. Key Takeaways
SFPs are Liquidity Grabs – Price temporarily breaks a key high/low, triggers stop losses, and then reverses, signaling smart money absorption.
Wick Rejection & Close Matter – A strong SFP has a long wick beyond a swing point but closes back inside the range, invalidating the breakout.
Volume Confirms Validity – High volume on rejection wicks indicates smart money involvement, while low-volume breakouts often fail.
Higher Timeframes = Stronger SFPs – 1H, 4H, and Daily SFPs are more reliable than lower timeframe setups, reducing false signals.
Confluence Increases Probability – SFPs are most effective when aligned with order blocks, imbalances (FVGs), and major liquidity zones.
Optimal Entry Methods Vary – Aggressive entries capitalize on immediate rejection, while confirmation and retracement entries improve accuracy.
Proper Stop Loss Placement Prevents Fakeouts – Placing SL just beyond the rejection wick or using structure-based stops reduces premature exits.
Take Profit at Key Liquidity Levels – Secure profits at previous swing highs/lows, order blocks, or imbalance zones to maximize returns.

BTC: A Classic Cup & Handle in Play!Bitcoin has formed a classic cup and handle pattern on the daily chart, with the 100 EMA providing solid support during the handle formation. Currently, the price is consolidating in what appears to be a bullish flag or extended handle, just below the key resistance zone around $109K. A breakout above this level could ignite a strong bullish rally toward higher targets like $144k.
Key Highlights:
-Cup & Handle pattern confirmed
-10 EMA acting as dynamic support
-Bullish flag/handle forming near resistance
- A breakout could lead to explosive upside
Regards
Hexa
CRYPTOCAP:BTC BITSTAMP:BTCUSD
BTC BIG SHORT!We did a mirror retest, and many other signals also point to a sharp decline, indicating numerological codes 69/96.

BTCUSDT – Accumulation Confirmed? Wyckoff Blueprint Playing Out Bitcoin continues to compress inside a defined range, resting above both a rising trendline and a former resistance turned support zone. This structure fits cleanly within a Wyckoff-style Accumulation Phase (B-C).
We’re now at a critical moment where smart money may be absorbing supply, preparing for the next phase.
🔍 Key Observations:
Range-bound price action with higher lows and muted volume
Spring-like wick and recovery from the bottom of the range
Support holding at prior breakout zone and ascending trendline
Structure shows signs of stealth accumulation with a possible breakout ahead
Sideways movement with fading volatility
Gradual compression within the range
Strong support defended multiple times (might make the support weaker as well !)
A potential spring/retest event may already be in play
You’ll see fakeouts, wicks, and hesitation in this phase — designed to trap weak hands. But the underlying behavior points to preparation, not distribution.
The quiet before the markup. Let the market reveal its hand. 📈

BTC weekly price predictionthis is my personal idea and analysis and i dont follow any other one analysis

BTC/USDT 4H – High-Probability Decision Point Ahead Bitcoin is currently retesting a confluence-rich zone — a textbook decision area where structure meets sentiment.
🔻 What’s in play?
🟥 Demand Zone / Bullish Order Block / Breaker Block (visible on 1H)
📈 Third-touch test of the ascending trendline – statistically known to trigger strong moves
⚪ Price sitting just above the 200 EMA acting as dynamic support
🧱 Prior resistance flipped to support — now being validated again
Despite the correction, structure remains intact. This is a healthy retracement unless price starts closing below trendline + zone with volume.
🔀 Possible Outcomes:
Bounce: If buyers step in here, this could mark the next leg in the uptrend.
Breakdown: A strong close below the zone/trendline could shift structure and sentiment bearish.
⚠️ No trade bias here — let price show its hand.
💬 What’s your view — bounce or break? Comment below!
✍️ Chart marked with structure logic only — not financial advice.

BTCUSDT: Trend in 2H time frameThe color levels are very accurate levels of support and resistance in different time frames.
A strong move requires a correction to major support and we have to wait for their reaction in these areas.
So, Please pay special attention to the very accurate trend, colored levels, and you must know that SETUP is very sensitive.
BEST,
MT

BITCOIN FLASHING EARLY BEARISH SIGNALS!!! (Don’t get trapped) I am explaining why Bitcoin might start crashing towards $93k. If we get enough confirmations, amazing RR short opportunities might be great money-making machines !!!

Check if price can hold above M-Signal indicator on 1D chart
Hello, traders.
If you "Follow", you can always get new information quickly.
Have a nice day today.
-------------------------------------
I failed to register a modified indicator of StochRSI indicator on TradingView alone, so I added it to the existing OBV by readCrypto indicator.
From the top of the indicator setting window to the bottom
1. OBV indicator of Low Line ~ High Line channel
2. PVT-MACD oscillator indicator
3. StochRSI indicator
They are registered in the order above.
Since the values used are all different, you should activate and use one indicator.
Please check the chart above.
------------------------------------------
(BTCUSDT 1D chart)
It is showing a downward trend as it failed to rise above the HA-High indicator (108316.90) on the 1D chart.
It is currently checking whether there is support near 107340.58, which is the StochRSI 50 indicator point.
If it fails to receive support and falls, it is expected to fall to around 104463.99.
The 104463.99 point is the DOM (60) indicator point of the 1W chart, which corresponds to the end of the high point on the 1W chart.
Since the StochRSI 20 indicator point is formed near the 104463.99 point, its importance can be considered high.
-
Since the M-Signal indicator of the 1D chart is passing near 106133.74, there is a possibility of volatility when touching this area.
Since the volatility period begins around July 2 (July 1-3), it is necessary to keep an eye on the current movement.
-
However, the key is to buy near the HA-Low indicator and sell near the HA-High indicator, so the current movement may be natural.
This volatility period is expected to last until around July 10 (July 9-11), so be careful when trading to avoid being fooled by fakes.
----------------------------------------
- The StochRSI indicator is showing signs of transitioning to a state where K < D.
- The PVT-MACD oscillator indicator is showing signs of decline.
- The OBV indicator of the Low Line ~ High Line channel is showing signs of decline in the High Line.
Therefore, if you look at the indicators, they are showing signs of decline overall.
However, if the OBV rises above the High Line, the price will show signs of rise.
Therefore, we need to observe the movements of the indicators while checking whether there is support at the StochRSI 50 indicator point.
Basically, the time to make a purchase is when it shows support near the DOM (-60) ~ HA-Low indicator.
If you want to make a purchase outside of that, you should not forget that a short and quick response is required.
The indicators that tell you the high point are HA-High, DOM(60) indicators.
In addition, there are StochRSI 80 and StochRSI 20 indicators that require quick response.
-
Thank you for reading to the end.
I wish you successful trading.
--------------------------------------------------
- Here is an explanation of the big picture.
(3-year bull market, 1-year bear market pattern)
I will explain the details again when the bear market starts.
------------------------------------------------------

Skeptic | Bitcoin Deep Dive: Rate Hikes, War Tensions & TriggersInterest Rates: The Big Picture
Let’s start with the Federal Reserve’s move—interest rates jumped from 4.25% to 4.5% . What’s the deal? Higher rates mean costlier borrowing , so businesses and folks pull back on loans. This drains liquidity from risk assets like Bitcoin and SPX 500, slowing their uptrend momentum or pushing them into ranges or dips. Now, mix in the Israel-Iran conflict escalating ? Straight talk: risks are sky-high , so don’t bank on wild rallies anytime soon. My take? BTC’s likely to range between 97,000 and 111,000 for a few months until geopolitical risks cool (like Russia-Ukraine became “normal” for markets) and the Fed starts cutting rates. Those two could ignite new highs and a robust uptrend. Let’s hit the charts for the technicals! 📊
Technical Analysis
Daily Timeframe: Setting the Stage
You might ask, “If 100,000 support breaks, does that mean we’ve formed a lower high and lower low, flipping the trend bearish per Dow Theory?” Absolutely not! Here’s why: our primary uptrend lives on the weekly timeframe, not daily. The daily is just a secondary trend. If 100K cracks, it only turns the secondary trend bearish, leading to a deeper correction, but the major weekly uptrend stays intact.
Spot Strategy: No spot buys for now. Economic and geopolitical risks are too intense. I’ll jump in once things stabilize. 😎
Key Insight: A 100K break isn’t a death sentence for the bull run—it’s just a shakeout. Stay calm!
4-Hour Timeframe: Long & Short Triggers
Zooming into the 4-hour chart, here’s where we hunt for long and short triggers:
Long Trigger: Break above 110,513.92. We need a strong reaction at this level—price could hit it early or late, so stay patient for confirmation.
Short Trigger: Break below 101,421.65. Same vibe—watch for a clean reaction to tweak the trigger for optimal entry.
Pro Tip: These levels are based on past key zones, but time outweighs price. Wait for a reaction to nail the best entry. Patience is your edge! 🙌
Bitcoin Dominance (BTC.D): Altcoin Watch
As BTC dips, BTC.D (Bitcoin’s market share) is climbing, meaning altcoins are taking a bigger beating. Don’t touch altcoin buys until the BTC.D upward trendline breaks. They haven’t moved yet—you might miss the first 10-100%, but with confirmation, we’ll catch the 1,000-5,000% waves together. 😏
Shorting? If you’re shorting, altcoins are juicier than BTC—sharper, cleaner drops with more confidence. Patience, patience, patience—it’s the name of the game.
Final Thoughts
My quieter updates lately? Blame the geopolitical chaos, not me slacking . I’m hustling to keep you in the loop with clear, actionable insights. here, we live by No FOMO, no hype, just reason. Protect your capital—max 1% risk per trade, no exceptions. Want a risk management guide to level up? Drop a comment! If this analysis lit a spark, hit that boost—it keeps me going! 😊 Got a pair or setup you want next? Let me know in the comments. Stay sharp, fam! ✌️

The Pattern That Could Launch Bitcoin, pt. 2There appears to be an IH&S pattern forming inside of the larger IH&S's right shoulder (see my previous post for the larger one). I've seen this happen a few times and then a break out upwards! Results may vary of course lol.
If it drops from here support could be at around $102k and then $100,500.

BTC — Major Resistance & Long TP Zone1. TP longs in red resistance zone (110k–111k)
2. Watch for rejection: possible short setup on bearish reaction
3. Key support at 105k — monitor for bounce
4. If price holds above red zone, scenario invalid — look for breakout

The only plays you need this week! 🚀 Join us as we dive into the highs and lows of Bitcoin this week! 🔥
Opportunities like this don’t show up every day — and we’ve got a strong feeling there’s a 10X trade hiding somewhere in this video! 👀💰
We’re locked in on the charts like eagles 🦅, watching closely to see if any of our setups come to life. You won’t want to miss what’s coming next! 📈📊
✨ Stay tuned for daily updates, smart setups, and sharp moves! ✨
📅 Weekly Schedule:
🛠️ Daily Setups: Monday to Friday
🎓 Class: Every Tuesday (if stars align 🌟 – subject to confirmation)
Let’s make it a big week! 💪🚀

Short BTC, it is about to retrace and test 100000 again!As BTC gradually fell back, the rebound did not stand above 110,000 in the short term, proving that there is strong selling pressure above, and the trend line formed by the technical high point 111,000 and the second high point 110,000 formed an important resistance area, which limited the rebound space of BTC and strengthened the demand for BTC's short-term retracement.
According to the current trend, the short-term oscillation bottom area of 106,000 may be broken at any time. Once it falls below the oscillation area, it may arouse a certain degree of profit-taking chips and stimulate BTC to accelerate its decline. I think BTC will at least test the 105,000-104,000 area again during the retracement, and may even test the 100,000 integer mark again.
Therefore, shorting BTC is still the preferred option for current short-term trading.
Consider shorting BTC in the 108,000-109,000 area, and the target area in the short term is 104,500-103,500. After breaking this area, the target can be extended to 101,000-100,000.
BINANCE:BTCUSDT BINANCE:BTCUSDT BITSTAMP:BTCUSD

Bitcoin Playing Below The Crucial Area, Im Out of The Market🥱 I’ve been active in this market since 2017, and I’ve never seen it this dull and exhausting.
👉 Bitcoin has been ranging around the $110K level for nearly six months now, and once again, it’s trading below a critical resistance level. In my opinion, staying out of the market and just observing is still the best approach.
📥 Trading in such market conditions can be mentally draining, which is why I prefer to stay on the sidelines and simply watch for now
📉 Any rejection from this area could lead to a price drop down to the 95K zone. Although there’s a possibility of a buying pressure up to the 115K level as a shadow, even if this scenario plays out, it won’t change my overall outlook on Bitcoin

MONDAY - TRADE OF THE DAYFew nice plays over the weekend shame I am not active on weekends.
I will be posting a video later today so see you in class!

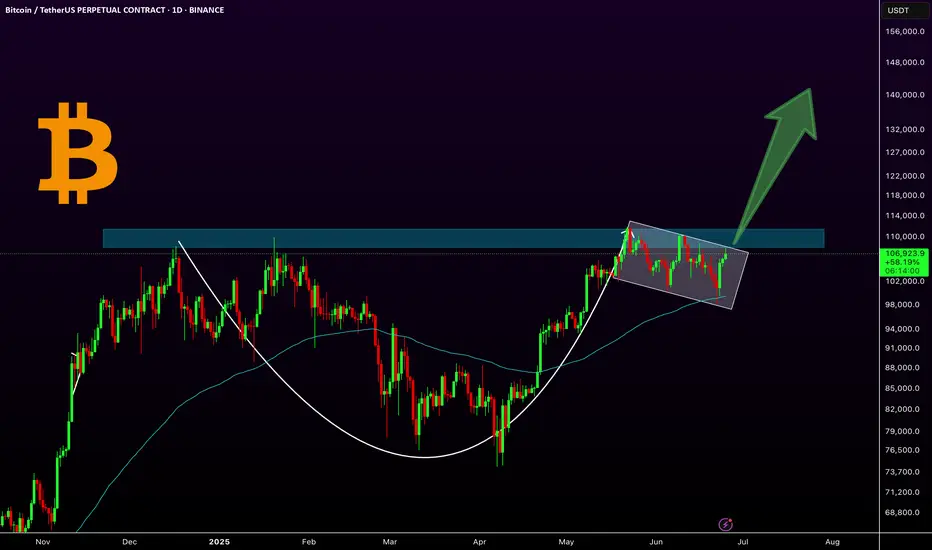
Btcusdt 4hr tf scenarios.Two scenarios: green and red lines.
Green Line: A bounce and sustained recovery above the 100-day and 200-day daily moving averages is bullish.
Red Line: A bounce followed by a lack of momentum and a break below a previous low is bearish.
Long Horizontal Red Line: If the price reaches this area, it could signal the start of a downtrend unless new bullish fundamentals emerge.
My Point of View (POV): I am bearish, primarily due to the ongoing war, similar to the conflict that began between two other countries a year ago.
However, it's important to note that every crisis and recession has historically presented a buying opportunity for institutions and 'whales.' Therefore, be prepared with funds for dollar-cost averaging (DCA), then simply hold and forget. It is recommended to conduct backtesting and research to identify optimal buying areas. DCA is key. Only invest money you can afford to lose.
BTC MTF AccumulationThis is the current accumulation model i am watching to bring BTC back to ATH's and form the second deviation of the HTF distribution model. I would prefer if we could go lower and form a range from there, but at the moment thats all i got.
