BTCUSDT Hello traders.
The BTCUSDT trade I shared the other day played out just as expected, with BTC experiencing a significant drop in value shortly after. The price fell all the way down to the 98K level.
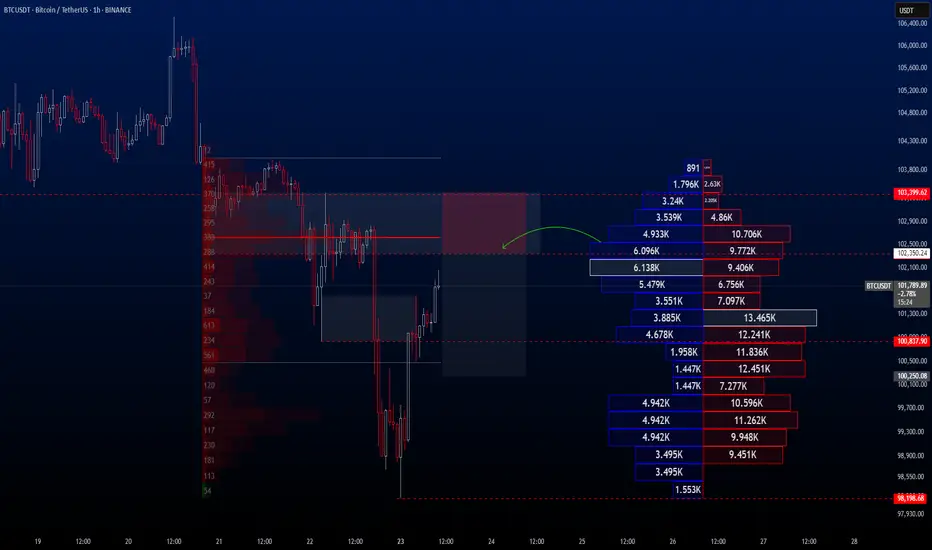
Following this decline, I anticipate a short-term rebound toward the 102K–103K range, after which I expect the downtrend to resume. Therefore, I’ve placed a Sell Limit order at 102,350, and I’m currently waiting for the price to reach that level.
If you'd like, you can consider this opportunity in the same way.
🔍 Trade Details
✔️ Timeframe: 1-Hour
✔️ Risk-to-Reward Ratio: 1:2
✔️ Trade Direction: Sell Limit
✔️ Entry Price: 102,350.24
✔️ Take Profit: 100,250.08
✔️ Stop Loss: 103,399.62
🕒 If the trade doesn’t gain strong momentum, I will keep the position open only until 23:00 (UTC+4) today. Otherwise, I will manually close the trade—either in profit or at a loss—depending on price action.
🔔 Disclaimer: This is not financial advice. I’m simply sharing a trade I’ve taken based on my personal trading system, strictly for educational and illustrative purposes.
📌 Interested in a systematic, data-driven trading approach?
💡 Follow the page and turn on notifications to stay updated on future trade setups and advanced market insights.
BTCUSDT.3L trade ideas
BTCUSDT Short Setup after Weak BreakoutThe BTCUSDT perpetual chart displays a bearish setup following a false breakout or weak retest of a descending wedge structure. After a strong bounce from the recent low, price surged but is now showing rejection at the $101,500 resistance level, marked by a key horizontal zone.
This area coincides with:
- The upper boundary of the falling wedge pattern.
- A former support zone now acting as resistance.
- A red candle signaling exhaustion from buyers.
A short position is initiated with:
- Entry: ~$101,500
- Stop Loss: ~$103,271
- Take Profit: ~$95,400
- Risk:Reward Ratio: ~1:3+
Unless price reclaims and holds above $103,271, this setup suggests a short-term bearish reversal is likely to unfold.

Pullback Correction after a Sharp DeclineTechnical Analysis of BTC Contracts: As of today, on the daily timeframe (major cycle), yesterday closed with a small bearish candle, showing consecutive bearish declines. The price remains below moving averages, and attached indicators are in a death cross, clearly indicating a downward trend. With the trend being evident, two key points should be noted: First, guard against significant pullback corrections; Second, risk control must be prioritized under any circumstances, which is of utmost importance.
On the hourly timeframe (short cycle), the price fell under pressure during the US session yesterday, breaking below the 100,000 level. It rebounded after hitting the intraday low in the morning. The breakdown level is near the 102,700 area. Currently, the K-line shows a large bullish rebound, and attached indicators form a golden cross, suggesting that corrective movements will prevail today. However, the breakdown level (102,700) must not be breached; otherwise, the corrective trend may fail to sustain, which aligns with typical price movement patterns.
you are currently struggling with losses,or are unsure which of the numerous trading strategies to follow,You have the option to join our VIP program. I will assist you and provide you with accurate trading signals, enabling you to navigate the financial markets with greater confidence and potentially achieve optimal trading results.
Trading Strategy:
sell@102300-102800
TP:100000-100500

Bitcoin Under PressureBitcoin remains mired in a bearish trend as price action struggles below key moving averages—the 50-day, 100-day, and 200-day—all of which point to sustained downside pressure. On the higher timeframes, a clear descending trendline from the April–May highs remains firmly intact, reinforcing the macro downtrend.
The Relative Strength Index (RSI) continues to hover in the neutral-to-lower zones, with recent bounces still failing to cross bullish thresholds. A short-term relief rally emerged post-news volatility, with price attempting to retest the supply zone between $103.9K and $104K—a region of confluence with bearish Fibonacci levels and previous order blocks.
However, rejection at this level could set the stage for a further breakdown, targeting the $96.3K–$95.5K range. In the 1-hour and 4-hour timeframes, Fibonacci retracements and a climbing RSI suggest short-term relief is plausible, but a lower high formation would confirm continued bearish control.
BTC remains technically vulnerable despite short-term bounces, while geopolitical events and U.S. policy narratives shape market sentiment. Yet behind the volatility, continued ETF inflows, stablecoin stability, and altcoin resilience signal a market that, while cautious, remains fundamentally engaged.
Traders and investors alike should stay focused on key resistance levels for BTC, monitor developments in Middle Eastern tensions and U.S. crypto policy, and watch ETF and stablecoin flows as barometers of broader market conviction.

Checking the trend change after the volatility period
Hello, traders.
If you "Follow", you can always get the latest information quickly.
Have a nice day today.
-------------------------------------
(BTCUSDT 1D chart)
This volatility period is expected to last from June 21st to 23rd.
Therefore, it is necessary to check the trend formed after the volatility period.
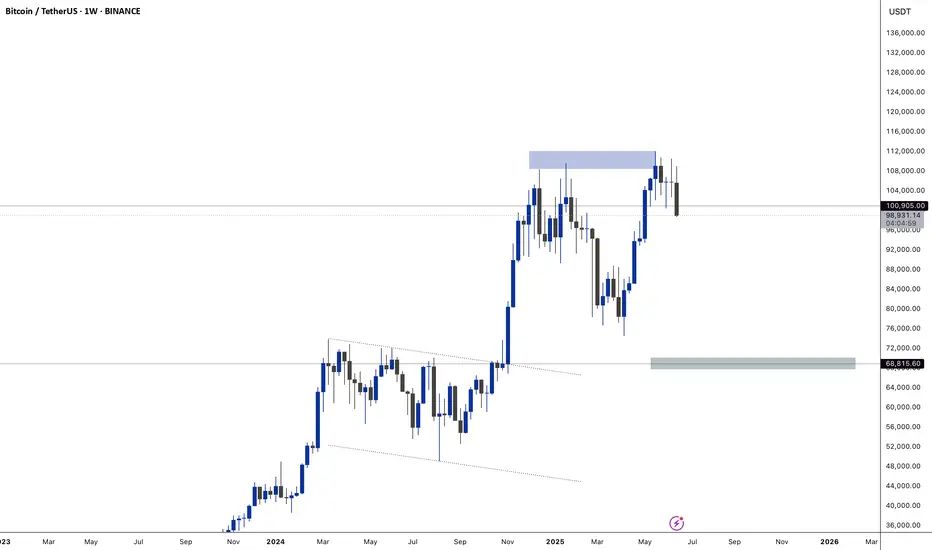
The 99705.62 point is the HA-High indicator point of the 1W chart, so it is important to see if there is support near this point.
If it falls without support, it may fall to around 89294.25.
The 89294.25 point is the HA-Low indicator point of the 1D chart.
Since the M-Signal indicator of the 1W chart is rising to around 99705.62, the area around 99705.62 is likely to play an important role as support and resistance.
Even if it turns upward, it must rise above the HA-High indicator point of 108316.90 of the 1D chart to maintain the price.
If not, it is likely to fall again.
-
The fact that the HA-High indicator was created means that it fell from the high point range.
In other words, if it falls below the HA-HIgh indicator point, it is likely to start a downtrend.
However, since the HA-High indicator is an intermediate value, if it is supported near the HA-High indicator, it is possible to show a stepwise upward trend.
The end point of the high point is the DOM (60) indicator.
Therefore, it should be interpreted that it has risen above the high point section only if it rises above the 111696.21 point.
Therefore, depending on how the 108316.90-111696.21 section is broken upward, an upward trend can be predicted.
----------------------------------------------------------------------
There are auxiliary indicators OBV indicators made of Low Line ~ High Line channels and PVT-MACD oscillator indicators.
The OBV indicator made of Low Line ~ High Line channels is an indicator that can see how the channel is structured, and whether OBV falls below the Low Line of the channel or rises above the High Line.
Therefore, you can predict the future trend based on the channel pattern.
-
The PVT-MACD oscillator indicator is an indicator created by adding the Close value dash PVT value to the MACD formula.
Therefore, it shows a similar appearance to the MACD oscillator indicator.
The reason for looking at the PVT-MACD oscillator indicator is to find out how the trading volume flows.
There are many trading volume indicators, but I think this PVT-MACD oscillator indicator reflects the trading volume flow well.
-
However, you should look at the support and resistance points where the changes in the movement of the PVT-MACD oscillator indicator, the OBV indicator created by the Low Line ~ High Line channel, and the StochRSI indicator occur.
If the changes in these indicators occur near the DOM(-60), HA-Low, HA-High, and DOM(60) indicator points, it can be of great help in creating a trading strategy.
The DOM(-60) indicator indicates the end point of the low point.
That is, falling below the DOM(-60) indicator means that it has entered the low point range, and there is a high possibility that it will show a full-scale downtrend.
The fact that the HA-Low indicator was created means that it has left the low point range.
That is, if it rises above the HA-Low indicator, it means that there is a high possibility that an uptrend will begin.
However, since the HA-Low indicator is an intermediate value, if it encounters resistance and falls, it is possible that it will show a stepwise downtrend.
Therefore, whether there is support in the DOM(-60) ~ HA-Low range is important.
-
Currently, the OBV indicator created as the Low Line ~ High Line channel has fallen below the Low Line.
Therefore, we need to look at whether the Low Line ~ High Line channel will change to a downtrend channel in the future.
We need to look at whether an 'M'-shaped pattern indicating a trend change occurs.
Since the PVT-MACD oscillator indicator is still below the 0 point, it can be seen that the selling force is dominant.
However, since the oscillator is maintaining an upward trend, you can see that the overall selling pressure is decreasing.
Even so, since it is located near the HA-High indicator, the resistance in the HA-High ~ DOM(60) section is expected to be considerable.
-
Support and resistance points should be drawn on the 1M, 1W, and 1D charts.
This will increase accuracy.
However, since the standard time frame chart for all indicators is a 1D chart, it is most important to check the flow of the 1D chart.
-
You may think it is difficult because you have to look at multiple indicators at once.
The most important thing is to look at the movement when approaching the HA-Low or HA-High indicator.
The reason is that the basic trading strategy is to buy near the HA-Low indicator and sell near the HA-High indicator.
-
Thank you for reading to the end.
I hope you have a successful transaction.
--------------------------------------------------
- Here is a description of the big picture.
(3-year bull market, 1-year bear market pattern)
I will explain more details when the bear market starts.
------------------------------------------------------

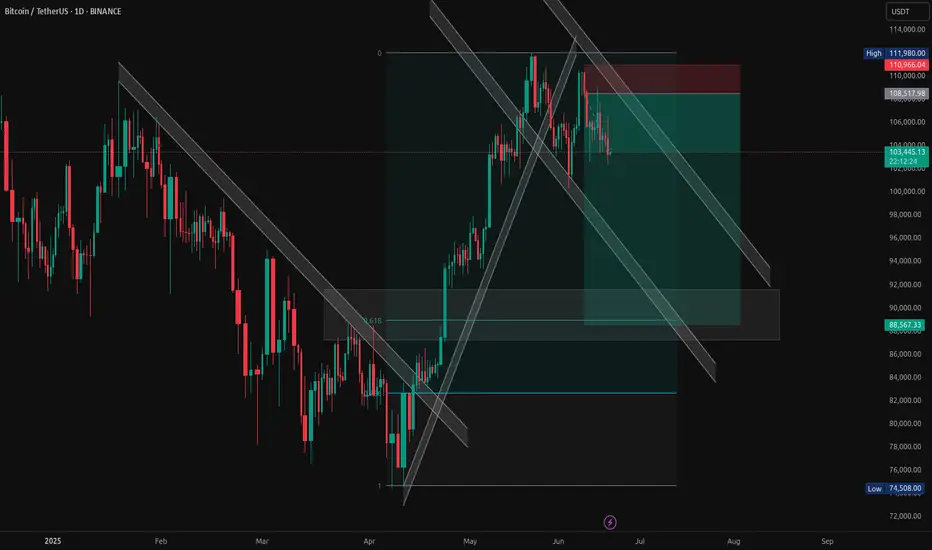
BTC/USDT – Bearish Channel Rejection with Confluence ZonesBitcoin is showing signs of weakness after rejecting the top of the descending parallel channel. This trade idea is based on multiple confluences:
Bearish rejection at key resistance near $110,000–$112,000
Price respecting the descending trendline
0.618 Fibonacci retracement zone acting as potential demand
Risk-reward structure targeting deeper support near $88,500
Previous bullish channel broken – now acting as resistance
📌 Entry near: ~$108517
🎯 Target: ~$88500
🛑 Stop Loss: ~$111980
Looking for further downside continuation if this structure holds. Watch how price reacts at mid-channel and the demand box.
$btc/usdt short swing sh set upth:
sh htf liq + htf sh fib (1.136/1.272) + anti cypher harmonic pattern

BTCUSDT Technical Outlook TC is trading at $106k , with resistance confirmed near $106.14k–$106.22k and support at $104.8k .
A daily drop below $104.8k would confirm a short setup. Conversely, a break above $106.2k on elevated volume is required to challenge the $107k–$108k zone.
Absent significant volume, expect continued sideways action between $105k–$106k.

Short BTC. Next price to touch is 87 to 89KHi,
Market has broken down the structure. When market breaks its structure it continue to fall till the next structure shows its presence which comes under area of 89K.
DIY its for educational purpose.
Happy trading.

Will Bitcoin's growth continue, or is this just a correction ?BINANCE:BTCUSDT After the weekend, the price showed a strong recovery. Currently, it is trading above the monthly and weekly pivot points. However, if these levels are broken without a subsequent buy-back reaction, we can expect the downward movement to continue as part of a higher-timeframe correction. Otherwise, we may see either a local correction or an upward move from current levels with the aim of breaking through the resistance zone and trendlines. All targets are outlined in detail in the video idea.
Write a comment with your coins & hit the like button and I will make an analysis for you
The author's opinion may differ from yours,
Consider your risks.
Wish you successful trades ! mura

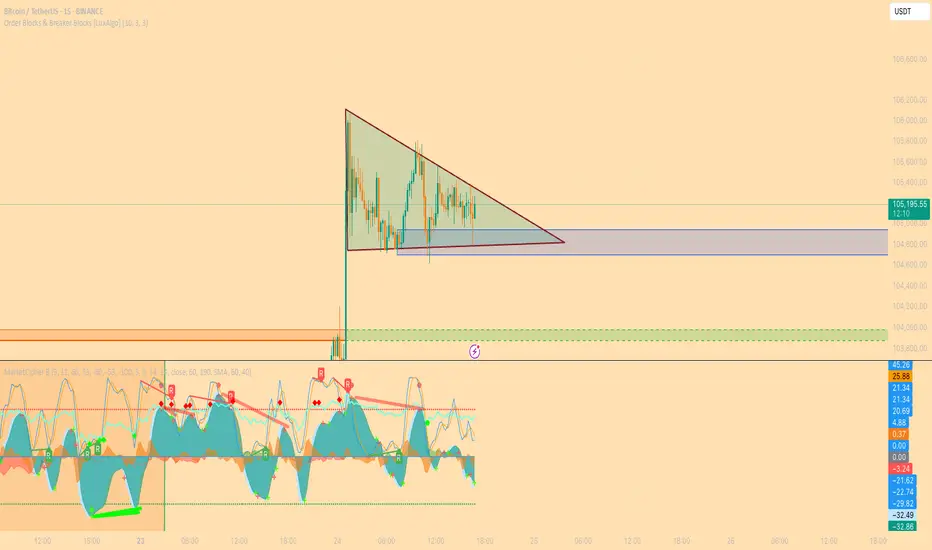
15 Min Bullish BTC pennant 15 minutes before POWELL testimonySelf-Explainatory. let's see if this LTF pennant works!
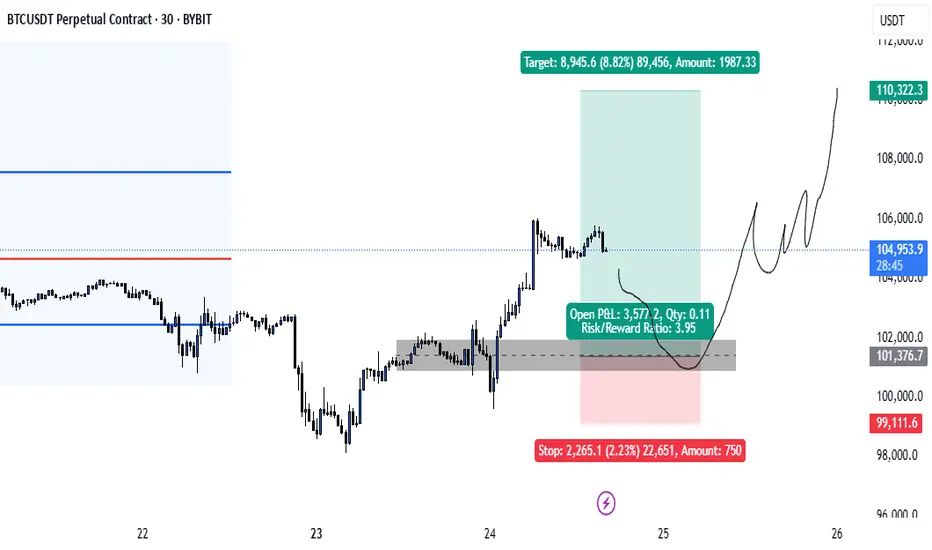
BTC/USDT Technical Outlook – Reversal Zone In Play✅ BTC/USDT Technical Outlook – Reversal Zone In Play
Current Price: 101,884.97 USDT
Structure: Bullish Reversal Setup
🧠 Market Insight:
Bitcoin has tapped into a high-probability demand zone between 100,000 – 99,300 USDT, showing clear signs of buyer absorption after extended downside pressure. The chart illustrates a strong bullish reaction from this area, hinting at a potential shift in momentum.
📈 What the Chart Tells Us:
Demand Zone Activation:
The price has tested a historically reactive demand block and bounced with strength — indicating a possible exhaustion of sellers and re-entry by larger players.
Volume Cluster Confluence:
Volume Profile shows heavy historical activity around this zone. This suggests that the current bounce is not just noise — but supported by previous institutional interest.
Path Projection (White Curve):
Market structure suggests a minor pullback followed by bullish continuation toward the 104,000–105,000 USDT target. The curved projection outlines potential market behavior leading up to this target.
Short-Term Resistance:
First key resistance is seen around 102,800–103,200 USDT. A break above this would likely trigger bullish momentum toward target levels.
🔐 Trading Insight:
Bias: Bullish (Short to Medium Term)
Entry Zone: 100,200 – 100,800 USDT (buy on minor dip)
Target Zone: 104,000 – 105,000 USDT
Invalidation: Clean breakdown below 99,000 USDT
📊 Summary:
BTC is currently sitting at a critical demand zone with bullish potential building. Price action, volume profile, and market behavior all support a reversal toward 104K+. Traders should watch for confirmation on the next pullback before entering long positions.

How Bitcoin can impact alt coins like sol and sui This video is a very quick update on the potential for bitcoin to drop into the 96/97k region and the effect it will have on alt coins .
If you hold altcoins and you see them bleed in price then its important to know and understand whats ahead for Bitcoin .
Understanding this will help you with your entry's and your exits on all altcoins .

BTC - Cup & Handle?BTC forming a cup and handle on the 1D chart which seems to be the main timeframe/narrative of play..


BTC Long to 110kDue to the ceasefire from Iran and Israel a bullish retracement scenario can observed on the market.
bitcoin btc shortshort entry :107.300 , STOP LOSS: 108.400 , PROFIT TARGET 101.000
RR 1:5 BINANCE:BTCUSDT.P

BTC is stuck in a tightening triangle — compression phaseVolatility building up into June 18–19.
Expect a big breakout.
Main scenario: breakout to the upside with a “God Candle” and new momentum for altcoins after prolonged BTC dominance.
Alts have been suppressed, but that’s part of the setup — don’t get tricked by the fake moves.
Stay patient, don’t lose focus, and be ready for a sharp move!

BTCUSDT Update — Big Macro Forces In Play!!Hey Traders!
If you’re finding value in this analysis, smash that 👍 and hit Follow for high-accuracy trade setups that actually deliver!
Bitcoin once again testing key support levels as global tensions continue to fuel uncertainty in the markets.
Chart Overview:
BTC broke down from short-term resistance and is now retesting the major support zone between $102K–$103K. The structure still remains within a broader consolidation range, but this support zone is absolutely critical for bulls to defend.
Immediate Resistance: $106K → $110K
Immediate Support: $102K → $100K
A breakdown below $100K could trigger deeper liquidations towards $95K–$98K, while a successful defense here could push BTC back toward previous highs.
Geopolitical Impact:
Global headlines are heavily influencing risk assets right now:
🇮🇱 Israel-Iran tensions are escalating.
🇺🇸 The US is signaling stronger involvement diplomatically, adding more fear to markets.
📉 Traditional markets have already started to show signs of caution.
Bitcoin, as a risk asset, remains vulnerable to these global macro shocks in the short term.
The Game Plan Right Now:
If we see sustained support at $102K–$103K, there’s still room for a relief bounce towards $106K–$110K in the near term.
However, if global tensions escalate further, expect increased volatility with downside liquidity grabs.
Stay cautious with tight risk management. Macro headlines are still driving sudden sentiment shifts.
📊 My Bias:
Watching for potential sweep of $102K with possible reversal structure forming. Any clear reclaim of $105K may signal a local bottom.
📝 Key Takeaway:
Global narratives are bigger than technicals right now. The next few days could dictate whether BTC holds or faces another sharp liquidation event.
Stay patient. Stay disciplined. And most importantly: manage your risk.
👉 Follow for more real-time updates as we track both price action and macro headlines impacting crypto.

Bitcoin (BTC): Buyers Are Accumulating | Breakout Incoming?Buyers have finally shown dominance near the 200EMA, where now we are heading for for the resistance zone, which will be tested.
As we are entering the friday with that kind of buyside volume we might be seeing strong pump during the weekends so that's what we are looking for now.
Swallow Academy

#Bitcoin is approaching a strong demand zone!#Bitcoin is approaching a strong demand zone!
This level has acted as solid support several times in the past.
According to the Fibonacci levels, we’re currently at the 0.5 level, which makes this area even more significant.
In my opinion, we’re likely to see a bounce from here.
However, if the price fails to hold this level, there’s a good chance we’ll retest the $92K zone.
But for that to happen, we need a daily close below $100K.
Until then, we’re still in a safe zone.
I’ll keep you updated as things develop.
If you find my updates helpful, don’t forget to like and follow for more!
DYOR, NFA

BTCUSDTBULLISH TREND
Major Zone = Yellow area
Can take entry on break of HH/
instant buy/
or any fib level 0.5 or 0.618
Sl is mentioned on the chart, you can adjust your tp's according to ur sl and entry.
