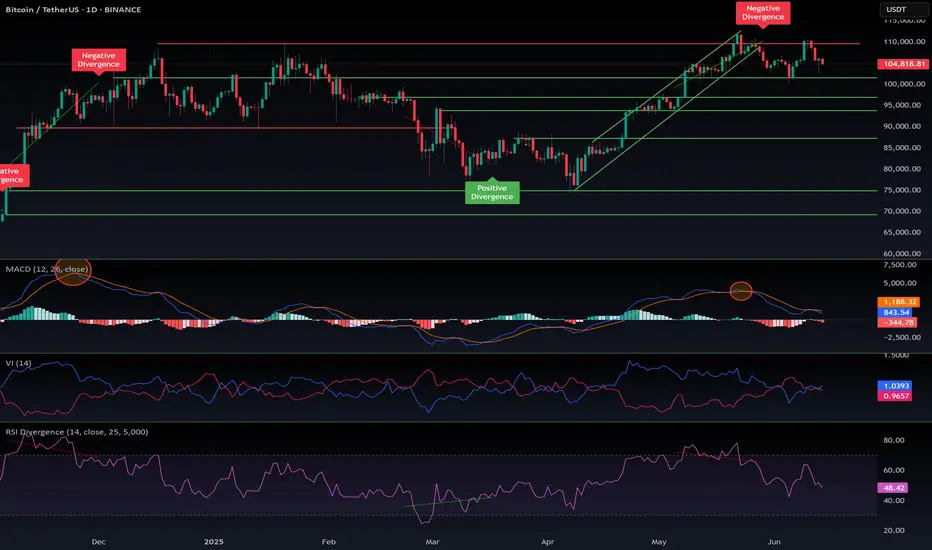
$BTC correction: targets 101k, 97.5k, 94k, 87kThe hype is peaking — institutions, banks, Wall Street, and even governments are buying Bitcoin.
Yet despite the frenzy, BTC has been rejected three times around the $110K level and appears to be heading into another correction.
Bitcoin maximalists are pushing a strong FOMO narrative to attract retail investors, but several factors are pushing back:
- Psychological barrier: At these price levels, retail investors are hesitant. Owning just a "fraction" of a Bitcoin doesn’t appeal to the average person.
- Geopolitical tension: The conflict with Iran is serious. This isn’t a small, isolated country — Iran is a millennia-old civilization with global alliances. This situation won't resolve quickly or easily like Libya, Syria, or Iraq.
- Oil price surge: Escalating tensions could disrupt the Strait of Hormuz, a critical route for global oil. Western sanctions on Russia already strain supply — if Iran joins, where will Europe get its energy? U.S. supply won’t be enough. Expect a spike in inflation.
- Recession risks: Persistent inflation could drive a recession in the second half of the year.
- Trade wars & tariffs: No resolution, just chaos.
- Ukraine-Russia war: Still unresolved. Still draining global stability.
In short, the world is burning — and this is terrible for markets.
Bitcoin maximalists — some even selling company shares to buy more BTC — may soon face the harsh reality: Bitcoin needs a deeper flush before it can rally again. Retail won’t return until altseason clears the way and resets sentiment.
In a cycle dominated by propaganda, institutional manipulation, and global unrest, predictions are fragile. The only guide left: the chart.
Technically, we’re in correction mode again. Comparing with past cycles, potential pullback targets are:
$101K, $97.5K, $94K, $87K
There’s massive support at $74K, but it's unlikely we revisit it soon.
Stay cautious. DYOR.
#Bitcoin #CryptoMarket #BTCUpdate #Geopolitics #Altseason #CryptoCorrection #MacroView #CryptoFOMO #RiskAssets #DYOR
BTCUSDT.3L trade ideas
The Importance of the 104463.99 Point
Hello, traders.
Please "Follow" to get the latest information quickly.
Have a nice day today.
-------------------------------------
(BTCUSDT 1D chart)
This volatility period is around June 22nd (June 21-23rd).
Therefore, waves can be generated at any time during the volatility period.
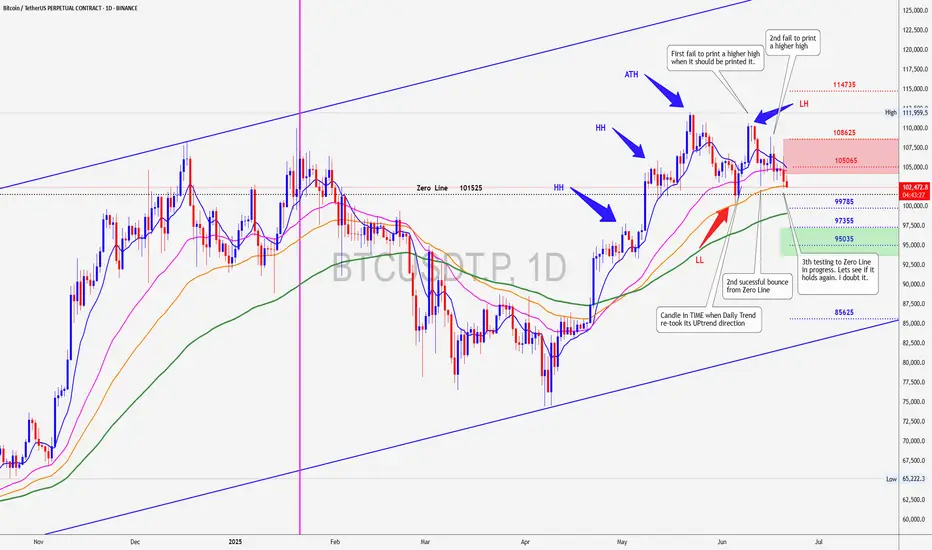
The 104463.99 point is the DOM (60) indicator point of the 1W chart, which corresponds to the end of the high point of the 1W chart.
Therefore, it seems that the price defense is being done well.
I think that defending the price at the high point is significant because it raises expectations for further increase.
-
If it falls after a period of volatility, there is a possibility that it will meet the M-Signal indicator of the 1W chart, and I think the important point at that time is the 99705.62 point.
Therefore, when it falls, you need to check whether the M-Signal indicator of the 1W chart rises to around 99705.62 and whether it is supported.
-
Even if it rises after receiving support near 104463.99, the key is whether it can maintain the price by rising above 108316.90.
The 108316.90 point is the HA-High indicator point of the 1D chart, which corresponds to the middle value of the high point range.
Therefore, in order to continue the uptrend, it must be supported and rise in the 108316.90-111696.21 range.
Currently, both the Low Line and High Line of the auxiliary indicator OBV are showing a downward trend.
Therefore, in order for the uptrend to begin, OBV must rise above the High Line and be maintained.
If not, it is highly likely that it will fall due to selling pressure.
One hopeful(?) thing is that the PVT oscillator is showing an overall upward trend.
(Changed from OBV oscillator to PVT oscillator.)
Therefore, we can see how important the area around 104463.99 is playing a role of support and resistance.
-
In my chart, the basic trading strategy is to buy near the HA-Low indicator and sell near the HA-High indicator.
Therefore, it is virtually impossible to create a trading strategy at the current price level.
In such cases, you should conduct trading through day trading or quick response.
If not, you may experience a lot of psychological fear and anxiety.
The basic time frame chart of all indicators is the 1D chart.
Therefore, if you cannot read the flow of the 1D chart, you are likely to end up getting faked and suffer losses.
Therefore, you should read the flow of the 1D chart and create a big picture of how to create a trading strategy, and respond in detail on the time frame chart below the 1D chart.
-
Thank you for reading to the end.
I hope you have a successful trade.
--------------------------------------------------
- This is an explanation of the big picture.
(3-year bull market, 1-year bear market pattern)
I will explain more details when the bear market starts.
------------------------------------------------------

BITCOIN near a danger PointBitcoin has tested its Zero Line twice and bounce, it is said that third TIME is the charm but I think this TIME will be different so prepare for impact.
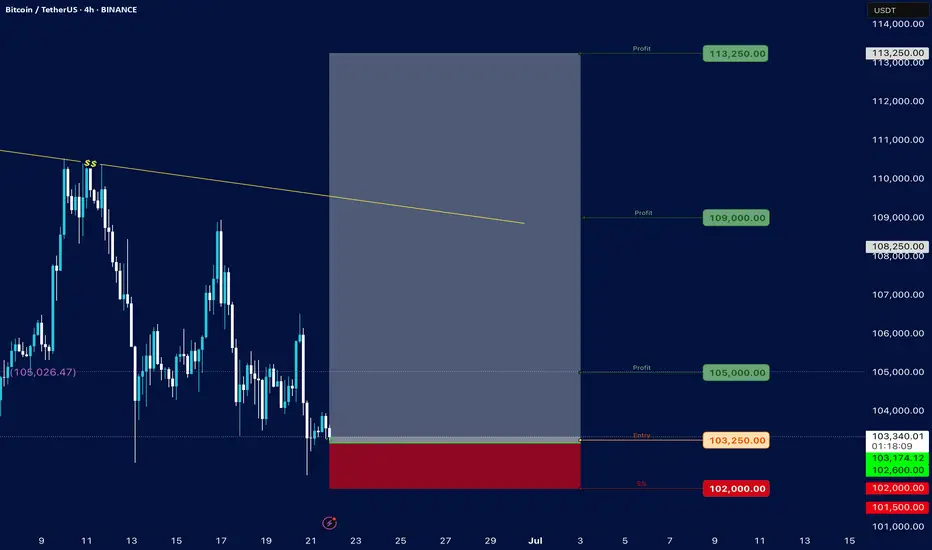
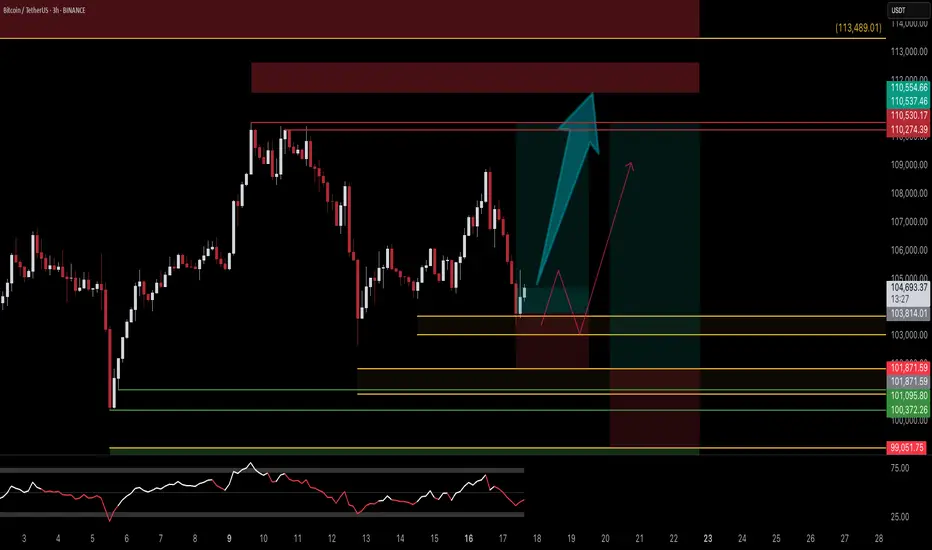
Bitcoin### Bitcoin Price Analysis (June 21, 2025)
#### **Current Price**: $103,236.15 (as of the snapshot)
- The price is hovering near the lower end of the recent range, with key support at **$102,000** (marked as "S/s" on the chart).
- Resistance levels are visible at **$105,000**, **$107,000**, and **$110,000–$114,000**.
#### **Key Observations**:
1. **Support and Resistance**:
- **Strong Support**: $102,000 (critical level; break below could signal further downside).
- **Immediate Resistance**: $105,000 (previous entry point and psychological level).
- **Higher Targets**: $110,000–$114,000 (if bullish momentum returns).
2. **Price Action Context**:
- The price recently rejected the $105,250 level ("Entry") and is now testing lower support.
- The "Profit" markers at $105,000 and $105,026 suggest these were take-profit zones for traders.
3. **Trend and Sentiment**:
- The chart shows consolidation between $102,000–$110,000, with no clear breakout yet.
- A hold above $102,000 could lead to a retest of $105,000, while a break below may target $100,000 or lower.
4. **Volume and Timeframe**:
- The snapshot lacks volume data, but the date range (June–July) suggests a medium-term view.
- Key dates to watch: June 25–28 and early July for potential volatility.
#### **Conclusion**:
- **Bullish Case**: Hold above $102,000 and reclaim $105,000 to aim for $110,000+.
- **Bearish Risk**: Break below $102,000 could accelerate selling toward $100,000 or $99,000.
**Actionable Insight**: Watch the $102,000–$105,000 range for a breakout or breakdown. A rebound from support with volume could signal a buying opportunity, while a drop below $102,000 may indicate further downside.
*(Note: The analysis is based on limited data from the snapshot. For a full assessment, additional indicators like RSI, MACD, and volume would be needed.)*
BTC is Bearish again?BTC 1W Overview
BTC is still trading above 100k despite the macro situation and ww3 situation in the Middle East , which is fine for the BTC maxis and institutions.
Weekly structure starting to shift in a bearish direction considering the weekly close below the structure and daily range is just a chop fest around the 104k area and so does the other assets getting chopped.
BTC.D is now over 1000 days uptrending and this is wild and not at all what many were expecting this point in the cycle.
Big concern on my mind is that what if BTC pulls back to the 90k area as I think may happen which I marked in the chart then altcoins will leg down another 20-30%.
Obviously everything is not about technical and the fundamental side is simply that there is an ongoing conflict in the middle East and the whole crypto market is waiting for a resolution one way or the other and crypto market lacks patience and even we do get the uncertainty then it still doesn't address the deeper market issues of altcoin weakness and continued dominance of BTC (BTC outperformed every single alt except MKR).
My best bet for LONG maxis will be around the 92k area Weekly FVG and Yearly Open, if we get more bad news from the middle East or Russia-ukraine or Sir powell comes with a bad news then this zone will be fast forwarded
And for short maxis or Beras my best bet will be S\R of 104k or monthly open is area to look for
All this planning will go down the drain if TRUMP comes with a good news regarding Tarrifs with china or other countries or any other news from the TRUMP because he's unpredictable
On the short time frame Scalps are possible on both sides and 100k is a psychological level to long but in bearish scenerio or war news will just wreck it
Final bias shifting Bearish
For alts instead of trying to long every dead cat bounce or predict the bottom we have to wait for it to happen and then react accordingly because reaction and execution is better than drawing predictions and getting chopped

Another drop for BitcoinHi traders,
Last week Bitcoin went exactly as predicted.
Price went up a little higher into the Daily FVG and after that it started the next wave down and smaller correction up.
Now we could see a small correction up and after that another drop.
Let's see what the market does and react.
Trade idea: Wait for the correction up to finish to trade shorts.
If you want to learn more about trading FVG's with wave analysis, please make sure to follow me.
This shared post is only my point of view on what could be the next move in this pair based on my analysis.
Don't be emotional, just trade your plan!
Eduwave

BTC is expected to give move by mid or end of July 2025BTC is expected to make a move by mid or end of July 2025
BTC is forming a Bullish Flag Pattern, and it is expected to give a breakout from this flag, by mid or end of July.

Today's BTC trading strategy, I hope it will be helpful to youBitcoin prices hovered around $103,300, retreating from the $104,000 threshold seen in previous days and showing an overall volatile adjustment trend. The market has experienced a notable correction recently, with prices dropping significantly from earlier highs, but currently stabilizing around $103,000. Such fluctuations have left many investors confused about the price trend ahead.
Support and Resistance Levels
Technically, Bitcoin is facing key support and resistance levels. The lower support at $102,300 is critical: if prices hold above this level, the short-term decline may halt or even rebound. However, a break below this support could lead to further declines to test lower levels.
The upper resistance lies in the $107,000–$108,000 range, acting as a "wall" where prices have repeatedly stalled due to trapped positions and profit-taking pressure. For prices to continue rising, a successful breakout of this resistance zone is essential.
Technical Indicator Performance
Multiple technical indicators show bearish dominance in the market. Both MACD and RSI indicators signal bearish sentiment, implying short-term weakness may persist. Notably, prices are approaching oversold territory—similar to a spring compressed too far, Bitcoin may experience a technical rebound if the decline continues.
Today's BTC trading strategy, I hope it will be helpful to you
BTCUSDT BUY@102000~103000
SL:101000
TP:105000~106000

Trade Plan Update #12: Navigating BTC’s Critical Levels
*Conflicting timeframes (bullish 1H/Daily vs. bearish 4H/Weekly) are causing choppy price action. Here’s my 2-step game plan: *
📈 Scenario 1: Bullish 1H Play
Key Support Zone: $100,314 - $102,000 (last line of defense for 1H bullish structure).
Trigger: A strong rejection + bullish reversal signal in this zone.
Action: INSTANT LONG ENTRY. No waiting—aggressively capitalize on momentum.
📉 Scenario 2: Daily Structure Fallback
If $100,314 fails:
1- First Demand Zone: $93,300 - $98,000
Watch for a strong bounce → Go long if momentum confirms.
Weak reaction? Hold and monitor lower.
Second Demand Zone: $84,000 - $88,000
Ideal reversal zone for resuming the bull run.
LONG on confirmed strength.
Bull Run Lifeline: $74,600
Non-negotiable: A daily close below this invalidates the bull trend.
✅ Key Reminders:
Patience is strategy: Only act when price confirms your thesis (no guessing!).
Risk first: Define stops for every entry.
Watch price action—NOT hopes.
👇 What’s your take?
Which scenario seems more likely?
Are you adding any key levels?
Let’s discuss below! 👀

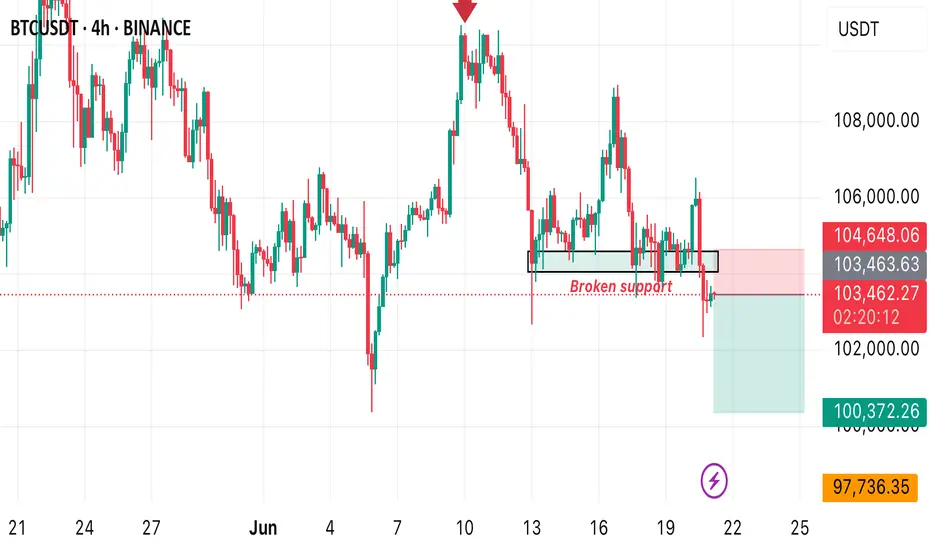
BTCUSD TO FALLBACK TO $100kFrom the technical perspective, btcusd seems quite bearish from the H4 perspective. We recently saw a continuous printing of lower highs therefore we expect a formation of new low around the $100,400 price level. A sell opportunity is envisaged.
DeGRAM | BTCUSD rebound from the demand zone📊 Technical Analysis
● The BTCUSDT 4-hour chart on KUCOIN highlights a pronounced descending channel, with price action recently rebounding from a well-defined demand zone between 98,000 and 100,000. This green-shaded area has repeatedly acted as a springboard for bullish reversals, as evidenced by the strong wick and immediate recovery after the latest test. The chart also marks a series of lower highs and lower lows, but the most recent price action shows a break in bearish momentum, with a projected zigzag path indicating a potential move toward the 104,970 resistance. The confluence of the lower channel boundary and the demand zone suggests that buyers are stepping in aggressively at these levels, aiming for a retest of the upper resistance band.
● The technical setup is further reinforced by the presence of a major resistance level at 111,977, which has capped previous rallies. The chart’s structure, with its clear trendlines and highlighted resistance and support zones, points to a tactical opportunity for bulls to capitalize on the oversold conditions. The anticipated path, as drawn on the chart, suggests a gradual recovery with intermittent pullbacks, targeting the 104,970 area as the next significant hurdle. The overall pattern indicates that while the broader trend remains bearish, the immediate outlook favors a corrective rally from the current demand zone.
💡 Fundamental Analysis
● Recent fundamentals support the technical case for a short-term recovery. Over the past two days, Bitcoin has experienced heightened volatility due to escalating geopolitical tensions, notably US military action in the Middle East, which triggered a sharp sell-off and flushed out leveraged positions. Despite this, institutional accumulation remains robust, with over $1.2 billion in Bitcoin added to corporate treasuries in the last week, and Texas officially establishing a state-managed Bitcoin reserve. On-chain data shows sustained negative netflows from exchanges, indicating that large holders are moving coins to cold storage, a historically bullish signal. Meanwhile, derivatives data reveals a cautious market, with open interest skewed toward protective puts, but spot ETF inflows and long-term adoption trends continue to underpin the market.
✨ Summary
● BTCUSDT is rebounding from a key demand zone, with technicals pointing to a corrective move toward 104,970. The bullish scenario is supported by strong institutional accumulation and strategic adoption, even as short-term volatility persists. A sustained close above 104,970 would open the path to the 111,977 resistance, while a drop below 98,000 would invalidate the recovery thesis.
-------------------
Share your opinion in the comments and support the idea with a like. Thanks for your support!

Bitcoin Holding Above $100K – Bullish Bias IntactIn my previous analysis, I mentioned that a daily close below $100K would trigger a short bias. However, price closed above the $100K level, sweeping liquidity and rejecting the downside.
This move invalidates the bearish setup and confirms a bullish continuation. Market structure remains intact, and we're now looking for potential long setups on retests or pullbacks.
Key Points:
Liquidity sweep below $100K
Daily close above key support
Bullish structure remains valid
Watching for continuation targets and retests
📍 Stay patient and follow price action. Structure never lies.
#BTCUSD #Bitcoin #CryptoAnalysis #LiquiditySweep #BullishContinuation #PriceAction #TechnicalAnalysis #TradingView #CryptoTA

June 12, 2025 Historical Comparison Analysis [Wave Analysis]No one knows tomorrow but what if???
Here, we have a historical comparison between December 07, 2020 to June 13, 2022, and January 22, 2024 to present day.
December 07, 2020 to November 08, 2021:
• Uptrend
• Flag (retracement)
• Uptrend continuation
• Range
• Downtrend
• Range (W or Double bottom pattern)
• Uptrend
• Flag (retracement)
• Uptrend continuation
November 08, 2021 to June 13, 2022:
• Downtrend
• Flag (retracement)
• Downtrend continuation
January 22, 2024 to May 19, 2025:
• Uptrend
• Flag (retracement)
• Uptrend continuation
• Range
• Downtrend
• Range (W or Double bottom pattern)
• Uptrend
May 19, 2025 to present day:
• .......
JUST WHAT IF HISTORY REPEATS ITSELF

BITCOIN TO 193000!!!!EVERYONE IS WRONG!it has been 5 years that i have been studying the btc and linkusdt cycles, and what i know is that a bull market is coming this summer, starting in july—maybe on the 4th or 7th.

Bitcoin (BTCUSDT) - Price Testing Resistance after Morning StarBitcoin (BTCUSDT) price is currently testing the resistance zone of $105,000 to $110,000 (yellow lines).
A morning star candle pattern has formed above the 100 ema (orange line), which is also $100,000 price support.
Some bullish momentum is forming on the MACD Histogram, however, Bitcoin is still technically in a short-term downtrend for the past 30 days.
Bitcoin price needs to create a new uptrend on the daily chart, a series of higher-highs and higher-lows in the price, which could take several months.
At this time, Bitcoin is still reacting to global news and stock market correlations.

Little market update on btc 23/07/25. hope you enjoycheers just a quick one yo update people on my current thoughts on btc

Bitcoin | Long | 3hrsThis technical analysis is for informational and educational purposes only. It does not constitute financial advice. Remember to always research and consult with a professional before making investment decisions. Good luck! 📈💼🚀
Bitcoin Crash To $93k Incoming?!!!!I am discussing the bearish signs i am seeing right now on Bitcoin, and talking about the confirmations I want to see, that will confirm that Bitcoin is about to crash down to 93k!!!

bitcoin update btc struggling to hold the 100k position market is choppy in lower tf but on higher tf its clearly shows sign of tapping below. with a double top on 3d tf, and breaking down of it will push long term holder book profits and with increasing tension in iran and usa 90k looks good support and as i mentioned previously about the cme gap in that area which works asa magnet for btc.
thanks
Measured move target madePrice bounced near the target and has been confirmed by the 4 hour SAR.
The 4 hour SAR is currently on a bearish retrace relative to the daily SAR.
As long as the Daily SAR is above price, the bearish Wolfewave is still in play.
Price is anticipated to go lower than what the 4 hour SAR has established as support.
To see more details and for faster movement, we look to the shorter intervals.
Shorter interval price action could invalidate longer interval patterns.

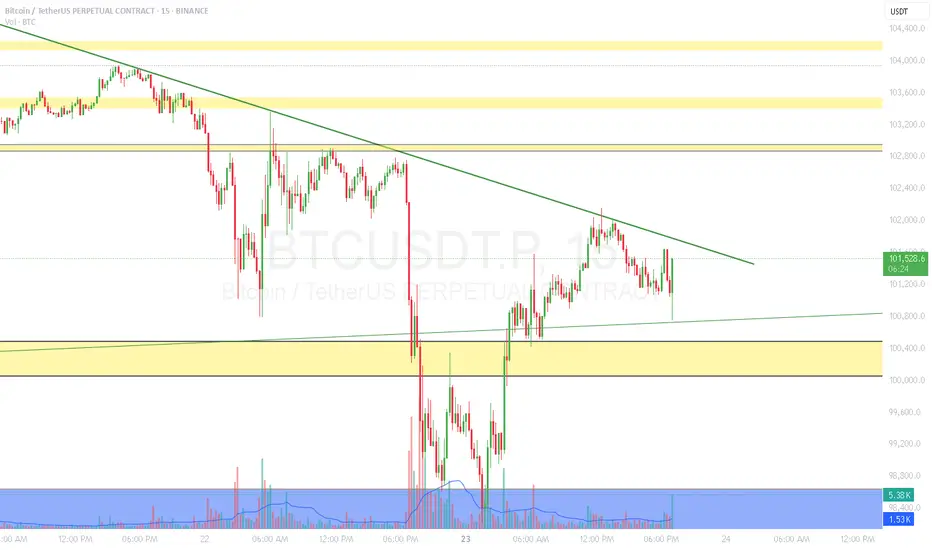
BTC, Selling pressure below 100K, 23 JunePlan BTC today: 23 June 2025
Related Information:!!!
Market capitalisation fell to $3.03 trillion over the weekend, likely due to speculators expecting a sell-off in response to US strikes on targets in Iran. However, the limited reaction from traditional financial markets brought buyers back to the crypto space, showing their willingness to buy at a discount and pushing market capitalisation back up to $3.12 trillion.
The cryptocurrency sentiment index dropped to 42 on Sunday, its lowest level in two months, but rebounded to 47 at the start of the new week, moving from the fear zone into neutral territory.
Bitcoin slipped to $98K over the weekend, briefly touching the classic support level at 61.8% of the April–May rally. However, by the start of the European trading session, it had already recovered to around $102K, compared to $102.7K at the beginning of Sunday. Still, last week’s sell-off broke the 50-day moving average support, weighed down by external factors. A breakout from the $96K–$105K range will likely determine the direction of the next major move
personal opinion:!!!
Selling pressure caused gold price to drop below 100k yesterday, macro economy has not changed much. Gold price continues to suffer selling pressure
Important price zone to consider :!!!
support zone : 100.800 ; 98.200
Sustainable trading to beat the market

BTC Bitcoin: Where I'm buying this war crash. Buy in strategyBTC Bitcoin: Where I'm buying this war crash. Buy in strategy
We're in a buy zone right now but I'm looking for bullish divergences for entry. I'll add more if we start getting higher highs.
If we lose this zone, then I'm looking again around the 90k area.
I think this is a wonderful opportunity to get BTC under 100k.

BTCTHE BTC 99k is a strong demand floor as shared across all platform weeks ago, my ema+sma strategy is giving me another lower buy floor on the daily ascending trendline in the zone of 94k.
that zone will be watched as it will represent a break of a strong demand floor 100k floor .
