Bitcoin– bearish momentum builds after rejection at $109KIntroduction
Bitcoin (BTC) is currently showing weakness after forming a lower high at $109,000. This level acted as a significant point of rejection, and since then, BTC has been moving lower. The price has broken through key support areas, indicating a possible shift in market structure. In this analysis, we’ll break down the recent price action, explain the technical signals behind the move, and discuss what could be expected in the short term.
Rejection from the 0.786 Fibonacci Level
The rejection at the $109,000 level aligns perfectly with the 0.786 Fibonacci retracement on the 4-hour timeframe. This level is often seen as a strong resistance point during corrective moves, and in this case, it held firmly. The precision of this rejection gives it more weight, and since hitting that point, BTC has been steadily declining. This move down suggests that buyers were unable to push through the resistance, leading to increased selling pressure.
Break of the 4H Bullish FVG
As BTC started its decline from $109,000, it broke through the bullish Fair Value Gap (FVG) that had formed earlier on the 4-hour chart. This gap previously served as a support zone but has now been decisively broken with strong volume. The loss of this level is significant, as it marks a breakdown of the bullish structure and opens the door for further downside movement. In the process of this move lower, BTC has created a new bearish FVG on the 4-hour timeframe. This gap remains open and could potentially act as a magnet for price to revisit, offering a possible short entry if price retraces into that zone. However, the clear break below the previous bullish FVG indicates a shift in momentum and supports a more bearish bias for now.
Downside Target at $102.7K
Given the recent breakdown, the next key level to watch is around $102,700. This area marks the wick low on the 4-hour timeframe and stands out due to the size and sharpness of the wick. Such large wicks often leave behind unfilled orders, which markets tend to revisit over time. The presence of these resting orders makes this level a likely target for the ongoing move down. It also acts as a strong area of potential support, where buyers might step back in if the price reaches that point.
Conclusion
With the rejection from the 0.786 Fibonacci level and the failure to hold the bullish 4H FVG, BTC has shown clear signs of weakness. The breakdown in structure suggests a continuation to the downside is likely, with $102.7k being the most immediate target. This level could serve as a strong support zone due to the unfilled orders left behind by the previous wick. Until BTC reclaims key support levels or shows a shift in momentum, the bias remains bearish in the short term, and traders should remain cautious while expecting further downside.
Thanks for your support.
- Make sure to follow me so you don't miss out on the next analysis!
- Drop a like and leave a comment!
BTCUSDT.3L trade ideas

bitcoin update as reacted market is now at a key support level of 101k.
market will now might give a dead cat bounce till 104-105k max, a scalp long can be taken with cautious, one bad news and that ded cat bounce will die with the market.
stay safe everyone.

Bitcoin StructureBTCUSDT — day
Now we clearly respect the supply zones . The price has already beaten off the zone twice, and there is no desire to go higher yet.
Also by structure:
There was an explicit Break of Structure, then Market Structure Shift (MSS) - impulse change
Below in the region of 93k - the discount zone, where there is a large liquidity (according to calculations - stops by about 17 billion)
→ Continuation of the rollback down
→ Liquidity collection from 93k
→ And only after that a possible turn up
❗️So far, I'm only looking for shorts from the offer zones - on junior TF, with confirmation on 4H.

btc 150/160 kSeveral key factors contributed to Bitcoin’s dramatic rise to $150,000:
Institutional Adoption: Major financial institutions, hedge funds, and even governments have started to invest in Bitcoin, seeing it as a hedge against inflation and economic instability.
Limited Supply: With only 21 million bitcoins that will ever exist, scarcity plays a major role in driving up demand and price.
Geopolitical Instability: As traditional currencies face pressure from inflation and political uncertainty, investors turn to decentralized alternatives like Bitcoin.
Public Trust and Awareness: Widespread education and acceptance of cryptocurrencies have led to more retail investors entering the market.

Support Tested: Can Bitcoin Withstand Global Fear?CRYPTOCAP:BTC is struggling to hold above the key support zone after losing its rising trendline.
This weakness comes as the Israel-Iran conflict intensifies, shaking global market confidence. While BTC has often acted as a hedge, rising geopolitical tension is pushing investors toward safety, causing hesitation even at critical support levels.
A breakdown here could trigger deeper downside.
DYOR, NFA
BTC HTF TA- Going as planned.
- Nothing changed
- Prepare for the worst liquidation event where every retail traders are net long in crypto based on their fantasies, hopes and dreams. X has been toxicating them with the ideas of US gov. or US iBank will make them rich.

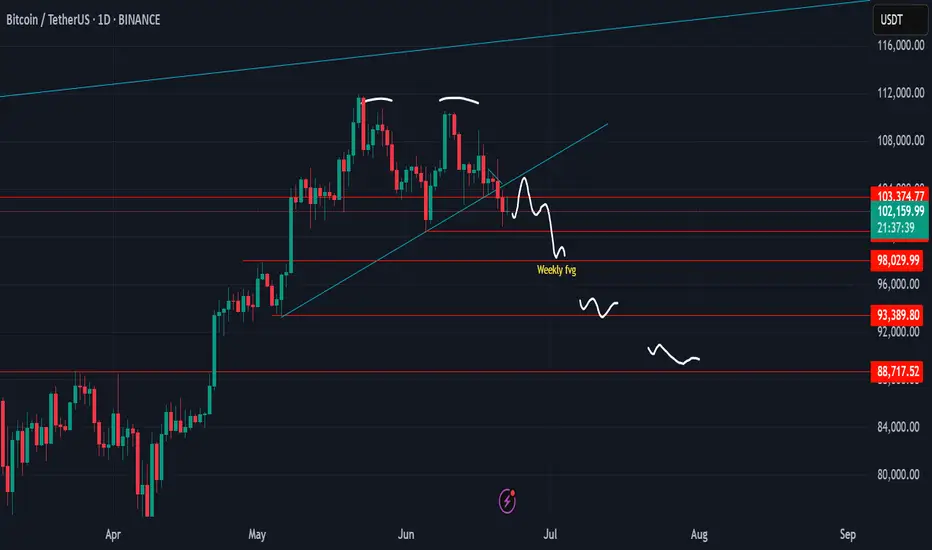
Bitcoin, everyday dump dayNow, we can see everyday is dump day till several days
After success breakout trendling and support, then can't back above the lines
Reasonable target is mini pump to retest then dump to 98k, 98k level is support and weekly open fvg
But if 98k break we will see 93k, and if 93k break we will see final of double top target around 88k and altcoin will rug hard again
But if Bitcoin can go back above 108k, maybe this scenario will be invalid
$BTC Breaks Key Support – Bearish Signal Bitcoin has lost the CRYPTOCAP:BTC Breaks Key Support – Bearish Signal
Bitcoin has lost the critical 50 EMA on the daily chart, which has historically acted as a strong support level. This breakdown mirrors the 2021 double top structure and is now hinting at a deeper correction.
🔸 Key Support Zone at $100,000:
Losing this zone increases downside risk. If $100K fails to hold, next visible supports are at $96K and $91K, aligning with past consolidation zones.
🔸 Risk Level at $104,500:
A daily close back above $104.5K would invalidate this bearish view and indicate strength recovery.
🔸 Outlook:
Wait for further confirmation below $100K for potential short setups. Avoid long entries until clear reversal signs appear.

Today's BTC trading strategy, I hope it will be helpful to youWhen Bitcoin prices dip to $101,900—despite the prevailing bearish sentiment—a rational long-position strategy can still be formulated by weighing long-term investment value against potential short-term rebound opportunities. The analysis below covers entry timing, position management, and risk control.
I. Entry Timing Judgment
(1) Technical Signals
Monitor price performance around $101,900. Potential long entry signals include:
1. **Confirmation of bottom patterns**: When prices consolidate near this level to form double bottoms, triple bottoms, or other base structures, and the trading volume during the second/third retest is notably lower than previous attempts—indicating weakening selling pressure. For example, if a double bottom forms near $101,900 with 30% less volume in the second retest than the first, this signals a preliminary entry point.
2. **Technical indicator crossovers**: Track metrics like the Relative Strength Index (RSI) and Moving Averages (MA). A long signal strengthens when:
- RSI breaks above 50 from oversold territory (below 30).
- The 5-day MA crosses above the 10-day MA (golden cross).
- Price breaks through short-term resistance (e.g., $102,500) alongside moderate volume expansion.
(2) News Catalysts
Macro events and industry trends are critical for timing:
1. **Fed dovish signals**: Clues of earlier rate cuts or reduced hiking expectations—boosting market liquidity and benefiting Bitcoin. Align such news with technical signals to enhance long-position reliability.
2. **Cryptocurrency sector tailwinds**: Developments like progress on U.S. stablecoin legislation, relaxed global regulatory policies, or breakthroughs in real-world adoption (e.g., more enterprises accepting Bitcoin payments, higher settlement ratios) can reignite value reassessment. If prices stabilize near $101,900 amid such news, consider entering long positions.
Today's BTC trading strategy, I hope it will be helpful to you
BTCUSDT BUY@102000~103000
SL:101000
TP:105000~106000

BTC get out while you still can!I've been warning people about this for weeks. History doesn't repeat itself, but it certainly rhymes. BTC had a double tope and the 50 / 200SMA show cooling and both showing clearly that it's moving one direction and it's not up. Gravity with this one is strong (historically) and so is the volatility. Crypto bros will go back to eating beans and rice!
MSTZ and BTCZ could be good plays here....best of luck and always do your own due diligence!

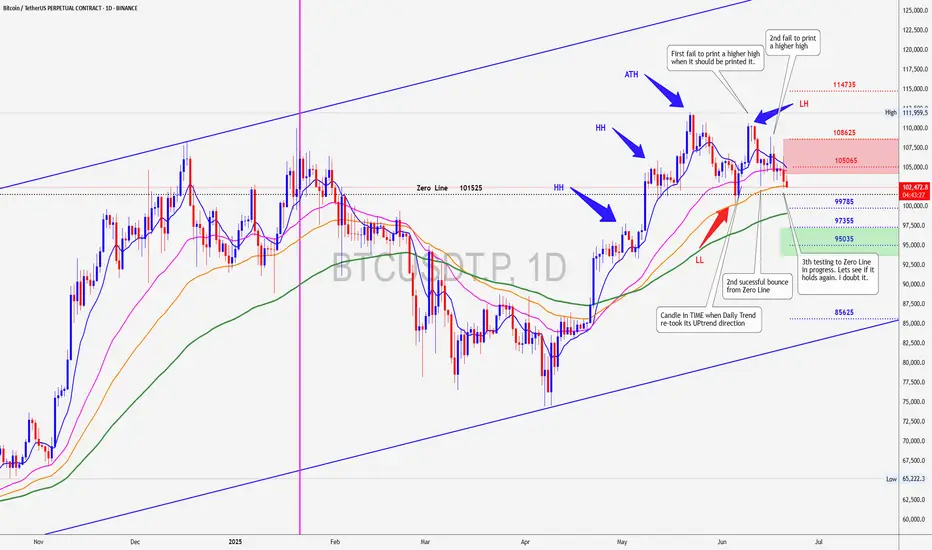
BITCOIN near a danger PointBitcoin has tested its Zero Line twice and bounce, it is said that third TIME is the charm but I think this TIME will be different so prepare for impact.
Long trade
1min TF entry
🟢 Trade Journal Entry – Buyside Trade
📍 Pair: BTCUSDT
📅 Date: Saturday, June 21, 2025
🕒 Time: 11:45 AM (NY Session AM)
⏱ Time Frame: 1 Minute
📈 Direction: Buyside
📊 Trade Breakdown:
Entry Price 103,468.8
Profit Level 103,639.8 (+0.17%)
Stop Loss 103,420.3 (−0.05%)
Risk-Reward
Ratio 3.53: 1
🧠 Context / Trade Notes:
1-Minute TF Scalping Setup:
Trade executed on ultra-low time frame during late NY AM volatility window — ideal for short bursts of movement and precision entries.
Liquidity Sweep Below Minor Low:
Entry taken after price dipped below a small intra-session low, triggering a liquidity grab before a quick reversal.

Bitcoin Short-Term 1H Timeframe, Next Target ConfirmedWe have two drops on this chart. The one of the left is more extended and long lasting compared to the one on the right. When a move is sudden with major force, it tends to end suddenly as well.
The recent drop was very steep and the force needed to keep pushing prices lower cannot be maintained, it requires too much energy; for this reason, a higher low is in place and the bulls win the game.
The action is happening above the blue line and space on the chart, this is the 0.618 Fib. retracement support. This is the most important level and so far it holds. Prices went below just to recover. Can be called a failed signal or a bear-trap, whichever you choose, the action is bullish above this level and bearish below.
Bitcoin's main support stands around $102,663, this level was not challenged. Since bears failed to push prices lower, the next logical move is a challenge of higher resistance. And the same pattern repeats, up and down, up and down... This is the short-term noise. When all is set and done, Bitcoin will resolve going up.
Patience is key.
Thank you for reading.
Thanks a lot for your continued support.
Namaste.


Bitcoin and the geopolitical news BINANCE:BTCUSDT.P
Advanced Technical Analysis of Bitcoin's Structure – Current Situation on Smaller Timeframes
We notice a symmetrical triangle forming on the small timeframes (1-hour and 4-hour), centered in a critical area. Historically, when this price pattern forms, Bitcoin takes no more than three days to confirm its trend. Therefore, the close of the third-day candlestick will serve as a pivotal turning point.
🔹 Immediate Support: 103,400
🔹 Strong Support: 102,500 — a daily low + institutional liquidity zone
🔹 First Resistance: 105,600 — associated with a convergence of moving averages (EMAs)
🔹 Main Resistance: 106,700 — a crossover with the 200-period moving average, which can be described as the largest psychological barrier
---
Possible Scenarios:
☑️ Positive Scenario:
If 105,600 is breached, we are expected to witness an upward movement targeting:
108,000
110,000
118,000 (potentially later)
✅ Catalysts:
Positive US economic data
Regulatory news supporting the markets (such as institutional entry and cryptocurrency regulations)
---
⚠️ Negative Scenario:
If the 102,500 support level is broken, the path will be open to:
100,000
99,000 (strong psychological support area)
❗️ Potential Triggers:
Negative inflation data
Major geopolitical escalation (especially if it directly involves the United States)
🔴 Important Note: I'm not a proponent of trading based on news, but I'm including the US factor because it's the only one I consider truly influential in geopolitical analysis.
The US entering a full-scale war would prompt American investors (who represent about 5% of active traders) to withdraw immediately for fear of long-term repercussions.
🔻 America is making history now, and Trump is managing the situation expertly. He is likely to avoid getting involved in long-term conflicts, focusing on concluding deals and wars strategically.
---
Current Sideways Trading:
Trading continues between the 103,400 and 105,600 levels within the symmetrical triangle.
The future direction will be determined by the following developments:
If the conflict ends and a deal is reached (especially if Iran surrenders), we will witness a strong upward breakout.
If the United States enters the war directly, we expect a downward breakout to levels that may reach 92,000.
---
Technical Conclusion: 💎
Bitcoin is in a critical consolidation phase with a delicate balance between institutional selling pressure at 106,700 and strong buying demand at 102,500.
The next breakout will depend on:
1. A clear breakout of the triangle pattern
2. The strength of the liquidity accompanying the movement
3. Official US developments—regulatory or political
---
Important Clarification:
❌ The recent decline is not directly related to the Iran-Israel war. Rather, it came as a result of:
1. Options expiry
2. Trump's statements about the possibility of direct US intervention, with the arrival of an aircraft carrier in the Middle East
🔍 A war between only two parties doesn't worry the market much, but US intervention is the decisive factor.
✅ America alone is the one that moves the markets.

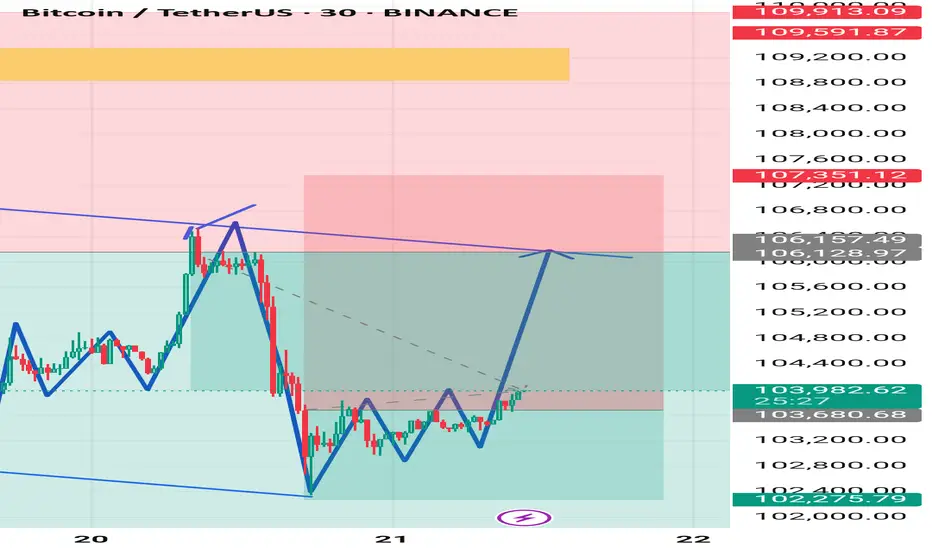
Xauusd market This chart is a 30-minute BTC/USDT (Bitcoin/Tether) technical analysis from Binance, showing a potential bullish setup. Here's a breakdown of the key elements:
1. Descending Broadening Wedge
The blue trendlines forming a broadening wedge indicate a reversal pattern.
Price has been moving within this structure and recently broke out from the bottom back toward the upper resistance line.
This pattern typically ends with a bullish breakout, especially after consolidation near the lower boundary.
2. Key Zones
Support Zone: Around $102,275 – $103,680 (light green zone).
Resistance Zone: Between $106,128 – $107,351 (light red zone), with an extended resistance up to ~$109,591 (dark red line).
3. Pattern Suggestion
The blue zigzag lines suggest a possible Inverse Head and Shoulders pattern near the current price area, indicating a bullish reversal.
A projected price path (in dotted grey) hints at a bullish move targeting the upper trendline near $106,128–$106,157, potentially a 16th–21st June breakout setup.
4. Price Action
Current price: $103,982.63, with moderate momentum (+0.66%).
The arrow projection suggests a bullish move targeting the upper resistance zone.
---
Summary:
Bias: Bullish short-term outlook.
Target Zone: $106,100–$107,300.
Invalidation: Drop below $102,275 may negate the bullish setup.
Let me know if you'd like an entry/exit plan, risk/reward analysis, or a trading strategy based on this setup.
BTC 4H SCALPBTC/USDT Scalp Setup – 4H Chart
Entered a scalp position with TP1 aligned at the Fibonacci extension near 105,652. The first take-profit has been secured, and the remainder of the position is being left to ride — no emotional attachment. If invalidated, the trade will be abandoned without hesitation.
Technical Overview:
Price broke out of the local downtrend channel
Watching for a potential green dot on the volume oscillator to confirm upward continuation
VMC Cipher B shows early signs of a shift; confirmation is still pending
That said, short-term caution is warranted.
Bearish Considerations:
On the higher timeframes, there’s a visible bearish divergence between price and volume — price continues to push higher, while volume fades, indicating a potential trend exhaustion.
Thanks for your support.
If you found this idea helpful or insightful, feel free to leave a like or comment, open to your thoughts and perspectives.

Trade Plan Update #12: Navigating BTC’s Critical Levels
*Conflicting timeframes (bullish 1H/Daily vs. bearish 4H/Weekly) are causing choppy price action. Here’s my 2-step game plan: *
📈 Scenario 1: Bullish 1H Play
Key Support Zone: $100,314 - $102,000 (last line of defense for 1H bullish structure).
Trigger: A strong rejection + bullish reversal signal in this zone.
Action: INSTANT LONG ENTRY. No waiting—aggressively capitalize on momentum.
📉 Scenario 2: Daily Structure Fallback
If $100,314 fails:
1- First Demand Zone: $93,300 - $98,000
Watch for a strong bounce → Go long if momentum confirms.
Weak reaction? Hold and monitor lower.
Second Demand Zone: $84,000 - $88,000
Ideal reversal zone for resuming the bull run.
LONG on confirmed strength.
Bull Run Lifeline: $74,600
Non-negotiable: A daily close below this invalidates the bull trend.
✅ Key Reminders:
Patience is strategy: Only act when price confirms your thesis (no guessing!).
Risk first: Define stops for every entry.
Watch price action—NOT hopes.
👇 What’s your take?
Which scenario seems more likely?
Are you adding any key levels?
Let’s discuss below! 👀

BTCUSD 1D | big consolidation
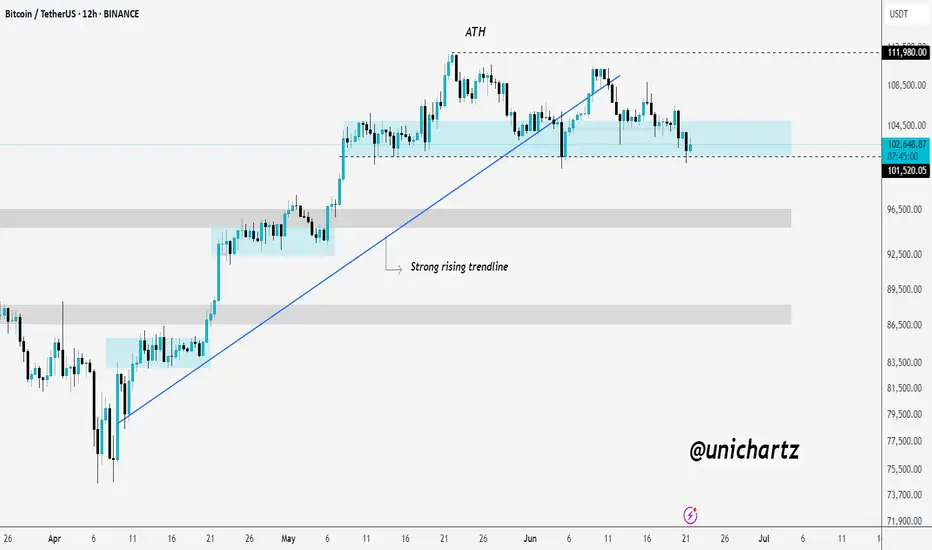
🧠 1. Pattern and Market Structure Identification
✅ Trend and Pattern: Bullish Flag
• Structure: Price forms a descending consolidation pattern (descending channel) after a sharp upward impulse — this is a classic characteristic of a bullish flag.
• Breakout volume occurred from the consolidation zone near the green support area → an early signal that bulls are active.
• However, the price is currently retesting the breakout area and is testing the demand zone again.
📊 2. Volume Analysis
• Volume spikes (purple arrows) occurred at several key points:
• Initial breakout
• Support retest
• High volume during the breakout = valid breakout confirmation.
• Currently, volume is slightly declining = a signal of consolidation and possible accumulation.
📉 3. Support & Resistance Levels
• Strong Support: 96,961 USDT (marked by the blue line and breakout volume).
• Major Resistance: 111,980 USDT (all-time high and projected target from the flag breakout).
• Current Price: 103,272 USDT → sitting between these two key levels.
🎯 4. Potential Price Direction
Bullish Scenario:
• If the 96,961 USDT support holds, price could continue upward → the bullish flag target = projected height of the flagpole.
• Conservative Target: 111,980 USDT (ATH)
• Aggressive Target (if ATH breakout occurs): 115,000+ USDT
Bearish Scenario:
• If price breaks below 96,961 USDT with strong volume, it could invalidate the bullish pattern and drop further to the 92,000 – 90,000 USDT range.

bitcoin bullish and bearish BINANCE:BTCUSDT.P
bullish
🔹 Technical analysis according to Elliott waves (time: 1 hour)
📌 The pattern shown on the chart shows a complex structure that includes a complex correction within the larger wave (B), and the following is clear:
🔸 Main waves:
Wave (1) up from the bottom has been confirmed.
It was followed by a corrective wave (2) that ended near the 0.786 Fibonacci level = 102,575.
Then the upward wave (3) started, and it seems that it has been completed or is about to be completed.
🔸 Current status:
The price is currently moving within a small corrective wave, likely wave (4).
Current major support is located at: 🔸 102,275.7 (very important level) 🔸 100,317.6 (in case the correction extends)
🔸 Critical resistance areas:
For the bullish scenario to be valid, the resistance must be broken:
106,759 (0.618 Fibonacci ratio)
108,948 (0.786 – peak of wave C)
---
🔹 Important technical points:
🔸 The last correction (A)-(B)-(C) shows a clear triple structure, indicating that wave (2) has been completed.
🔸 The price is currently bouncing off the 0.5 - 0.618 Fibonacci levels (104,402 - 104,923), which reinforces the possibility that wave (2) has actually ended, and that we are currently starting an upward wave (3).
---
✅ Conclusion:
✅ As long as the price is above 102,275, the upward scenario through wave (3) remains valid.
⚠️ Breaking 100,317 indicates the failure of the bullish scenario and a structural shift in the waves.
🔻 Alternative (Bearish) Scenario – Short-Term:
If the price fails to maintain the current support at 102,275, we may not be in wave (4) but rather at the beginning of a new downward wave within a broader corrective scenario, as follows:
---
🔸 Wave Interpretation:
🔹 Wave (B), which completed at the peak near 108,948, likely marked the end of an upward correction.
🔹 The current downward wave from that peak could be:
Either wave 1 of C within a larger correction,
or the beginning of wave (C) within a bearish (A)-(B)-(C) pattern.
---
🔻 Potential Downside Targets in This Scenario:
1. Breaking 102,275 = Confirmation of the beginning of a new downward wave.
2. First Target:
🔸 101,484 (1.618 Fibonacci Extension – Wave 1 Expected)
3. Second and Stronger Target:
🔸 100,317 = Previous Major Support, Representing an Important Structural Test Area.
4. Third and Most Extreme Target in This Scenario:
🔸 98,800 – 99,260 = Possible Wave C Extension (Corresponds to a Larger Downside Scenario).
---
⚠️ Failure Signal:
Remaining below 105,926 (Previous Sub-Wave Resistance) maintains selling pressure.
Any weak bounce and lack of a clear wave 5 upwards = an additional sign of bearish dominance.
---
🔻 Conclusion:
✳️ The bearish scenario assumes that the peak at 108,948 was the end of corrective wave (B), and that we are now in a downward wave C targeting areas between 101,400 and 99,200, and possibly lower.
✳️ A break of 102,275 would be key to activating this scenario.

BTC dump time , fake breakout, watch US news todayAny US strike on Iran will lead to a big dump in price

$BTCUSDT Eyes $120K After Key Support BounceBTCUSDT is holding strong above the ascending trendline and key support near $104K.
A fresh bounce suggests bullish momentum, with potential to break the $110K resistance.
If that happens, the next target could be around $120K. Trend remains bullish above support.
DYRO, NFA

continue to move accumulation: below 109,000💎 Update Plan BTC (June 20)
Notable news about BTC:
Semler Scientific (SMLR) unveiled an ambitious three-year strategy on Thursday aimed at significantly expanding its Bitcoin holdings to 105,000 BTC by the end of 2027. The announcement coincided with the appointment of a new executive to lead the firm’s digital asset initiative.
The Nasdaq-listed healthcare firm has named Joe Burnett as its Director of Bitcoin Strategy, a move it believes will strengthen its long-term treasury vision and enhance shareholder value. As part of this strategic shift, Semler Scientific plans to accumulate Bitcoin through a mix of equity and debt financing, alongside reinvested cash flows from its core business operations.
Technical analysis angle
BTC as well as XauUSD are trapped in the channel price 104k to 110k these are also two important milestones of BTC. Also congratulations to investors when detecting the bottom of 104k. The next expectation within the price channel is still maintained at 110k landmark
But with the recent moves of investors, the community is afraid that BTC will continue to adjust in the future.
==> Comments for trend reference. Wishing investors successfully trading
