BTC/USDT Technical Analysis🔍 BTC/USDT Technical Analysis
📆 Chart Context:
Published on: June 18, 2025
Instrument: Bitcoin (BTC) vs Tether (USDT)
Timeframe: Appears to be 4H or 1H based on candle width and structure
🧠 Market Structure
🔸 Lower Highs Forming
Clear rejection from around 110,000–112,000 USDT
A sequence of lower highs suggests bearish momentum
Market is failing to break previous highs, signaling potential reversal
🔸 Strong Support Zone
Marked between $99,000 – $100,000
This level has previously caused price reversals (see June 6 and 13 wicks)
Currently being tested again — buyers have defended this area twice
🔁 Price Action & Candlestick Behavior
Recent candles show indecision and weakness after a mild bounce
Wick rejections near $106,000–$107,000 point to supply zone
Projected path (gray curve) implies a small pullback, then a breakdown into the support zone
📉 Prediction: Price Outlook
✴️ Short-Term (1–3 Days):
A likely pullback to $106,000, then a drop toward $100,000–$99,000
If support fails to hold, next target is $96,000–$94,500
✴️ Bearish Breakdown Confirmation:
Candle close below $99,000 with high volume = clear sell signal
In this case, bears may aim for $92,000–$90,000 next
✴️ Bullish Scenario (Less Likely):
If price holds above $104,000 and breaks $108,000, next resistance: $110,500–$112,000
📊 Key Technical Zones
Zone Type Price Level (USDT) Note
Resistance $110,000–$112,000 Previous top, major supply zone
Short-Term Resistance $106,000–$107,000 Weak bounce, possible entry area for shorts
Current Price ~$104,376 Weak consolidation
Support Zone $99,000–$100,000 Key demand area
Breakdown Target $96,000–$94,000 If support fails
✅ Professional Outlook Summary
Market Bias: 📉 Bearish
Action Zone: 🔍 Watching $106K as potential short entry
Support Critical: $99K must hold, or deeper drop
Risk Level: ⚠️ High volatility likely
BTCUSDT.3L trade ideas

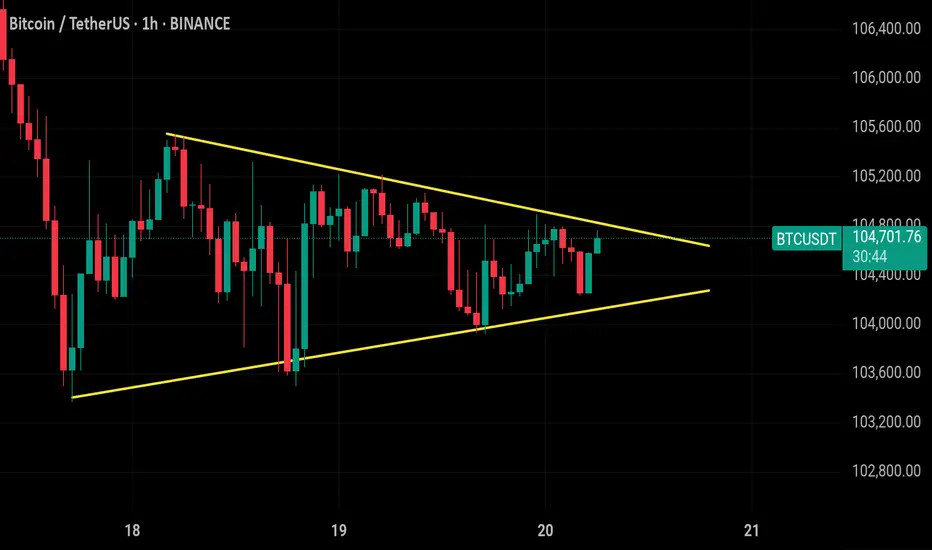
#Bitcoin ( $BTC/USDT ) is forming a symmetrical triangle on the #Bitcoin ( $BTC/USDT ) is forming a symmetrical triangle on the 1H chart, with strong support near 103,800 and resistance around 105,100. Price is consolidating tightly, indicating a breakout is near. A bullish breakout above 105,500 could target 110,000, while a breakdown below 103,500 may lead to a drop toward 102,000. Key invalidation lies at 103,500. Wait for volume confirmation before entering —
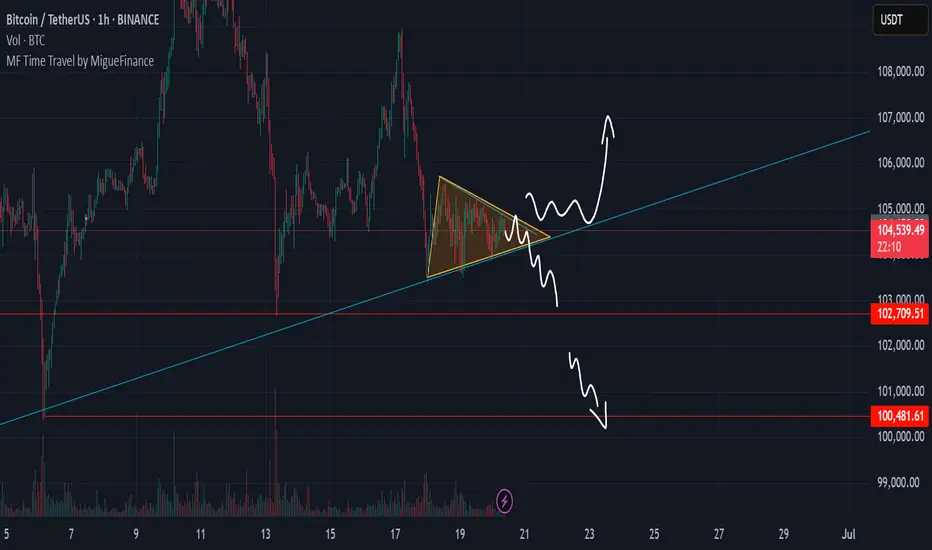
Bitcoin Triangle Pattern, Bullish or Bearish ?We can see LTF bitcoin create mini triangle pattern after downtrend, basically its called bearish triangle continuation. but lets see what is the side will be break
100k vs 107k
BTC H4 Range Play: Patience Until One Side Breaks✅ Price contracting within well-defined H4 range
✅ Clear lower highs and higher lows — coiled, ready to break either side
⚠️ FOMC incoming — possible volatility/surprise rate cut rumors
🎯 Trading Plan:
Short Setup:
If price spikes RH ($105,500) and H4 FVG (~$106,000), then re-accepts back inside the range
Entry on confirmation back below RH/FVG
Target: RL ($103,300) and $102,600
Stop: Above $106,300
Long Setup:
If RL ($103,300) or $102,600 gets swept then reclaimed (M15/H1 SFP or strong reclaim)
Entry on confirmation reclaim of RL/W
Target: RH ($105,500) and beyond
Stop: Below $102,200
🔔 Triggers & Confirmations:
Only enter trades on confirmed sweeps/reclaims or acceptance back inside after spike
No trade if price stays in chop between levels
📝 Order Placement & Management:
Sell Limit: $105,500–$106,000
🛡️ Stop: $106,300
🎯 Target: $103,300 / $102,600
Buy Limit (on sweep/reclaim): $102,600
🛡️ Stop: $102,200
🎯 Target: $105,500 / $106,000
🚨 Risk Warning:
Market coiled — can rinse either side
FOMC could be a catalyst; manage risk, don’t overtrade

BTC – 15min Reversal Structure & Fibonacci ReclaimWe’re currently witnessing a potential short-term reversal on BTC’s lower timeframe after a volume-supported breakdown and sweep of local lows.
🔍 Key Observations:
Price swept liquidity at local lows (~103,929.27)
Entered into a clear reaccumulation box with responsive buyers
Volume profile shows prior POC just above – room for fill
Fibonacci retracement aligns with key structure:
0.5 = 104,372.94
0.618 = 104,268.23
1.0 = 104,816.60 (final high target for this impulse)
📈 Potential Play:
Entry Zone: Just above the sweep candle (104,100–104,200)
Target 1: 0.382 at 104,477
Target 2: 104,816.60
Invalidation: Close below 103,926
🧠 Mindset:
This is a classic liquidity sweep → reaction → reclaim pattern. If BTC flips the 0.5 level with strong momentum, a short squeeze toward the 104.8K area becomes likely.
Great opportunity for scalpers or day traders.
Let me know if you want this turned into a long-form breakdown or sent in another format.

BTC: Short 19/06/25Trade Direction:
BTC Short
Risk Management:
- Risk approx 0.25%
Reason for Entry:
- M30 + M15 Bear Div
- Rejected off Monday low
- Failure to break weekly open
- H1 overbought
- Market is choppy, HTF Bearish
Additional Notes:
- Compounding shorts to maximize edge if trade confirms, currently have a risk free SOL short running. Moving my risk to this.

BTC
BTC is currently in local consolidation. After a liquidity grab on either side, potential entry setups may form via the AMD pattern — but only if key conditions are met.
No setup — no trade. Wait for confirmation.


BTC/USD – Price Rejected at ATH | Key Support in PlaY Bitcoin recently reached a new all-time high at $111,942, but the daily candle closed lower around $109,550, signaling a potential rejection.
On the 1D timeframe, we are now watching the $100,725 level closely. A confirmed break below this support would be a strong signal to consider short positions.
Until then, BTC may consolidate or attempt another push higher. Patience is key here — wait for confirmation.
📌 Key levels:
• Resistance: $111,942 (ATH)
• Support: $100,725 (critical break level)
🧠 Trade safe, manage risk, and follow for more analysis.

HolderStat┆BTCUSD forms a triangleBYBIT:BTCUSDT trades inside a narrowing flag between 104 k and 108 k. A push past 108 k activates the pole projection toward 112–114 k and possibly the ATH rail; rejection sends price to retest 102 k support before the next offensive.

Bitcoin (BTC): Buyers Accumulating Near 200EMA | Pump Incoming?Buyers are showing dominance near the 200EMA, which might lead the price to upper zones and give us a good bounce from here.
What we are expecting is some sort of sideways or neutral movement before the weekend hits, and during the weekend we are looking to see strong upside movement.
Swallow Academy

BTC/USD.4H CHART PATTERN.Based on MY BTC/USDT 4H chart the following analysis and price targets apply:
---
📉 Chart Pattern:
A symmetrical triangle pattern is visible, with price nearing a potential breakdown.
You’ve marked a breakdown scenario, supported by the Ichimoku cloud turning bearish and resistance rejection.
The market has respected both support and resistance trendlines multiple times, increasing pattern validity.
---
🎯 Bearish Targets After Breakdown:
1st Support Target:
Level: Around $98,000
This is the first zone where buyers might step in. It aligns with previous consolidation and structural support.
2nd Support Target:
Level: Around $94,000
This is a deeper support level and likely final target if selling pressure continues.
---
🔍 Summary:
Sell below: ~$104,000 (on breakdown confirmation)
Target 1: ~$98,000
Target 2: ~$94,000
Stop-loss suggestion: Above upper triangle trendline (~$106,500 or above recent high)
Let me know if you want a trading strategy with risk/reward ratio or SL/TP management tips.

Technical Analaysis Setup – #BTC/USDTTechnical Analaysis Setup – #BTC/USDT
#Bitcoin is currently forming a bearish harmonic pattern indicating a potential correction toward key support zones.
📉 The price action suggests the development of a Gartley pattern with projected downside targets around $103,679, $101,931, and possibly extending to $97,419.
A critical resistance zone between $105,000 and $106,000 will be pivotal for either confirming bullish momentum or triggering a bearish reversal.
If BTC fails to break through this resistance and confirms the bearish reversal signal, a deeper decline toward the aforementioned support levels becomes highly probable.
🎯 Target 1: $103,679
🎯 Target 2: $101,931
🎯 Target 3: $97,419

Bitcoin Crash to $93k is Progressing Well! But be Careful Now!I have explained the price action of Bitcoin, shared my insights on what will happen next, and updated my previous idea on $BTC!
Smash the rocket button if you feel the Bitcoin bearish vibe!

BTC: Scalp Long 18/06/25Trade Direction:
Long BTC Scalp BINANCE:BTCUSDT.P
Risk Management:
- Risk 0.1% (very low risk due to market conditions)
- Target approx 0.5% gain
Reason for Entry:
- 0.618 retracement
- Sweep of recent low
- M30 Fair Value Gap tapped (partially mitigated earlier)
- Multi time frame Oversold
- Market structure holding key support level
Additional Notes:
- Confidence level low low likely hood this succeeds but trading my plan
- Very cautious trade in a volatile unpredictable market environment

BTC Short | FVG Setup + RSI Filter | 18.06
Smart Money Concept | Intraday Trade | 1:2 RR
🔍 The setup:
Today I was watching for a short opportunity.
Price reached a key level and formed a bearish FVG — looked clean at first.
But I held off entering because I noticed RSI divergence — a red flag I always consider when expecting a potential level break.
💡 Why it matters:
RSI divergence often signals weakness in momentum.
For me, it's a key filter that helps avoid fake breaks — this was a good example of how I apply it.
📈 What happened next:
Price moved up to test the 1H FVG (zone #2) and formed another FVG slightly lower.
That second one was my entry point for the short.
🎯 Target:
I exited at a 1:2 risk-reward, which is my minimum.
The day was ending, and I didn’t want to hold the position longer — I’m not convinced the down move would continue cleanly (possible wicks or traps).
🤔 Question to the community:
How do you filter FVG entries?
Do you also use RSI or wait for structure shifts?
And what’s your outlook on BTC from here?

Bitcoin's Latest Market AnalysisThe recent escalation of the situation in the Middle East has triggered a surge in risk - aversion sentiment across global financial markets. As a risk - on asset, Bitcoin has faced certain selling pressure in a market environment dominated by risk - off sentiment.
From a technical chart perspective, Bitcoin has made multiple attempts to break through the key resistance range of $108,800 - $110,000 in the recent period, but has encountered significant selling pressure each time. On the other hand, the area between $105,000 - $103,000 forms an important support zone. When the price drops to this area, it attracts some bargain - hunting capital inflows, which provides a certain degree of support for the price.
The price of Bitcoin is expected to fluctuate within a relatively narrow range. If it can hold the key support level of $105,000 and the bulls can regain strength, the price is likely to rebound to the range of $106,000 - $108,000. However, if the $105,000 support level is effectively breached, it may trigger additional selling pressure, potentially driving the price down further to $103,000. In extreme cases, if market panic sentiment spreads further, it may test the psychological threshold of $100,000.
you are currently struggling with losses,or are unsure which of the numerous trading strategies to follow,You have the option to join our VIP program. I will assist you and provide you with accurate trading signals, enabling you to navigate the financial markets with greater confidence and potentially achieve optimal trading results.

Bearish btcLooking at the market and what is going on around the globe 🌍
From my technical stand point btc would drop (80k)

Bitcoin Double TopDouble top formation and now in support line and support trendline
if this line break, it will give rug and rug in altcoin, and maybe bitcoin can heading to 94k
But if bitcoin can solid above the lines, we can expect sideway with resist in 110k

BTC Accumulated Over 104K💎 BTC PLAN UPDATE (June 16)
NOTABLE BITCOIN (BTC) NEWS:
At least four publicly listed U.S. companies announced plans on Tuesday to significantly increase their cryptocurrency exposure, committing a combined $844 million in new investments. The move reflects a growing corporate appetite for Bitcoin and other digital assets as alternative stores of value and growth opportunities.
The most substantial commitment came from Hong Kong-based ready-meal provider DDC Enterprise Ltd, which disclosed three separate purchase agreements totaling $528 million. The entire sum is earmarked for expanding the company’s Bitcoin reserves.
Technical analysis angle
DAY DAY: Bitcoin is united when uncertainty takes root
Bitcoin price moves widely at about $ 106,300 at the time of writing the article after failing to reach the $ 107,000 resistance threshold on Monday. Its technical structure, as observed from the daily chart below, shows the trend of price increases.
The dynamic convergence indicator (MACD) has maintained the signal to be confirmed on Thursday when the blue MACD line cut under the red signal line. This signal often encourages traders to consider reducing exposure to Bitcoin, thereby creating a dynamic motivation.
The relative power index (RSI) highlights the discount trend when it is sloping, approaching the middle line 50. The movement is below this important neutral level that can catalyze the downtrend, bringing the average exponent dynamic line of 50 days (EMA) at $ 103,064, the 100 -day EMA road at $ 98,783 and the 200 -day EMA road at $ 93,083 to become expected targets.
==> Comments for trend reference. Wishing investors successfully trading

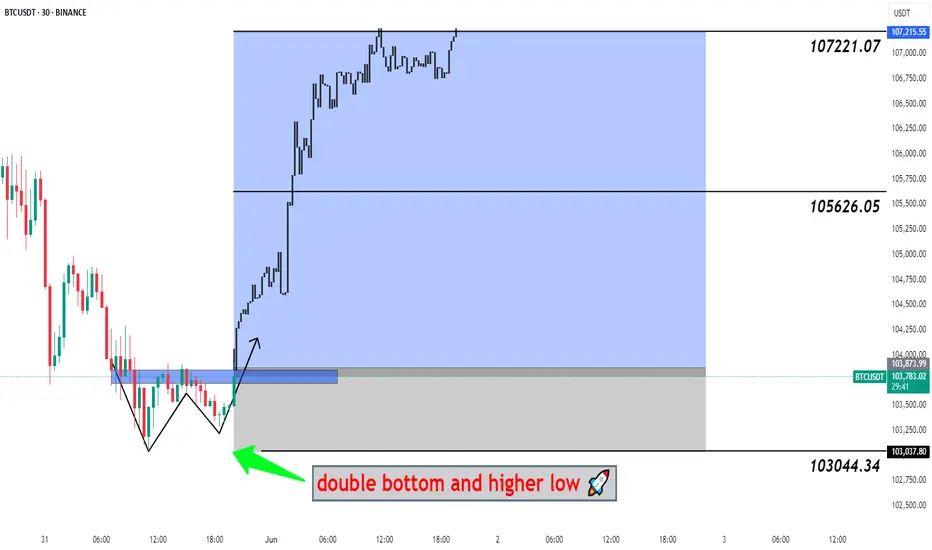
#BTCUSDT Big Pump Next Hour - Bitcoin, BTCUSD, BTCUSDT 📉 Double Bottom Pattern Forming – Potential Reversal Setup
The current price structure is showing signs of a Double Bottom – a classic bullish reversal pattern. After an extended downtrend, this pattern suggests that the market may be preparing for a trend reversal from this key demand zone.
🔹 Trade Setup
Entry, Targets, and Stop Loss (SL) are marked on the chart.
Entry: Upon breakout confirmation above the neckline.
Stop Loss: Just below the recent swing low to manage downside risk.
Targets: Calculated using the measured move method from the bottom to the neckline .
🔹 Risk & Money Management (Professional Approach)
To maintain consistent profitability and protect capital, strict risk management is essential. For this setup:
🔸 Position Sizing: Based on a fixed % of total capital (typically 1–2% of account equity per trade).
🔸 Risk-to-Reward Ratio: Minimum of 1:2, ideally higher.
🔸 Stop Loss Discipline: No arbitrary changes after entry. SL only adjusted for breakeven or trailing stops once price moves favorably.
🔸 Trade Management: Secure partial profits at key levels, trail stops as structure forms.
🔸 Capital Allocation: Avoid overexposure. Trade fits within overall portfolio strategy.
💬 Let the setup come to you. React, don’t predict.
🔁 Like, comment, or share your thoughts below!
BINANCE:BTCUSDT BITSTAMP:BTCUSD COINBASE:BTCUSD BINANCE:BTCUSDT.P INDEX:BTCUSD CRYPTOCAP:BTC.D CRYPTO:BTCUSD BYBIT:BTCUSDT.P BINANCE:BTCUSD
BTC SCALP TradeWait for the entry then take with small amount no high risk must use SL. If BTC don't retrace towards 106.5k in coming hours then don't take risk on shorting it will breakout towards 113k

Bitcoin STANDING..bitcoin now is standing on monthly pivot and hold that as the support.
3rd pivot's resistance is at 124k is reachable in few weeks.
