do not SHORT Bitcoin with 20XA consolidation range happens when the market trades sideways, in a neutral capacity. This sideways trading is neither bearish nor bullish, thus neutral. The bearish or bullish tendencies can only be defined based on the broader market structure.
If the consolidation range develops coming from a major drop, you can say that the market is bearish and the consolidation a bearish consolidation even if the breakout happens to the upside. Once it happens to the upside we can say that a reversal developed but the tendencies were bearish nonetheless.
If the consolidation range develops coming from a major rise, you can easy say while being correct that the market is bullish and the consolidation phase a bullish one, because of the bigger structure, previous price action and the chart.
Bitcoin is consolidating with bullish tendencies but there is a boundary which we call resistance and another boundary which we call support, this is the trading range. When the market is ranging, this is when margin traders lose the most because the trend remains hidden and money tends to be made when the market is in a clear trend.
Whenever the upper boundary gets challenged we get a retrace and a test of support. Whenever the lower boundary gets tested prices recover and move back up. This process gets repeated for as long as it is needed to remove all the weak hands, most of the signals are pure noise.
This is the situation in which we find Bitcoin today. Ultra-bullish but sideways and anything can happen short-term. Do not SHORT Bitcoin with 20X. You might end up with some fast and easy profits.
Thank you for reading.
Namaste.
BTCUSDT.3L trade ideas

BTC Weekly Chart: DOWNJuly 1st 2025
BTC Weekly Chart: Down
Potentially forming a local top on the wrong shoulder.
See October-November 2021.
Be Patient.

BTC - Will the Bearish Channel continue?Market Context
After a strong impulsive rally earlier in the year, BTC has been trading within a descending channel on the daily timeframe. This corrective structure suggests a period of consolidation and redistribution, as price oscillates between the channel's boundaries. The repeated rejection from the upper trendline and the inability to break through key highs reinforce the bearish bias in this structure.
Buy Side Liquidity Sweep Potential
Price is currently positioned just beneath a relatively clean swing high, sitting above the mid-range of the channel. This high represents a clear area of Buy Side Liquidity—stop losses from short positions and pending breakout orders from longs are likely clustered there. An engineered sweep of this high would serve as a strategic move for larger participants to collect liquidity before driving price lower.
Fair Value Gap as a Pivot Point
Beneath current price lies a Fair Value Gap—a visible inefficiency formed during a fast upward move earlier in the structure. This Gap remains unfilled and offers a compelling target for price once the Buy Side Liquidity Sweep occurs. It represents a logical zone for price to rebalance before deciding on continuation or reversal. Should price break below the Gap cleanly, it would confirm the bearish intent and potentially accelerate toward the lower bounds of the channel.
Channel Continuation Structure
The overall geometry of the channel remains intact, and the price respecting both upper and lower boundaries strengthens the likelihood of a continuation toward the downside. If the Buy Side Liquidity Sweep and subsequent rejection occur, the market could be poised for another leg lower—possibly seeking the next structural support closer to 90,000 or even toward the lower extremities of the channel around 80,000–82,000.
Final Thoughts
This chart reflects classic price delivery behavior: corrective structure, engineered liquidity sweeps, and the magnetic pull of inefficiencies like Fair Value Gaps. Whether you’re actively trading or simply observing, this is a clean, educational setup to learn from.
If this breakdown helped you see the market a bit clearer, I’d really appreciate a like. And feel free to share your thoughts or counterviews in the comments—your insights make the analysis even more valuable.

BTC - 108k?BTC looks it has power to go more up, remember the more it goes up the more shorts are active, but 108,500 good look for shorts as well!

Lingrid | BTCUSDT possible Channel Break - Upside Surge The price perfectly fulfilled my last idea . BINANCE:BTCUSDT is pulling back slightly after rejecting the descending red trendline near the 108,000 level, while remaining above the breakout zone around 105,000. The structure suggests a potential bullish continuation if the price holds this level and forms a higher low. A successful breakout above 108,000 could ignite a move toward the 111,000 resistance band.
📈 Key Levels
Buy zone: 105,000–105,300
Sell trigger: breakdown below 105,000
Target: 111,000
Buy trigger: breakout and retest above 108,000 with strong momentum
💡 Risks
Failure to hold 105,000 reopens path to 98,700
Bearish rejection at 108,000 could maintain lower high structure
Weak volume breakout may lead to a bull trap under 111,000
If this idea resonates with you or you have your own opinion, traders, hit the comments. I’m excited to read your thoughts!

BTC 26.06.25This could be the range i was waiting for to create the 3rd tap of the accumulation model later. Yesterday we had a mini model 1 at NY open which could have had the intention to be the starting point of the new range. I am now watching for new deviations which then would form a bigger range. There is nothing but liquidity until 104.536$ which would be a perfect target for a range low, but until there are no confirmations this only is an expectation. If the accumulation model is already complete, like i mentioned in my last post, then the target becomes the range high (110.652$).

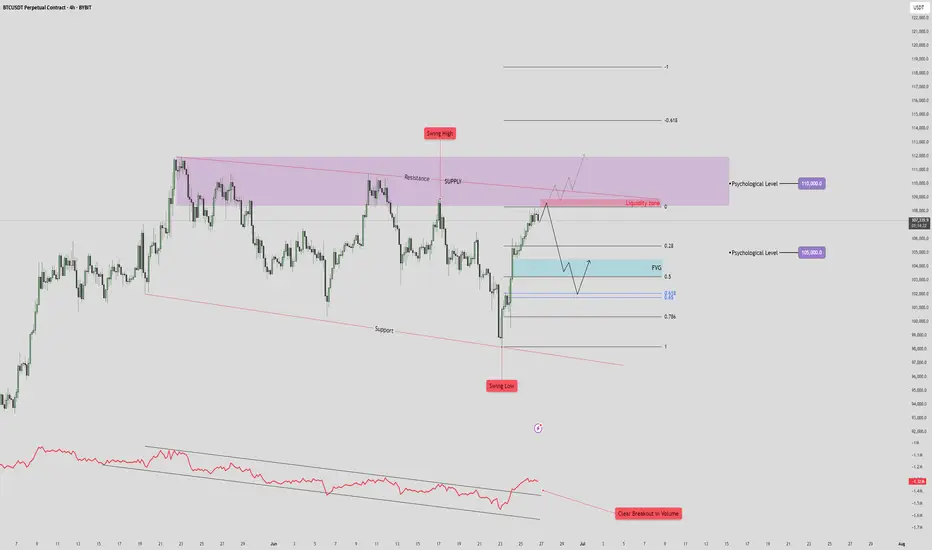
BTC/USDT Drop to 101k?🧠 High Time Frame Context
Trend: Consolidation within a broad range (support and resistance clearly defined).
Key Psychological Levels:
105,000 USDT – minor level, acting as a magnet in short-term PA.
110,000 USDT – major supply confluence and liquidity target.
🟪 Supply & Resistance Zone
Zone: Marked in purple (108.5k-112k).
Key Observation:
Swing high formed inside this zone, indicating liquidity trap.
Potential fake-out or strong rejection from this area.
Strong confluence with a descending resistance trendline, adding to the selling pressure.
🔵 Fair Value Gap (FVG) & Retracement Targets
FVG identified just below the current price (~103.5k-104.5k).
Price is projected to:
Reject from the current high.
Drop to fill the FVG zone.
Possibly bounce between FVG and Fibonacci retracement levels:
0.5
0.618
0.786
🔴 Volume & RSI Divergence
Volume breakout is noted on the last push down (bottom red annotation), followed by a retrace.
OBV shows bullish divergence with price:
🔻 Support Structure
Lower red trendline is a key long-term support.
Previous swing low aligns with this trendline – buyers showed strong interest here.
If FVG fails to hold, expect a retest of this trendline near 97,000–98,000.
📈 Likely Scenarios
Base Case (Neutral-Bearish):
Price rejects current zone (~107,000).
Pullback into FVG (101–104K).
Bounce to 105K (minor resistance), then decide next direction.
Bullish Breakout:
If price breaks and closes above 110K, it invalidates supply zone.
Opens door to 115–118K range.
Bearish Breakdown:
Fails FVG zone.
Tests previous swing low and support (~97K).
Below that, structure becomes macro bearish.
🧩 Summary
Short-Term: Retracement into FVG likely. Monitor reaction.
Medium-Term: Bearish bias while price is below 110K.
Invalidation for bears: Clean break and hold above 110K.
Bitcoin BTC price analysis BTC.D and events calendar for JulyToday is the last day of the month and the last day of the second quarter, so there may be some volatility in the markets between 🐂 VS 🐻
💰 The CRYPTOCAP:BTC chart shows an interesting picture — the price has reached the upper limit of the consolidation channel, and now:
1️⃣ The scenario with an upward breakout is quite clear: a breakout from the channel upward and consolidation above $108-110k= a move to $125k during July.
2️⃣ A correction to $99k will mean that buyers have taken control of the OKX:BTCUSDT price, preventing it from updating its lows. This will be a clear signal to buy, because further growth is inevitable.
3️⃣ A deep correction to $91,660 (filling the GAP that formed on the CME BTC chart) or slightly lower. This is the last “unclosed” GAP, which, according to TA rules, should be filled for a full-fledged growth trend to begin.
So which scenario is closer to your heart, which one do you believe in?
Or write your version of events in the comments.
Interesting observations to think about:
◆ Over the past two weeks, the inflow of funds to #BTCETF has exceeded $5 billion, but the price of #BTCUSD on CEX exchanges has not been able to “break out” upward. Is this just ETF "property of numbers", or are spot #Bitcoin sales that strong?
◆ The BTC.D indicator has reached a critical level of 66%, and it will be interesting to see whether it will give altcoins some breathing room next month.
(If there are a lot of likes and comments under the idea, we will additionally describe our thoughts on BTC.D and USDT.D.)
◆ SP 500, by the way, has updated its highs, and the last few months on the stock market are very similar to the beginning and middle of the COVID-19 pandemic in 2020.
◆ And in principle, July promises to be very eventful:
👉 By July 9, Trump is expected to make a statement regarding the tariff wars with the rest of the world, which he has put on hold.
👉 July 18 marks the beginning of Mercury retrograde, which “influences” people's behavior and ‘superstitions’ and forces them to be “more cautious” when making trading decisions (and trading bots don't care about emotions and beliefs)
👉 And on July 30, there will be a FOMC meeting, where Mr. Powell may announce a rate cut, as the US is in a recession, which is time to acknowledge.
If we have forgotten anything, please add it in the comments!

Bitcoin - Drop to 98,922 then a big pump! (Buy here)Bitcoin is falling again mostly because of Trump's aggressive attack on Iran. But technical analysis in general is very strong, and we can find strong levels where smart money has their buy orders. You, as a fish, always want to trade with big whales. Bitcoin is approaching an extremely strong level, which is the bottom of the bullish flag and 1:1 Fibonacci extension. This level is exactly at 98,922 USDT and this is where you definitely want to put your buy orders. I am confident we will see a significant pump from this level.
From the Elliott Wave point of view, Bitcoin is finishing a major ABC ZigZag correction. A classic textbook ZigZag pattern has a 1:1 fib extension between its waves. At this point we don't know if this is going to be the bottom on Bitcoin or not, because ZigZag can transform into a complex WXYXZ Triple three corrective pattern. Of course there are no patterns with 100% probability of success, but this ABC seems to be very probable, at least for a short-term bounce.
Now the most important question - where to take profit? If we buy at 98,922 we definitely want to take profit at a strong resistance on the way up. In the next analysis I will share with you the best levels to sell and potentially short Bitcoin, so this will be very exciting, do not forget to hit the boost button and follow me! But I can already see a strong level around 104,500.
Trading tip at the end: Before entering a trade, you must know where your profit target is and where your stop loss is. Write a comment with your altcoin + hit the like button, and I will make an analysis for you in response. Trading is not hard if you have a good coach! This is not a trade setup, as there is no stop-loss or profit target. I share my trades privately. Thank you, and I wish you successful trades!

Bitcoin Roadmap: Key Levels to WatchBitcoin( BINANCE:BTCUSDT ) managed to pump as I expected yesterday , of course, the main catalyst could have been the ceasefire announcement between Iran and Israel , which had a major impact on high and medium risk assets in the financial markets .
Bitcoin is once again moving near the Heavy Resistance zone($110,720-$105,820) and the Resistance zone($107,520-$106,100) after breaking the Resistance lines .
In terms of Elliott Wave theory , it seems that given Bitcoin’s bullish momentum , Bitcoin has completed the main wave 3 and is currently completing the main wave 4 on the 1-hour time frame . The corrective wave structure of wave 4 could be a Double Three Correction(WXY) .
I expect Bitcoin to start rising again near the Support zone($104,380-$103,060) , 50_SMA(Daily) , Support lines , and Cumulative Long Liquidation Leverage($104,412-$103,812) to rise at least to the Potential Reversal Zone(PRZ) and Resistance lines .
Note: Stop Loss(SL)= $102,600 = We can expect more dumps.
Please respect each other's ideas and express them politely if you agree or disagree.
Bitcoin Analyze (BTCUSDT), 1-hour time frame.
Be sure to follow the updated ideas.
Do not forget to put a Stop loss for your positions (For every position you want to open).
Please follow your strategy and updates; this is just my Idea, and I will gladly see your ideas in this post.
Please do not forget the ✅' like '✅ button 🙏😊 & Share it with your friends; thanks, and Trade safe.

BITCOIN I Daily CLS I KL - OB I Target ATHHey, Market Warriors, here is another outlook on this instrument
If you’ve been following me, you already know every setup you see is built around a CLS range, a Key Level, Liquidity and a specific execution model.
If you haven't followed me yet, start now.
My trading system is completely mechanical — designed to remove emotions, opinions, and impulsive decisions. No messy diagonal lines. No random drawings. Just clarity, structure, and execution.
🧩 What is CLS?
CLS is real smart money — the combined power of major investment banks and central banks moving over 6.5 trillion dollars a day. Understanding their operations is key to markets.
✅ Understanding the behaviour of CLS allows you to position yourself with the giants during the market manipulations — leading to buying lows and selling highs - cleaner entries, clearer exits, and consistent profits.
🛡️ Models 1 and 2:
From my posts, you can learn two core execution models.
They are the backbone of how I trade and how my students are trained.
📍 Model 1
is right after the manipulation of the CLS candle when CIOD occurs, and we are targeting 50% of the CLS range. H4 CLS ranges supported by HTF go straight to the opposing range.
📍 Model 2
occurs in the specific market sequence when CLS smart money needs to re-accumulate more positions, and we are looking to find a key level around 61.8 fib retracement and target the opposing side of the range.
👍 Hit like if you find this analysis helpful, and don't hesitate to comment with your opinions, charts or any questions.
⚔️ Listen Carefully:
Analysis is not trading. Right now, this platform is full of gurus" trying to sell you dreams based on analysis with arrows while they don't even have the skill to trade themselves.
If you’re ever thinking about buying a Trading Course or Signals from anyone. Always demand a verified track record. It takes less than five minutes to connect 3rd third-party verification tool and link to the widget to his signature.
"Adapt what is useful, reject what is useless, and add what is specifically your own."
— David Perk aka Dave FX Hunter ⚔️

Bitcoin Fractal, increase to $116k Hi Everyone☕👋
BINANCE:BTCUSDT
Been such a long time since I posted. Today I'm looking at BTCUSDT, and I'm looking at the previous all time high cycle and what we were seeing (the pattern aka fractal).
Here's why we're likely going a little higher.
First correction of -32%
Followed by first peak, ATH
Correction, then the second peak and the REAL ath. Which is where we likely are:
Interesting to note that the previous time, the second ath was NOT THAT MUCH HIGHER. This should be considered to manage expectations in terms of how high we can go. Anything above +6% is a bonus.

Bitcoin ready to move towards 85,000When a trend line is broken, it suffers for a few days and then moves
Tp1:85000
To2:80000
2p3:63000

Bitcoin Bounced Right Where It ShouldBitcoin continues to respect the script — breakout, clean retest, and now holding strong.
The 50 EMA has been a reliable dynamic support throughout the entire uptrend, and once again, it helped catch the recent dip. Price has now successfully retested the breakout zone and is starting to bounce.
Structure looks healthy, momentum is building, and unless the support fails, the next leg up could be just around the corner.
Simple setups. No noise. Just trend.
DYOR, NFA

BEst long on Btc is at $104 600CRYPTOCAP:BTC
Our plan is still bullish
But price reached VAH
That's why some pullback is possible
$104 600 is key zone for me. POC + VWAP. I`ll take a long trade in a case of local confirmation.

Bitcoin Recovers Above 105,000, Extremely Bullish +AltcoinsBitcoin produced only two days red, a bear-trap, and is now trading daily back above $107,000, an extremely bullish development.
Good morning my fellow Cryptocurrency trader, I hope you are having wonderful day.
The altcoins market bull market is confirmed and what Bitcoin is currently doing gives further strength to the bullish case and bias. It will be only a matter of days before the entire altcoins market turns strongly bullish with major momentum.
The range is still valid though, $100,000 - $110,000. But this time around the upper-boundary is likely to break and the last ATH tested, a new all-time high is even possible and also highly probable which is what will propelled the altcoins to hit multi-year highs and some even new all-time highs. Many pairs will move ahead.
With each passing day, the Cryptocurrency market will continue to heat up. We can expect growth long-term.
The 2025 bullish cycle started with the 7-April market low. The start of the third wave started 22-June and should go for 2-3 months. Then we will have a correction, the fourth wave followed by one final jump, the fifth wave.
We can expect growth now and all through late 2025. The entire period will be bullish. Only when the marketwide correction comes there will be a pause but many pairs will grow even at this point.
Choose wisely. Low risk vs high potential for reward.
Aim high. Focus on the long-term.
Thanks a lot for your continued support.
Namaste.

Bitcoin Price Analysis! What's Next?Bitcoin Price Analysis! What's Next?
From our last analysis, Bitcoin increased from 107K to 108.5K
The price reached the limits of the pattern so far making everything more difficult because it increased, but with very low volume.
This time, BTC added some more data.
You may watch the analysis for further details
Thank you!

Mastering Inverse Fair Value Gaps (IFVG) - How to use them?In this guide, I’ll explain the concept of the Inverse Fair Value Gap (IFVG), how it forms, and how you can use it to identify high-probability trading opportunities. You'll learn how to spot the IFVG on a chart, understand their significance in price action, and apply a simple strategy to trade them effectively.
What will be discussed?
- What is a FVG
- What is an IFVG
- What is a bullish IFVG
- What is a bearish IFVG
- How to trade the IFVG
-------------------------------
What is a FVG?
A FVG is a technical concept used by traders to identify inefficiencies in price movement on a chart. The idea behind a fair value gap is that during periods of strong momentum, price can move so quickly that it leaves behind a "gap" where not all buy and sell orders were able to be executed efficiently. This gap creates an imbalance in the market, which price may later revisit in an attempt to rebalance supply and demand.
A fair value gap is typically observed within a sequence of three candles (or bars). The first candle marks the beginning of a strong move. The second candle shows a significant directional push, either bullish or bearish, often with a long body indicating strong momentum. The third candle continues in the direction of the move, opening and closing beyond the range of the first candle. The fair value gap itself is defined by the price range between the high of the first candle and the low of the third candle (in the case of a bullish move), or between the low of the first candle and the high of the third (in a bearish move). This range represents the area of imbalance or inefficiency.
-------------------------------
What is an IFVG?
An Inverse Fair Value Gap (IFVG) occurs when a traditional Fair Value Gap (FVG) is not respected by price, and instead of acting as a support or resistance zone, price breaks through it with strength. Normally, a Fair Value Gap represents a price imbalance left by a strong move, and when price returns to this area, it often reacts by respecting the gap, bouncing off it or reversing, because it's seen as a high-probability level where orders may rest.
However, in the case of an IFVG, price does not respect this imbalance. Instead, it slices through the FVG in the opposite direction, showing that the initial momentum behind the imbalance has weakened or reversed. This breach is a strong indication that market sentiment is shifting. What was once a zone of strength now becomes invalid, and this failed reaction signals that the opposite side of the market (buyers or sellers) has taken control.
The IFVG highlights a key transition in momentum. It tells traders that the prior bias, bullish or bearish, is breaking down, and the new dominant force is pushing price beyond levels that would typically hold. This makes the IFVG useful not only as a sign of failed structure but also as a potential confirmation of a trend reversal or strong continuation in the opposite direction. Essentially, where an FVG usually acts as a wall, an IFVG is what’s left after that wall gets knocked down.
-------------------------------
What is a bullish IFVG?
A bullish Inverse Fair Value Gap (IFVG) occurs when price breaks through a bearish Fair Value Gap (FVG) instead of respecting it. In a typical bearish FVG, the expectation is that when price retraces into the gap, it will react to the imbalance, usually by reversing lower, as the area represents previous selling pressure or inefficiency caused by aggressive sellers.
However, when price does not react bearishly and instead breaks cleanly through the bearish FVG, it signals a shift in market sentiment and momentum. This breakout through the imbalance suggests that buyers are now in control and that the bearish pressure in that zone has been absorbed or invalidated. What was once considered a resistance area is now being overpowered, often leading to continued bullish movement.
-------------------------------
What is a bearish IFVG?
A bearish Inverse Fair Value Gap (IFVG) occurs when price breaks through a bullish Fair Value Gap (FVG) instead of respecting it. In a normal bullish FVG, the expectation is that when price returns to the gap, it will act as support and prompt a move higher, as this area represents a previous imbalance created by strong buying pressure.
However, when price fails to respect the bullish FVG and instead breaks down through it, this signals a shift in momentum to the downside. The anticipated support fails to hold, suggesting that buyers are no longer in control or that their efforts have been overwhelmed by aggressive selling. This kind of move transforms the bullish FVG into a bearish signal, as it confirms weakness in what was previously considered a demand zone.
-------------------------------
How to trade the IFVG?
Trading the Inverse Fair Value Gap (IFVG) requires patience, precision, and clear confirmation of a shift in momentum. The process involves waiting for key conditions to form before entering a trade. Here's how to approach it step-by-step:
First, you need to wait for a liquidity sweep. This means price must take out a recent high or low, typically a short-term liquidity pool, trapping traders on the wrong side of the market. This sweep sets the stage for a potential reversal and indicates that the market is ready to shift direction.
After the liquidity sweep, watch for a 1-minute Fair Value Gap (FVG) to form and then get broken in the opposite direction. This break is crucial, it’s what creates the Inverse Fair Value Gap. The invalidation of this initial FVG confirms that momentum has switched and that the market is no longer respecting the previous imbalance.
Once the IFVG has formed, your entry comes on the close of the candle that breaks and closes beyond the IFVG, above it in a bullish scenario, or below it in a bearish one. This close confirms that the gap has not held and that price is likely to continue in the new direction.
Place your stop loss below the low (for a bullish setup) or above the high (for a bearish setup) of the structure that formed the IFVG. This gives you protection just beyond the level that would invalidate the setup.
-------------------------------
Thanks for your support.
- Make sure to follow me so you don't miss out on the next analysis!
- Drop a like and leave a comment!

Short BTC, it is about to retrace and test 100000 again!As BTC gradually fell back, the rebound did not stand above 110,000 in the short term, proving that there is strong selling pressure above, and the trend line formed by the technical high point 111,000 and the second high point 110,000 formed an important resistance area, which limited the rebound space of BTC and strengthened the demand for BTC's short-term retracement.
According to the current trend, the short-term oscillation bottom area of 106,000 may be broken at any time. Once it falls below the oscillation area, it may arouse a certain degree of profit-taking chips and stimulate BTC to accelerate its decline. I think BTC will at least test the 105,000-104,000 area again during the retracement, and may even test the 100,000 integer mark again.
Therefore, shorting BTC is still the preferred option for current short-term trading.
Consider shorting BTC in the 108,000-109,000 area, and the target area in the short term is 104,500-103,500. After breaking this area, the target can be extended to 101,000-100,000.
BINANCE:BTCUSDT BINANCE:BTCUSDT BITSTAMP:BTCUSD

Bitcoin Major Dip Upcoming | Next Move BEARISH ?Bitcoin experienced a sharp intraday pullback from ~$107.6K down to ~$105.8K, influenced by new U.S. Senate legislation discussions targeting crypto taxation and exchange regulation. This news injected short-term volatility and prompted a minor sell-off.
However, BTC closed June at its highest monthly level ever (~$107.1K), maintaining a strong macro uptrend. Institutional interest remains robust, with over $4.5B in inflows into BTC ETFs over the past two weeks. On-chain data shows ~98% of BTC supply is in profit, reflecting underlying strength—though short-term caution is warranted due to possible profit-taking.
📉 Technical Analysis (Chart Reference)
🔹 Key Levels:
• Resistance: $107,500 / $112,000
• Support: $105,000 / $103,000 / $100,000
🧠 Observations from the Chart:
• Resistance Zone: Price struggled to break and sustain above $107,500 despite multiple Break of Structure (BoS) attempts.
• Support Zone: Strong horizontal support is established around the $105,000 level—price is currently testing this.
• Market Structure: Multiple Change of Character (ChoCh) patterns suggest a short-term bearish trend, likely driven by macro news impact.
• Upcoming Dip: Chart annotations highlight an expected pullback into the $104K–$105K region before a potential bounce.
• Trendlines: The downward-sloping trendline indicates corrective pressure, but the broader ascending channel remains intact.
📈 Technical Outlook
• Trend: BTC is consolidating within a broad ascending structure on higher timeframes. The current dip aligns with a healthy retest.
• Momentum: 4H RSI and MACD show cooling, signaling temporary bearish momentum.
• Watch Zone: $103K–$105K is key for potential bounce. Losing $100K would invalidate short-term bullish structure.
Next Move Prediction
Short-Term (1–5 Days):
🔻 Expect continued downside/consolidation toward $103K–$105K. High chance of buyer re-entry around support.
Medium-Term (2–4 Weeks):
📈 Bullish continuation toward $112K–$115K if ETF inflows remain steady and no major regulatory shocks occur.
💼 Trading Plan
• Buy Zone: $103,000–$105,000 (scale in during dips)
• Target 1: $112,000
• Target 2: $115,000
• Stop Loss: Below $100,000 (daily close)
Despite short-term news-driven volatility, Bitcoin’s macro trend remains bullish. As long as the $100K support holds, this is likely a dip-buying opportunity. July often brings strong seasonal performance, and ETF demand may act as a major bullish catalyst. Stay alert for news and volume confirmation before committing to entries.

Waiting for the Liquidity Flush – Will We Get That Drop or a StoCurrently holding a short position and have been waiting for a decent liquidity flush towards my TP zone for almost a day now. The thing that bothers me is how slow the price action is—it's grinding lower, but at the same time, building up a new liquidity shelf just above my entry.
This makes me concerned that we might see a quick liquidity sweep to the upside (taking out stops, possibly including mine) before any real move down happens. The area around my TP is loaded with liquidity, but the market seems hesitant to make that push.
What’s your opinion—are we likely to get that clean drop soon, or should we brace for a fake-out and stop hunt first?

BTCBtc was trading inside falling wedge since a weak. it has cleared it now and has very good possibility of pumping hard to 112k

Bitcoin Playing Below The Crucial Area, Im Out of The Market🥱 I’ve been active in this market since 2017, and I’ve never seen it this dull and exhausting.
👉 Bitcoin has been ranging around the $110K level for nearly six months now, and once again, it’s trading below a critical resistance level. In my opinion, staying out of the market and just observing is still the best approach.
📥 Trading in such market conditions can be mentally draining, which is why I prefer to stay on the sidelines and simply watch for now
📉 Any rejection from this area could lead to a price drop down to the 95K zone. Although there’s a possibility of a buying pressure up to the 115K level as a shadow, even if this scenario plays out, it won’t change my overall outlook on Bitcoin
