BTC – Stop Hunt at the Edge of ValueThis is what a liquidity raid looks like.
Price just swept the bottom of the range, tapped into the low-volume zone (as seen on the volume profile), and reclaimed — classic sign of a trap sprung.
Key points:
The downtrend line labeled “comp” = compression — bulls forced to capitulate into a thin zone
High probability deviation with stop run and reclaim — this fuels the next move up
The green box shows risk-defined entry off the sweep low
Targeting the prior high: 106,787
Volume imbalance filled = no inefficiency above — price can now move cleanly
Execution mindset:
Trap spring → retrace into structure → expansion
Risk is clear, liquidity is engineered, structure remains
Late shorts just became the fuel.
Watch the reclaim of the box top. If that flips support, we ride momentum.
📈 For more setups like this — including pre-breakout traps — check the description in the profile.
BTCUSDT.3L trade ideas

BTC Bitcoin VAL, S1, Weekly, 1.27 confluence at $102,700BTC Bitcoin VAL, S1, Weekly, 1.27 confluence at $102,700
If we do drop more, this is where I'm looking to buy. Lots of support in this area for a bounce back to the POC. A rejection of POC means we may be looking at 100k. Get past it, then target is VAH around 106k.

Bitcoin Eyes $110K or $94K – Depends on Global HeadlinesBitcoin (BTC/USDT) – 4H Technical Outlook
📅 Update: June 18, 2025
🧭 Current Market Status:
Bitcoin is currently trading around $105,296, sitting in a tight consolidation above key support ($104K). The price has respected both demand and supply zones over the past few sessions but remains sensitive to macro-driven events, especially geopolitical instability.
We can clearly see BTC is caught between strong support around $100K–102K and resistance around $108K–110K, awaiting a directional break.
📊 Key Technical Levels:
Resistance Zones (Red):
$108K–110K – intraday resistance block
$112K – short-term breakout target
$114K–116K – final bullish extension zone
Support Zones (Green):
$102K–104K – immediate demand
$100K – psychological round number + previous breakout base
$98K / $96K / $94K – downside targets if panic sets in
🔺 Scenario 1: No US-Iran War (Bullish Case)
If no escalation occurs:
BTC could bounce from current support or even dip to $102K before pushing higher.
A clean break above $108K may trigger a move toward $112K and then $114K–116K.
Stochastic shows bullish divergence forming (see trendline), supporting a possible upside breakout if momentum strengthens.
🟢 Look for breakout candle + volume confirmation above $108K.
🔻 Scenario 2: US-Iran War Escalates (Bearish Case)
If military conflict breaks out:
Safe-haven rotation may favor cash or gold short-term; BTC could lose traction.
Breakdown below $102K may lead to panic drop toward $98K, followed by potential flush into $94K.
Watch for failure to hold $100K — this would mark a major shift in sentiment.
🔻 BTC has historically struggled during initial shock of war-related uncertainty.
🔁 Neutral/Bounce Scenario:
If price holds $104K–102K range but no major trigger emerges, expect sideways consolidation.
Traders can scalp range levels until a confirmed breakout or breakdown.
🛡️ Risk Management Notes:
BTC remains headline-driven — adjust position size based on volatility spikes.
If trading directionally, place tight SLs below key support or above resistance, depending on side.
Consider hedging with stablecoins or options if holding long-term spot.
📢 If you found this analysis valuable, kindly consider boosting and following for more updates.
⚠️ Disclaimer: This content is intended for educational purposes only and does not constitute financial advice.

Everybody is trying to sell due too todays news No one want too risk trading today whiles news are inbound for today

My thoughts on Bitcoin long-term, as well as mid- to short-termLONG-TERM / THE BIG PICTURE:
Regarding the big picture, we couldn’t be more bullish. We’re currently fighting our way through the cycle as usual—despite the fact that this cycle has had way too many chop phases, flushing out far too many participants.
Just a few weeks ago, we got our bullish crossover on the weekly MACD—a signal that has triggered a major BTC rally every single time this cycle.
At no point in this cycle has #BTC been overheated. The blow-off top is still coming.
LOCAL PRICE ACTION:
CRYPTOCAP:BTC remains in this vertical ascending channel and remains macro bullish what imo is another huge re-accumulation range lasting more than 200 days since November, that will lead to an impulsive breakout TO THE UPSIDE in the weeks to come
MACRO LANDSCAPE:
Due the last crash we potentially got an bulllish structure, wich if the price breaks the high at $110.000 is confiraed and can bring us to 120k on #Bitcoin
On the lower TF we currently see an oversold RSI + a bounce from the 0.667 level
RECOMMENDATION:
Watch the high at 110k and the low at 100k, we have to break either one of these 2 levels.
Have an eye on the current conflict with israel & iran and dont forget the FOMC meeting tmwr, where we can expect some important news due the current situation
Either way, I'm long and mid-term bullish despite the current accumulation by long-term holders (which just peaked)...
Always watch the big picture from above - maintain perspective and don't focus too much on smaller timeframes...
But most importantly: Survive.
Thanks for reading, let me know your thoughts about the current market situation & price action👇

Bitcoin sell short go 83kBitcoin is ready for a heavy drop, just sell.
Do not take any buy or sell trades.

Technical Analysis of Bitcoin
From a market analysis perspective, the daily chart of the large cycle has closed with consecutive declines, the price is below the moving averages, and the indicator is in a death cross, indicating a bearish trend. However, it is necessary to be wary of the stimulation from the news and data caused by the current unstable national situation. In operation, risk control should be paid attention to, and the moving average pressure level near 106,000 on the daily chart should be focused on.
In the hourly chart of the short cycle, the decline continued in the European session after the morning decline yesterday, the U.S. session broke the low of the previous day, and the price rebounded and corrected at the support in the early morning. Currently, it is still in a corrective trend. Today, focus on the high pressure level in the 106,000 area, as well as the impact of the strength of the European session and the unemployment benefit data in the evening on the trend.
you are currently struggling with losses,or are unsure which of the numerous trading strategies to follow,You have the option to join our VIP program. I will assist you and provide you with accurate trading signals, enabling you to navigate the financial markets with greater confidence and potentially achieve optimal trading results.
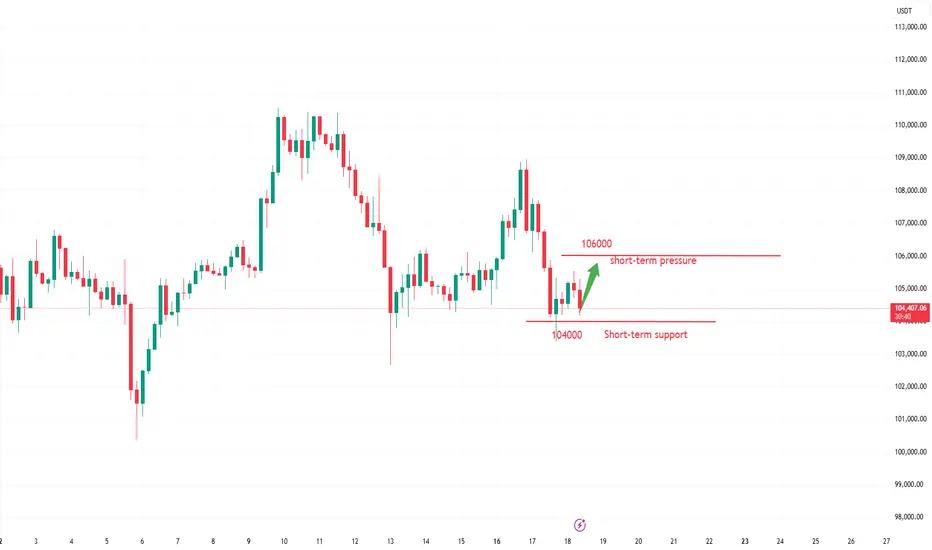
HTF Consolidation: Key Alerts, Vital Supports, FOMC & Geopolitic__________________________________________________________________________________
Technical Overview – Summary Points
__________________________________________________________________________________
Momentum: Strong bullish signal across sector indicators (Risk On / Risk Off Indicator), especially on daily and 12H. Momentum remains robust within consolidation.
Support/Resistance : Key zone at 104429–102600 (short- and long-term pivots); major resistance at 106000–109950.
Volume : Normal to high, with peaks at major supports on 1H/2H (potential sign of absorption/defensive buying).
Behavior across timeframes :
ISPD neutral on most TFs, only 2H gives a buy signal (possible tactical bounce).
All LTFs (≤1H) are down, HTFs (≥1D) are up → corrective structure, awaiting catalyst.
__________________________________________________________________________________
Strategic Summary
__________________________________________________________________________________
Overall bias : Underlying bullish, but market consolidates on key technical zones.
Opportunities : Swing buy at 104429/102600, tight stop below 100k, take profit 109950+.
Risk zones : Clear break below 100350/100000 invalidates the setup (risk-off or tactical short).
Macro catalysts : FOMC, Iran–Israel tensions, economic calendar (monitor Jobless Claims, Crude, Fed statement).
Action plan :
Capital preservation before FOMC.
Tactical entries only on key support; tight stops, prudent sizing.
No breakout chasing without macro/fundamental validation.
Hedge/volatility play via options possible (IV low, caution for post-event spike).
__________________________________________________________________________________
Multi-Timeframe Analysis
__________________________________________________________________________________
1D/12H/6H :
Supports: 104429, 102626, 100353.
Resistances: 106000–109952.
Risk On / Risk Off Indicator = Strong Buy.
No extreme volume, ISPD neutral; mature range.
HTF consolidation, bullish underlying momentum.
4H/2H :
Key zone at 104429–102600 (technical defense); 2H is the first true behavioral buy signal.
Very high volume at support, favoring a "spike bounce" scenario.
“Up” confluence on Risk On / Risk Off Indicator, volume, and ISPD for short-term bounce.
MTFTI: 2H is one of the “Up” TFs; LTFs remain Down.
1H/30min/15min :
Structurally bearish, elevated volume (absorption/protection) on 1H.
No behavioral excesses.
Intraday weakness but supports tested and defended.
__________________________________________________________________________________
Macro / Fundamental analysis
__________________________________________________________________________________
Market in wait-and-see mode : FOMC upcoming, no hike expected but high impact from tone/forward guidance (increased volatility risk).
Geopolitics : Iran–Israel escalation, risk-off climate, nervous risk assets.
On-chain : Supports tested (STH ~97.6k). Persistent LTH accumulation. Low option IV → underpriced volatility risk.
Risk/Reward swing : 2:1/3:1 buying 104429–102600, stop < 100k, take profit 109950+.
__________________________________________________________________________________
Final synthesis: Bias, Opportunities, Risks
__________________________________________________________________________________
Directional bias : Bullish on HTF, neutral/undecided on short-term. Wait-and-see until strong catalyst confirmed (FOMC, geopolitical de-escalation).
Opportunities : Tactical buy on supports, profit-taking on resistance or confirmed breakout.
Risks : Invalidation below 100k; sudden spike in FOMC/Israel–Iran escalation = risk-off or selloff.
Recommended action : Protect capital before FOMC. Swing tactical entry only on confirmed support. No breakout chasing without macro validation. Leverage potential post-FOMC vol spike via options.

BTC: Bias Map 18/06/25Daily Bias Map:
- Bitcoin is trading within a HTF range between 110,700 and 100,700.
- Mid range sits around 105,700 aligning with a 4H bearish fair value gap.
- Higher timeframes are trending down no justification for looking at longs here. Especially after losing 106,500
- FOMC today at 7PM UK time
- Expecting major volatility looking to short any spike into resistance or inefficiencies.
- A scalp long might be valid around 104,115 (demand zone + 30min SFP), but that’s tactical only.
- No reason to flip bullish geopolitical tension (Israel/Iran) adds further downside risk.
- Main plan: scalp long if triggered early, then look to short FOMC-driven upside move.
- Risk is tight. If setups aren’t clean, I’ll sit out and wait for the FOMC dust to settle.

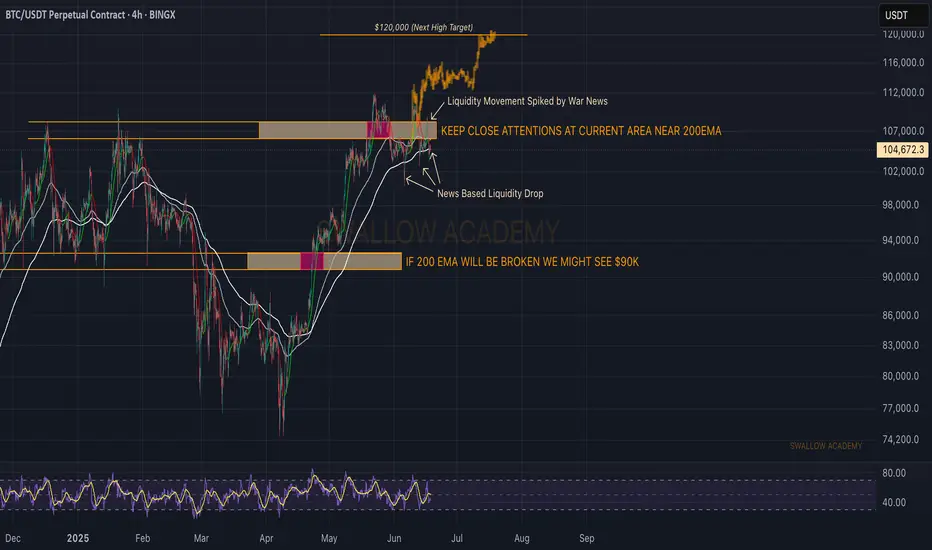
Bitcoin (BTC): Important Area of 200 EMA | Volatility IncomingWhat's happening in the world is having a huge impact on Bitcoin, but the worst is to come...
Price is hovering near the 200EMA, where neither buyers nor sellers can establish proper dominance near that area so our "wait" game continues. We wait for proper confirmations of which side will take control of the 200EMA and once we see it, we will be trading according to that.
Overall, as long as we are above the 200EMA, we are still looking for the $120K area, but once there, we will be looking for a BIG dump.
Swallow Academy
Bitcoin Price Looking bullish strength#Bitcoin Technical Outlook – BTCUSDT
Bitcoin recently tested the key support zone at 102,500 and is bouncing back, indicating bullish strength amid ongoing Middle East tensions. The geopolitical uncertainty continues to reinforce BTC’s safe-haven appeal, helping the price stabilize above critical levels.
🔹 Key Support: 102,500
🔹 Immediate Resistance: 109,000
🔹 Next Resistance: 110,000
⚠️ Note: Market remains volatile due to geopolitical developments — risk management is essential.
you may find more details in the chart Ps Support with like and comments for better analysis share with you Thanks for understanding.
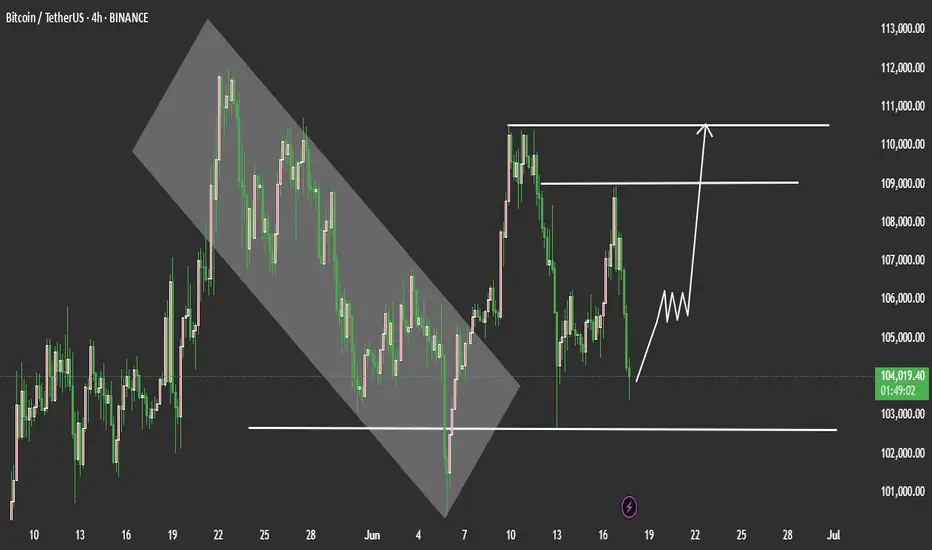
BTCUSDT – Price Poised to Break Descending ChannelBTCUSDT has been maintaining a series of higher lows since early May, consistently rebounding from its dynamic support trendline. Currently, the price is consolidating just below the descending channel resistance around the 108,000 USDT level. A clear double-bottom pattern accompanied by solid recovery momentum suggests a potential breakout from the prolonged correction phase that has persisted throughout June.
If BTC breaks above the descending trendline, the next target could be the major resistance zone near 113,000 USDT.
On the news front, the market is reacting positively to BlackRock’s announcement of expanding investment in crypto ETF products. At the same time, recent soft U.S. inflation data has strengthened expectations that the Fed may halt its tightening cycle. This combination is improving investor sentiment and driving renewed interest in risk assets like Bitcoin.

Current BTC Trend Analysis and Trading RecommendationsThe daily candlestick chart of BTC shows a three - day consecutive bearish retracement, having fallen back to the vicinity of the starting point of the previous pinbar rebound and currently remaining in a recent low - level sideways consolidation zone. However, the 4 - hour trend is pressured by the middle band of the Bollinger Bands, staying within a downward channel and forming a rebound - retracement wave pattern.
For short - term strategies, anticipate a further retracement first. Long positions should be initiated only after the support level is confirmed valid. This retracement represents a necessary consolidation phase before the bullish trend continues, and the current adjustment range does not pose a substantial threat of trend reversal to the overall uptrend. With the core upward trend intact and the direction remaining clear, BTC is expected to resume its upward momentum after a brief consolidation. The operational approach remains to go long on retracements.
BTCUSD
buy@103500-104000
tp:105500-106500
Investment itself is not the source of risk; it is only when investment behavior escapes rational control that risks lie in wait. In the trading process, always bear in mind that restraining impulsiveness is the primary criterion for success. I share trading signals daily, and all signals have been accurate without error for a full month. Regardless of your past profits or losses, with my assistance, you have the hope to achieve a breakthrough in your investment.

BTC/USDT in Consolidation: How To Trade the RangeBitcoin (BTC/USDT) is currently in a clear consolidation phase on the 4-hour chart 📊. Price action is trapped within a well-defined range, and for now, no dominant trend has emerged — we’re simply trading sideways between key support and resistance levels 🔁
In the video, we dive into how to tactically approach this kind of environment by trading the lower time frame trend shifts within the range — focusing on lower timeframe moves from range highs to range lows, and vice versa ⬆️⬇️
We also reference the broader macro picture — looking at the NASDAQ (US100) and the Magnificent 7 (MAGS) for potential clues about Bitcoin’s next directional move 🧠💡. Risk-on or risk-off sentiment in these key tech equities often correlates with Bitcoin’s momentum, making them critical confluence factors for BTC traders.
For now, the strategy is to remain range-conscious and reactive, rather than predictive. Until we get a confirmed breakout or breakdown, patience and precision remain key 🎯

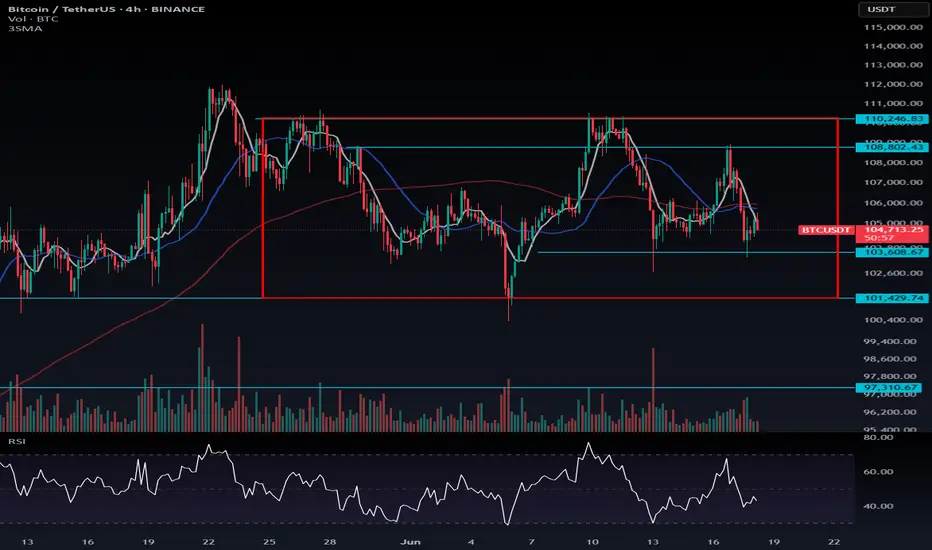
BTC at Risk Amid Technical Weakness and Geopolitical TensionsBitcoin has failed to break above the previous high of $110,264, and instead formed a lower high at $108,802, signaling potential weakness in the current structure. From a technical standpoint, this breakdown increases the likelihood of a bearish move — especially with today’s FOMC interest rate decision on the horizon and escalating geopolitical tensions, including the risk of U.S. involvement in the Middle East conflict.
We're also seeing increased volatility and market sensitivity to news, which can make short-term trading riskier than usual. Bitcoin remains inside the red consolidation box — and as previously mentioned, any breakout from this range is likely to be sharp and aggressive (whale-driven). That’s why positioning ahead of the breakout is crucial.
If BTC breaks below $103,608.67 and at the same time Bitcoin Dominance rises above 64.90%, it could be a strong signal that capital is exiting altcoins. In that case, short opportunities in altcoins may offer better setups, as they could drop more significantly than BTC.
🛑 Due to the high volatility and macro uncertainty, keep your risk low, use tight stop-losses, and don’t forget to secure profits quickly.
💬 What’s your take on BTC’s next move? Drop a comment below — let’s discuss! 👇
At the moment, Bitcoin is hovering around the newly created FVG.🚨 BITCOIN MARKET UPDATE 🚨
Bitcoin has recently broken below the previous BPR (Balanced Price Range), signaling a significant shift in market structure. Along with this breakdown, a Bearish Fair Value Gap (FVG) has also formed — a strong indication that the market may be preparing for a further move to the downside.
📉 What This Means:
The break below BPR, combined with the emergence of a bearish FVG, suggests that bearish momentum is currently in play. This is often a sign that the market intends to seek out lower liquidity zones, potentially targeting new lower lows.
🔎 Current Setup:
At the moment, Bitcoin is hovering around the newly created FVG. If price retraces into this zone and gives us a clear bearish confirmation (such as a rejection candle, bearish engulfing, or other MSS confirmation), it could provide a high-probability sell opportunity.
🎯 Target:
The primary target would be liquidity below the most recent lower lows.
⚠️ Risk Management Reminder:
Always wait for proper confirmation before entering a trade. These setups are best traded using MSS (Market Structure Shift) or BPR strategies for higher probability outcomes.
📚 DYOR — Do Your Own Research!
Trading involves risk. Ensure you have a strategy in place and never trade blindly.

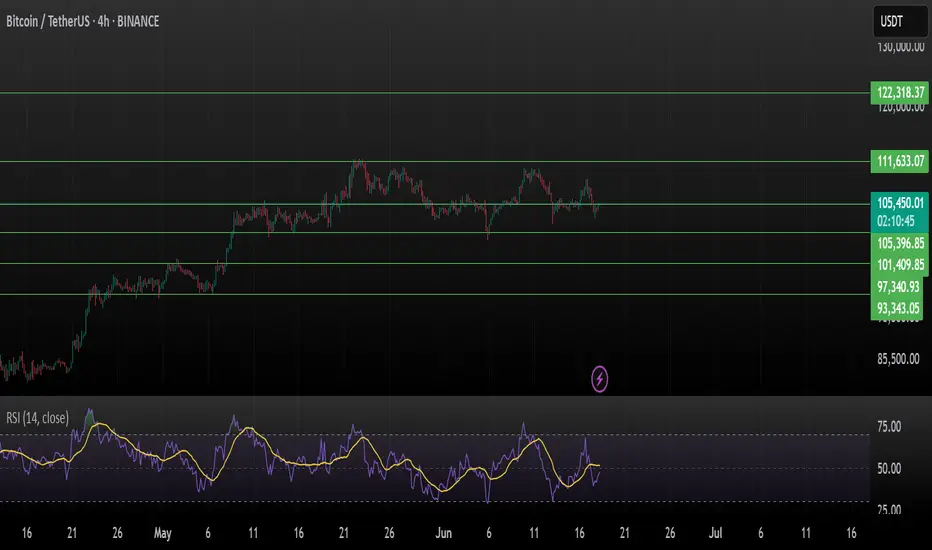
Bitcoin (BTCUSDT) 4H AnalysisBitcoin is currently consolidating around $105,523 after a strong rally and forming a short-term sideways structure. It is still unable to break the immediate resistance of $ 111 K.
Key Technical Observations:
BTC has been ranging between $101,409 and $105,523
RSI at ~51.38 indicates a neutral zone, signaling indecision in momentum
Support holding at $105,396, but price action is flat
Bulls need to reclaim $111,633 to regain momentum
Major Levels to Watch:
Resistance: $111,633 → $122,318
Support: $105,396 → $101,409 → $97,340 → $93,343
A break above $111,633 could trigger bullish continuation, while a fall below $101,409 might open the path to deeper support zones.
Patience is key — wait for breakout confirmation before making moves.
This is not financial advice. Always DYOR and manage risk.
Like, share & comment if you find this analysis helpful!
#Bitcoin #BTC #BTCUSDT
weekly BULL-FLAG!it looks like after the rally bitcoin had since early April, now this is a bull-flag pattern on weekly and that can push bitcoin to $140k.

BTCUSDT. Initiative Analysis Market OverviewHey traders and investors!
📍 Context
On the daily and 4H timeframes, the market is in a sideways range (Black lines = range boundaries).
Buyer initiative is active on 4H. The target initiative is 108,952.
However, on the daily timeframe, the seller initiative is in control, and a seller zone has formed. The seller zone is the red rectangle on the chart.
📊 Key actions
The buyer attempted to break out of the range on the daily timeframe twice, but both times the seller pushed the price back inside.
The price is currently interacting with the seller zone. Watching for the reaction.
🎯 Trade Idea
🔸 Long positions — with caution. Only valid if the price holds above 105,336, aiming for the target at 108,952.
🔸 Until that happens, the priority is on further downside, in line with the current seller initiative on the daily. It’s reasonable to look for short setups if the seller defends 105,336.
This analysis is based on the Initiative Analysis concept (IA).
Wishing you profitable trades!

BTCUSDT Long-Term Roadmap: From Capitulation to a $310K BreakoutAfter a confirmed breakdown from both the ascending trendline and the horizontal support near $110,000, BTCUSDT has entered a bearish phase. However, the projected green candles in your forecast suggest a long-term recovery structure—a potential accumulation phase, followed by a breakout cycle toward a new all-time high at $310K.
📈 Long-Term Phases in the Projection:
1. Phase One: Capitulation & Accumulation (~$65K–$90K)
BTC breaks down below $100K, potentially finding support between $65K and $90K.
This becomes a classic accumulation zone, where smart money begins to position.
Volatility decreases, and price action flattens while volume builds.
2. Phase Two: Recovery & Structure Break (~$105K–$110K reclaim)
Price reclaims the broken support at $105K–$110K, now acting as resistance.
A successful flip of this level into support signals the start of a new bullish cycle.
Market sentiment starts to shift from fear to cautious optimism.
3. Phase Three: Expansion Phase ($110K → $180K)
Once past $110K, BTC enters a momentum-driven rally.
Important psychological levels like $120K, $150K, and $180K are reached.
Institutions and retail FOMO begin re-entering the market.
4. Phase Four: Mid-Cycle Reaccumulation (~$180K–$210K)
BTC consolidates in a wide range, forming a reaccumulation base.
This becomes the launchpad for the final parabolic leg upward.
Market disbelief turns into euphoria.
5. Phase Five: Parabolic Rally to $310K
Once $230K–$250K resistance is cleared, BTC enters parabolic mode.
Targeting the macro top at $310,000, aligning with a future cycle peak (likely post-halving cycle).
Could happen within 12–24 months, depending on macro and cycle momentum.
🔍 Key Technical Conditions to Watch:
Successful reclaim of $110K on high timeframe (weekly close)
Formation of a higher low above $90K
Volume confirmation during breakout of $150K and $180K
Break and hold above $230K confirms macro breakout

BTC- Can it reach 97Kish?As thing suggests the move can only be done when heavy fall is there, but as suggests lets small scalp things to our best!

BTC/USDT Long Trade Setup – 1H Chart AnalysisBTC/USDT Long Trade Setup – 1H Chart Analysis
BINANCE:BTCUSDT
Hello traders! Sharing a recent long entry I took on Bitcoin (BTC/USDT) based on price action and liquidity concepts. This trade is taken on the 1-hour timeframe and aligns with my strategy of combining liquidity sweeps, support zones, and market structure shifts.
---
🔍 Trade Overview:
Entry Price: 104,704 USDT
Stop Loss: 103,660 USDT
Take Profit (Target): 108,349 USDT
Risk-to-Reward Ratio (RRR): Approximately 1:3
---
🧠 Trade Idea Behind the Entry:
As you can see on the chart, BTC had been in a downtrend and recently made a strong move into a key liquidity zone. This zone had previously seen multiple touches and rejections, making it an area of interest for both buyers and sellers.
The price swept liquidity below the previous low (labelled as “Liquidity Sweep $$$”), grabbing stop losses of early buyers and triggering limit orders of smart money. This move into the liquidity zone was followed by a strong bullish reaction – a signal that buyers may be stepping in.
Additionally, the "Break of Structure" (BOS) confirms a potential shift in market direction. The reaction from the liquidity zone indicates that this level is holding as new support.
---
🛠️ Why I Took the Trade:
1. Liquidity Sweep: The wick that pierced the liquidity zone signals stop-hunting and accumulation. These moves often precede a strong reversal.
2. Demand Zone Reaction: After the sweep, the candle closed bullish inside the demand box. This shows buyer strength.
3. Risk Management: The stop loss is set just below the liquidity zone to protect from deeper sweeps while keeping the RR healthy.
4. High Probability Target: The target is placed near the next resistance level around 108,349, which also aligns with a clean imbalance that price may want to fill.
---
📊 Technical Confidence:
Confluence Factors:
✅ Liquidity sweep
✅ Demand zone reaction
✅ Market structure shift
✅ High RR
✅ No immediate resistance till target
This type of setup reflects smart money behavior – first pushing price below structure to grab liquidity and then reversing sharply. The bullish momentum after the sweep gave extra confirmation.
---
🧭 What I’m Watching Now:
I will continue monitoring how price reacts around the 105,500–106,000 range. If momentum continues with higher highs and higher lows, I may trail my stop loss to lock in profits.
---
Let me know what you think of this setup! Have you taken a similar trade or are you waiting for confirmation? Drop your thoughts or charts below 👇
Stay disciplined, manage your risk, and trust the process. 🚀
#Bitcoin #BTCUSD #PriceAction #LiquiditySweep #SmartMoney #CryptoTrading #TradingSetup #TechnicalAnalysis #TradeJournal

#Bitcoin Roadmap for 2025–2026 A Deep Corrective Scenario UnfoldI believe the major top for Bitcoin was already printed on May 21st, at $111,000.
From here, I expect a three-wave corrective structure to unfold:
• 🔻 First drop to $69,000
• 🔼 Then a relief bounce to $85,000
• 🔻 Followed by a deeper decline to $46,000
If Bitcoin breaks the historical ascending trendline after reaching $46,000, I anticipate a five-wave bearish structure to continue:
• Further drop to $33,000
• Temporary correction up to $45,000
• And finally, a capitulation wave towards $19,000
I know this may sound early or even extreme to some, but if you review my previous Bitcoin outlooks going back to 2014, you’ll notice that many of these scenarios—however bold—have eventually played out with precision.
📌 Invalidation Level:
This scenario would be invalidated if Bitcoin closes a weekly candle above $115,000.
Good luck, fellow traders—stay sharp and prepared. 🧠📉
⸻
