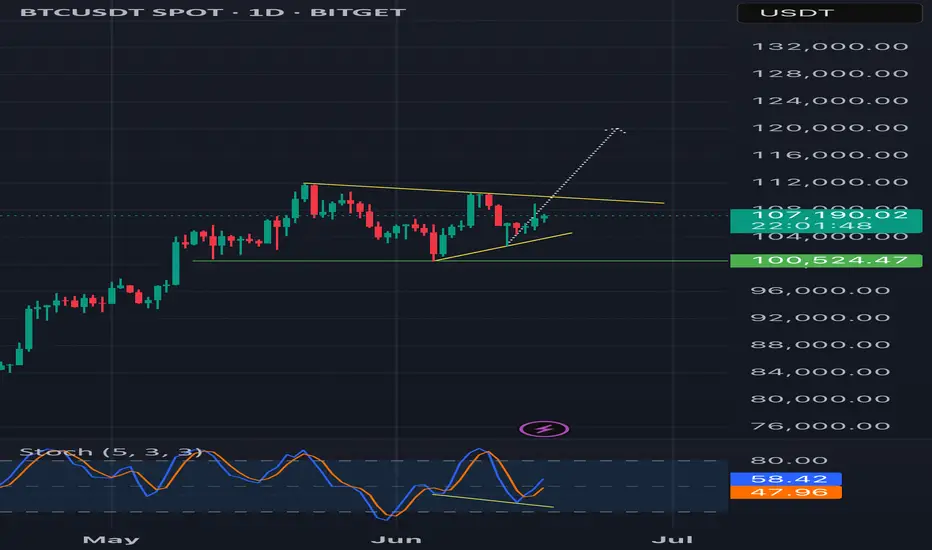
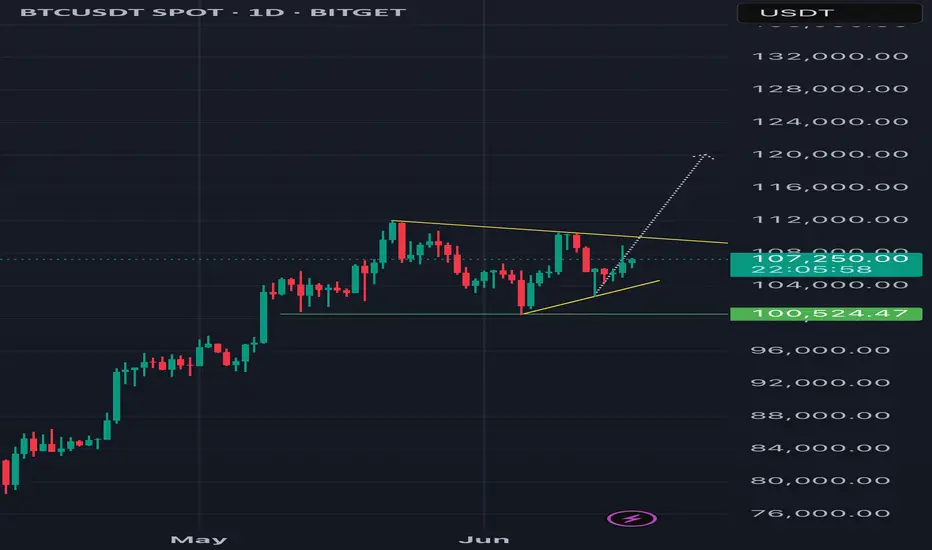
Bitcoin - Plan for summer 2025 (no new ATH, big range!)Bitcoin's price action is statistically very boring during summer seasons! Usually high volatility kicks in in September. I think we cannot really expect a new all-time high in the next few weeks. Instead, we should see a big range. Why? Let's take a look at technical analysis.
On the chart we can clearly see a blue trendline, and price went below this trendline at the end of May. This indicates that the uptrend is over and a consolidation/distribution phase is in progress. This phase is usually represented as a bull flag, triangle, rectangle, or wedge. When we look at the current price action, it looks like a bullish flag consolidation pattern. In this case we will probably see multiple liquidity sweeps below the previous swing lows to kick out early longs.
There are 2 types of traders. The first one they love to trade ranges, and the second they love to trade breakouts and higher volatility environments. Currently I think Bitcoin is creating a range, so do not expect any crazy movements until this range is valid.
Bullish flags are usually bullish patterns, but often they break down and act like bearish patterns. So what would happen if this bullish flag breaks down? That would send the price of Bitcoin to the 0.618 FIB, which is at 88,882 USDT. What is this bullish flag breaks out? That would send the price of Bitcoin to 116,000 to 125,000, but to establish this price we first need to see low of the bull flag, which is not confirmed yet. I will definitely inform you in one of my next analyses, so write a comment with your altcoin + hit the like button, and I will make an analysis for you in response.
At the end of each post, I share my professional trading tips: "If you realize you’ve made a poor trading decision, exit before the stop loss forces you out."
Trading is not hard if you have a good coach! This is not a trade setup, as there is no stop-loss or profit target. I share my trades privately. Thank you, and I wish you successful trades!
BTCUSDT.3L trade ideas

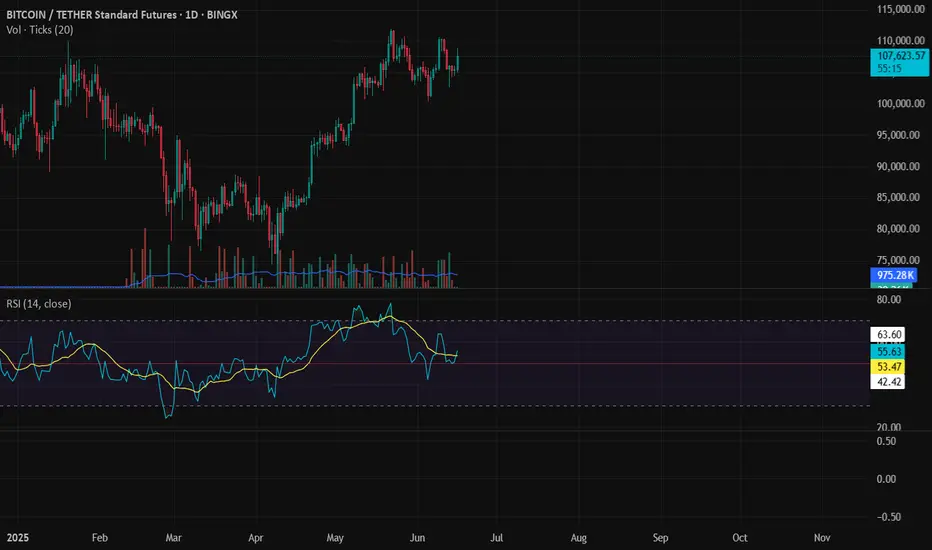
Bitcoin Strategic Interval, CME Dislocation and Macro Friction.⊢
𝟙⟠ - BTC/USDT - Binance - (CHART: 1W) - (June 17, 2025).
⟐ Analysis Price: $106,851.31.
⊢
I. ⨀ Temporal Axis – Strategic Interval - (1W):
▦ EMA21 – ($96,818.00):
∴ The current candle closes +10.3% above the EMA21, maintaining bullish dominance over the mid-term dynamic average;
∴ This is the 17th consecutive weekly candle closing above the EMA21 since its reclaim in February 2025, forming a structurally intact uptrend;
∴ No violation or wick-close below the EMA21 has occurred since April, and the distance from price to EMA21 remains within a standard deviation of mid-trend movement.
✴ Conclusion: The trend is active and preserved. EMA21 acts as dynamic support and bullish pressure zone. A reversion would only be expected if weekly closes return below $98K with volume confirmation.
⊢
▦ SMA200 – ($48,969.73):
∴ The 200-week simple moving average remains untouched since early 2023, never tested during the current cycle;
∴ The slope of the SMA200 is positive and gradually increasing, indicating a long-term structural trend recovery;
∴ Price stands +118% above the SMA200, a level historically associated with mid-cycle rallies or overheated continuation phases.
✴ Conclusion: The SMA200 confirms long-term bullish structure. Its current distance from price makes it irrelevant for immediate action but critical as the absolute invalidation level of the macro trend.
⊢
▦ Ichimoku – Kumo | Tenkan | Kijun:
∴ Price is above the Kumo cloud, with Span A ($107,172.16) and Span B ($98,562.38) creating a bullish tunnel of support;
∴ The Kijun-sen rests at $95,903.19, slightly below EMA21, and aligns with the last strong horizontal range;
∴ Chikou Span is free from historical candles, confirming trend continuity under Ichimoku principles.
✴ Conclusion: All Ichimoku components are aligned bullish. Pullbacks to the Kijun around $96K would be healthy within a macro-uptrend, and only sub-cloud closes would question this formation.
⊢
▦ Fibonacci - (Swing Low $49,000 – High $111,980):
∴ Bitcoin remains between the (0.236 Fibo - $97,116.72) and local top at $111,980, showing respect for fib-based resistance;
∴ The (0.5 Fibo - $80,490.00) has not been retested since March, confirming the range compression toward upper quadrants;
∴ Weekly price is consolidating under fib extension with decreasing body size, suggesting strength with pause.
✴ Conclusion: The Fibonacci structure confirms bullish extension phase. If $97K breaks, retracement to (0.382 Fibo - $87,921.64) is expected. Otherwise, the breakout above $112K enters full projection territory.
⊢
▦ MACD – (Values: 1,077.98 | 5,963.81 | 4,885.82):
∴ MACD line remains above signal line for the third consecutive week, recovering from a prior bearish cross in April;
∴ The histogram has printed higher bars for four weeks, but the slope of growth is decelerating;
∴ Positive cross occurred just below the zero-line, which often results in delayed reactions or failures unless reinforced by volume.
✴ Conclusion: MACD signals a weak but persistent momentum recovery. Reaffirmation depends on histogram expansion above 1,500+ and signal spread widening.
⊢
▦ RSI – (Close: 64.37 | MA: 57.56):
∴ The RSI is in the bullish upper quadrant, but without overbought extension, suggesting active buying without euphoria;
∴ The RSI has been above its moving average since mid-May, maintaining a healthy angle;
∴ Momentum is not diverging from price yet, but is approaching the 70 zone, historically a point of hesitation.
✴ Conclusion: RSI confirms controlled strength. Further advance without consolidation may trigger premature profit-taking. Above 70, caution increases without being bearish.
⊢
▦ Volume - (16.97K BTC):
∴ Weekly volume is slightly above the 20-week average, marking a minor recovery in participation;
∴ There is no volume spike to validate a breakout, which is common in compressive ranges near resistance;
∴ Volume has been declining since mid-May, forming a local divergence with price highs.
✴ Conclusion: Volume profile supports current levels but does not confirm breakout potential. A rejection with strong volume will mark local exhaustion.
⊢
II. ∆ CME Technical Dislocation – BTC1! Futures:
▦ CME GAP – BTC1! – ($107,445.00):
∴ The CME Futures opened this week at $105,060.00 and closed the previous session at $107,445.00;
∴ A clear unfilled gap persists between $105,060.00 and $107,900.00, with price action hovering just above the top edge;
∴ Bitcoin has a consistent historical behavior of returning to close such gaps within a short- to mid-term range.
✴ Conclusion: The unfilled CME gap acts as a gravitational technical force. As long as price remains below $109K without volume expansion, the probability of revisiting the $105K area remains elevated.
⊢
III. ∫ On-Chain Intelligence – (Source: CryptoQuant):
▦ Exchange Inflow Total - (All Exchanges):
∴ Current inflow volume remains below the 1,000 Bitcoin daily threshold, indicating no panic selling or institutional exits;
∴ This inflow level corresponds to accumulation or holding phases, rather than distribution;
∴ The pattern matches a neutral-to-positive mid-cycle environment.
✴ Conclusion: There is no structural on-chain pressure. As long as inflows remain low, risk of capitulation or distribution is minimal.
⊢
▦ Spot Taker CVD - (Cumulative Volume Delta, 90-day) – (All Exchanges):
∴ The 90-day CVD shows continued dominance of taker buys over sells, reflecting ongoing demand strength in spot markets;
∴ However, the curve is flattening, suggesting buyers are meeting resistance or fading interest;
∴ No sharp reversal in the CVD curve is detected — only saturation.
✴ Conclusion: Demand remains dominant, but the pace is decelerating. Without renewed volume, this curve may revert or plateau.
⊢
▦ Exchange Inflow Mean - (MA7) – (All Exchanges):
∴ The 7-day moving average of exchange inflow continues to decline steadily;
∴ This metric often precedes calm phases or pre-breakout plateaus;
∴ Historical patterns show similar inflow behavior before prior volatility expansions.
✴ Conclusion: A period of silence is unfolding. Reduced mean inflow suggests price is awaiting external catalysts for movement.
⊢
▦ Funding Rates – (Binance):
∴ Current funding rates are neutral, with slight positive bias, suggesting balanced long-short sentiment;
∴ No extreme spikes indicate absence of excessive leverage;
∴ This equilibrium typically precedes significant directional moves.
✴ Conclusion: Market is leveled. Funding neutrality reflects hesitation and prepares ground for upcoming directional choice.
⊢
IV. ⚖️ Macro–Geopolitical Axis – (Powell, Middle East & BTC/XAU):
▦ MACRO CONTEXT:
∴ Jerome Powell is scheduled to speak on Wednesday (June 19), with markets anticipating remarks on rate stability or future hikes;
∴ Ongoing tensions in the Middle East (Israel–Iran) elevate risk-off behavior in traditional markets;
∴ Bitcoin has triggered a rare Golden Cross vs. Gold, as noted by U.Today, signaling digital strength over legacy value.
✴ Conclusion: Macro remains the primary external catalyst. Powell’s statement will determine short-term volatility. Until then, Bitcoin floats between its technical support and CME magnetism, with gold dynamics providing long-term bullish backdrop.
⊢
⚜️ 𝟙⟠ Magister Arcanvm – Vox Primordialis!
⚖️ Wisdom begins in silence. Precision unfolds in strategy.
⊢

What is what I think BTC is bearish short to full the FVGs if you look very closely to the chart. Full the gaps and back up for a long

BTCUSD – Range Scalping Zones IdentifiedPrice tapped into a previous short zone near 108.6 and showed rejection. We’re watching for downside follow-through toward the 104.2 to 104.5 range where a potential long opportunity may form.
This chart outlines clean range-based levels for scalping. These zones line up with prior liquidity sweeps and local structure shifts. Scalpers can look to react at these levels depending on how price behaves when we get there.
Ideal for traders on lower timeframes like the 15m, but the concept applies across intraday setups. Always wait for confirmation before entering.

BTC long now ! Bullish divergence confirm !Bullish divergence in daily timeframe is confirm. It might be good for take long position
#isharewhatitrade
#dyor
BTC long now ! Bullish divergence confirm ! Bullish divergence in daily timeframe. It might be good for take long position on btc .
#DYOR
W pattern off the handle. #Bitcoin to 168K.From my most recent post of the Cup & Handle I see a W pattern. Price broke out of the handle to retest to confirm support creating a double bottom.
This is a very good sign to confirm the C&H for this bullish near future.
If we continue upwards and break the psychological resistance zone at 111K, I expect 168K within 3-6 months.
I attached the Cup and Handle analysis to the current.

Bitcoin Will Continue Rising —Long-Term Chart —$200,000+ New ATHIn November 2021, the week after the all-time high was a crash. The weeks that followed were a continuation and the market went full red and didn't stop dropping until November 2022, a year later.
In May 2025, the week after the all-time high is neutral, sideways. Four weeks later and Bitcoin continues sideways consolidating near resistance, ready to break to new highs and continue rising.
Market conditions now are very, very different compared to 2021. Right now, we are only halfway through the current bull market, for Bitcoin, and we have room left available for plenty of growth.
In a matter of days, maybe 5-6 days, we get a new all-time high and this means not the end of the bull market but the start of the next and final bullish wave.
These targets on the chart are the most accurate of all numbers because they are based on almost 5 years of data.
Next target and minimum price for Bitcoin in the coming months is $155,601 but we know there is likely to be more, much more. With the institutional wave now in full force, banks opening to crypto because they have no other choice and the world evolving faster than anything we thought possible, we are aiming for $200,000 or more.
The next relevant level after $155,600 is $209,125. Which one is your target for this new 2025 all-time high?
Do you think Bitcoin will peak in late 2025 or early 2026?
Do you think you will manage to be successful in this round or are you bound to make the same mistakes? Over-trading, over-leverage, no being patient enough; not waiting for the right time to enter and not selling when the market is trading very high, greed; What will it be?
Do you think you have what it takes to succeed? You do!
Even if you made mistakes in the past or even if you are already doing good, you have what it takes.
If you are doing bad, this experience can be used to improve your game. If you are doing great, great, let's do better. There is never enough growth; we are happy, we are grateful but we accept abundance because we receive abundance thanks to hard work.
It is still very early but the market is starting to heat up. Once the bullish action starts, there is nothing that can stop us. The world will change for us. We will adapt to all market and geopolitical conditions, we will continue to improve and evolve.
The best one is not the one that makes no mistakes but the one that can extract learning from all experiences. Success is not being right all the time, success is never giving up.
Will you give up? Or, will you continue to trade long-term?
» Bitcoin is going up!
Namaste.

sellsell
Iron dome is hacked & Iran is hacking nuc sil.Tela vvv is going to be de stroiiiiied this night
BTC BUY OPPORTUNITY From the H1 perspective, more buy entries are made as price closed at 108712 today. A buy. Opportunity is envisaged from the current market price. Our target profit is the all time high. Take advantage of this opportunity now.

BTC VAH, Golden pocket, R3, confluence resistance at 108kBTC VAH, Golden pocket, R3, confluence resistance at 108k
We had a nice up move but now hitting a confluence of resistance. I'm looking for shorts for the correction before moving up again.
Looking at bearish divergence on smaller time frames for entry.

be ready for it this for educational purpose comment for any stock analysis name and take risk on ur on action

BTC: H4 14/06/25Bearish DOL @ $100,300
HTF Remains bearish
Any scam move Sunday would be my trigger to short.
Invalidation would be taking $100,300 before that or if structure changes between then and now.
That said, I think its a very high likelihood we just roll over here and we don't take that level. IMO the cleaner short was the H4 BPR but I was unavailable at the time to take that trigger.

BTC Rally in Play — Time to Lock In Profits and Wait for FOMC?📈 Bitcoin Rally in Play — Time to Lock In Profits and Wait for FOMC?
After the expected upward move, I believe now is a good time to either close your positions or secure partial profits, whether you're in Bitcoin or altcoins. The market will offer new opportunities, so there’s no rush.
With the upcoming FOMC meeting on Wednesday, I suggest holding off on new entries until the news is out and volatility settles.
Currently, the resistance at $108,347 isn’t confirmed as valid yet — but if we see a rejection from that level, it could become a short-term barrier. On the downside, to maintain this recent bullish momentum, the support at $106,568 must hold.
---
💬 How are you managing your trades ahead of the FOMC? Took profits already or still holding? Drop a comment below — always good to hear your plan!

BITCOIN → Buyback bar. Chance of growth to 108,000BINANCE:BTCUSDT is trading in a fairly wide range of 100,600 - 110,400. The market is stagnating due to fundamental uncertainty, but the risks of a decline are quite high...
After the escalation of the conflict in the Middle East, Bitcoin broke the bullish structure on the market and managed to test the local level of 102500, from where a fairly aggressive phase of buying out the fall began within one trading session. The market is defending the structure quite aggressively. The chart shows a local range forming with strong levels at 102500 and 106200. Accordingly, the price may remain in this range for a long time (in which case an intraday trading strategy can be considered). However, if Bitcoin starts to stick to one of the boundaries, then we can consider the price leaving the range, but based on the structure of the uptrend, correction, and the formation of a buyback bar, it would be logical to see an attempt to break through resistance with the aim of continuing growth.
Resistance levels: 106200, 108200, 110400
Support levels: 102500, 100600
On D1, there are no prerequisites for a strong decline. The market is buying up knives and trying to stay afloat (in consolidation). In the medium term, there may be an attempt to retest 102500 - 100600 due to the liquidity pool. But locally, the market may form an attempt to grow to 108200
Best regards, R. Linda!

POC, Daily, Golden Pocket, S1 confluence support @ 104000POC, Daily, Golden Pocket, S1 confluence support @ 104000
Very strong support here. I'm putting a limit order anticipating a quick bounce.

That wasn’t a breakout. That was the stop runBTC swept the high into 107,991 — precision tap of the premium fib. Now the delivery shifts. Price has already done its job: take liquidity, trigger late longs, and set up the real move.
Here’s the execution breakdown:
Price tagged the 0 level of the fib extension — 107,991 — and rejected
A clean 4H FVG sits just below around 106,195.9 (0.5), aligned with 0.382 and 0.618 fib levels (106,619.8 to 105,772.1)
This is the re-entry zone for Smart Money — not the top chasers
Expectations from here:
→ Rebalance into the 106.6–105.7k region
→ If that zone holds and price shifts structure bullish again, we retest 107.1 → 107.9 → break higher
→ If we lose 105.7 cleanly, I’m watching 104,399.9 — the deeper inefficiency magnet
This isn’t about confirmation. It’s about preparation.
More trades like this — clean, controlled, conviction-based — live in the profile description.

Bitcoin Market Analysis and Future Trend ForecastThe Bitcoin market has once again become the focus of investors. The price of Bitcoin has shown a significant upward trend, successfully breaking through the key resistance level of $106,000 per coin with an intraday increase of over 2%, demonstrating the strong vitality of the market. This price movement not only reflects the warming of positive sentiment in the cryptocurrency market but also indicates the gradual recovery of investor confidence, which has become the core driving force behind Bitcoin's current rally.
Currently, the Bitcoin price is at a critical juncture. From a daily chart perspective, after reaching an intraday high of $107,265, Bitcoin failed to effectively break through the key resistance level of $108,000 and has since retracted to fluctuate around $106,940. On the 4-hour timeframe, the MACD indicator shows that the histogram remains in positive territory, but the rate of increase has slowed, suggesting a short-term weakening of bullish momentum. Meanwhile, the RSI indicator stands at around 65, approaching the overbought zone, indicating that the market faces short-term correction pressure.
you are currently struggling with losses,or are unsure which of the numerous trading strategies to follow,You have the option to join our VIP program. I will assist you and provide you with accurate trading signals, enabling you to navigate the financial markets with greater confidence and potentially achieve optimal trading results.
Trading Strategy:
sell@107500-108000
TP:106000-106500

BTC is Bullish!Hello TradingView Family / Fellow Traders. This is Richard, also known as theSignalyst.
📈BTC has been overall bullish trading within the rising channel marked in blue.
Moreover, the red zone is a strong structure!
🏹 Thus, the highlighted blue circle is a strong area to look for buy setups as it is the intersection of structure and lower blue trendline acting as a non-horizontal support.
📚 As per my trading style:
As #BTC approaches the blue circle zone, I will be looking for bullish reversal setups (like a double bottom pattern, trendline break , and so on...)
📚 Always follow your trading plan regarding entry, risk management, and trade management.
Good luck!
All Strategies Are Good; If Managed Properly!
~Rich


BTC-----Buy around 107500, target 108000-109000 areaTechnical analysis of BTC on June 16:
Today, the general trend is still relatively obvious, so the trading strategy is to buy at a low price.
Today's BTC short-term contract trading strategy:
Buy in the 107500 area, stop loss in the 106500 area, and target the 108000-109000 area;

BTC Setup: Watching for a Trap — Bids Below, Flip Above!Scenario 1 (Fakeout & Reversal):
Watch for push to $107,000–$108,000 (potential bull trap)
Close longs on move into resistance zone
Look for reversal signals (SFP, strong rejection) to re-enter lower
Scenario 2 (Sweep and Bounce):
Place bids at/just below $100,272 (1D Support) and within $98,000–$100,000 (FVG)
Target: Move back toward trendline resistance ($107k+)
Stop: Below $97,200
Invalidation:
Structure flips bearish on a clean break/close below $97,200
🔔 Triggers & Confirmations:
Enter longs only on SFP or strong bounce confirmation in FVG zone
Avoid chasing if price is between $102k–$106k (“no-trade chop”)
📝 Order Placement & Management:
🔼 Buy Limits: $100,300 / $99,000 / $98,000 (staggered bids in FVG)
🛡️ Long Stop: $97,200
🎯 Target: $107,000–$109,000 (trendline resistance)
📝 Take profits on spike to $107k+
🚨 Risk Warning:
Friday volatility, news risk
Avoid new longs above $107k — watch for failed breakout/fakeout

BTC doing a 1.618 means altcoin season is on🔥 Why 1.618 on BTC = Altcoin Season Coming
The 1.618 Fib extension is a common target for wave 3 or wave 5 in Elliott Wave theory. Once BTC hits it:
Many traders start taking profit on BTC.
That capital usually flows into ETH and major alts, then mid/small caps.
BTC dominance often peaks or stalls after hitting 1.618, which historically signals:
ETH/BTC starts rising
Altcoins gain strength against BTC and USDT
Retail and sidelined liquidity get attracted by BTC gains, but then chase faster % returns in alts.
🧠 Example Playbook
BTC breaks out → Runs hard → Hits 1.618 (e.g., from last correction low to current high)
ETH/BTC bottoms → ETH/USDT starts to run
Majors like SOL, AVAX, MATIC, DOT follow
Mid/small caps explode last (aka “altseason” proper)
