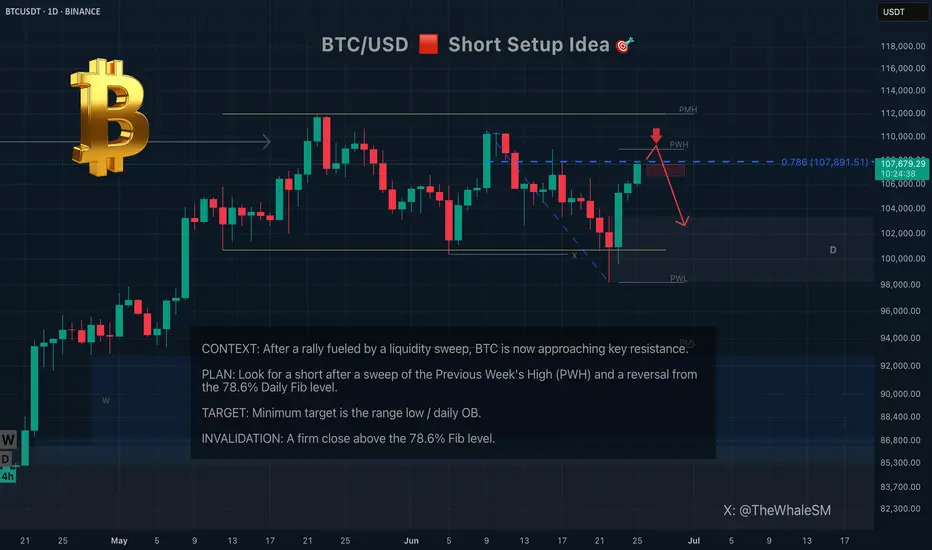
Bitcoin (BTC) Short Setup at Key Daily ResistanceIn this analysis, you will find a clear scenario for a potential short setup with precise conditions for confirmation and invalidation. No fluff or guesswork—only institutional analysis of capital footprints and pure price action. I will provide updates for every stage of price interaction with the POI in near real-time, so you can make timely trading decisions, not just observe events after the fact.
Context: What Happened Before?
Bitcoin has perfectly played out Scenario 2 from my previous long analysis. After the liquidity sweep below, which confirmed that the instrument is locked in a large global range, it began an aggressive, correction-less rally. This is often the case after absorbing a large amount of liquidity, which essentially became the fuel for this rise.
The Short Setup
To break out of the range to the upside (or at least make a deviation above it), Bitcoin must overcome the first serious resistance zone. This zone consists of:
The 78.6% Fibonacci level from the daily structure.
Liquidity from the Previous Week's High (PWH) .
My plan is to look for a short position if we see a reversal reaction from this zone after the liquidity is taken. The minimum target for this move would be the lower boundary of the range and the daily order block located there. This local move inside the range can be seen as a shorting opportunity.
Invalidation of the Short Scenario:
A break of the 78.6% level with the price closing firmly above it would cancel the short scenario. In that case, Bitcoin would likely continue its move towards the next resistance level.
BTCUSDT.3L trade ideas
BTC AnalysisSince the red arrow was placed on the chart, Bitcoin's bullish phase has ended and it has entered a corrective phase. This correction appears to be forming a Diametric pattern, and we are currently in the middle of wave E.
After interacting with the demand zone, the price may move toward the specified targets.
A daily candle closing below the invalidation level will invalidate this analysis.

BTC/USDT – Intraday Plan (15m, Ichimoku) by RiscoraToday’s idea:
I’m expecting a retracement to the 107,867 level as a pullback to the recent impulse. The move we observed earlier aligns with my prediction from last Friday — liquidity was taken out above the highs, and now I anticipate a deeper correction against the overall bullish move.
My main scenario for the day is a move down into the 106,400 area at minimum, targeting the liquidity below.
Ideally, I’d like to see a push to 107,870 first, as that would provide the best entry for a short setup. I’m willing to open a short in that scenario, but it’s important to remember the higher timeframe trend remains bullish, so any short should be approached with caution.
Key levels:
Retracement target: 107,867
Main downside target: 106,400
Cautious shorting only — trend still bullish overall
Let’s see how the price develops. Will update if conditions change.
#BTC #Crypto #Trading #Ichimoku #Riscora

BTCUSDT – Spring + S&R Rejection | 15min Power EntryBTCUSDT – Spring + S&R Rejection | 15min Power Entry
📅 June 26, 2025
Price swept support and printed a clean spring pattern on the 15-minute —
Rejection off key structure + volume surge confirms buyers are back in control.
✅ Demand stepped in hard
✅ Strong wick below consolidation
✅ Protected by the rising 200 EMA
✅ Entry aligns with a Fibonacci 1.618 projection target
I’m long to 109,290.56 — nothing less.
Stop is clean, invalidation obvious.
BTC just tapped the spring — I’m in.

#BTC Update. Here's the trigger point.CRYPTOCAP:BTC Update:
Bitcoin is trading around the key $108K resistance, one of the most crucial levels for bulls to break.
A strong close above this zone could spark a rally toward $ 117,000. However, if rejected, we might see a pullback to $ 103,000.
I’m not touching futures just yet.
I’m okay with missing a few green days; I’d rather wait for clear momentum than get caught in this choppy price action.
Let me know what you think in the comments.
Thank you
#PEACE

BTC 30.06.25So far BTC is behaving exactly as expected, i'm just waiting for a valid setup to appear. I would love to see a model 1, which takes out the high and mitigates supply, but i'm also not ignoring a potential model 2. These 2 deviations merge together on a higher time frame, where the range is also valid on, so they can be counted as one. There are many altcoins with similar behavior and USDT/C in potential accumulation. I'm waiting to see confirmations/ invalidations.
Do you think I'm joking ???Chart is speaking itself...AB=CD.
previous analysis
Give me some energy !!
✨We spend hours finding potential opportunities and writing useful ideas, we would be happy if you support us.
Best regards CobraVanguard.💚

Bitcoin has dropped for profitable purchasesBitcoin is within the range. Quite a bit of time has passed since the last retest, and the liquidity pool that has formed below 106345 may not allow the price to fall on the first attempt.
Global and local trends are bullish. Enter a buy position after a false breakout of support and the formation of a local reversal pattern on TF m5-m15
Scenario: if, after a false breakout, price consolidation forms above 106500, then the entry point could be a breakout of local highs (breakout of the structure - ‘bos’).

Bitcoin - An Epic Move Awaits!Bitcoin gained 13% in H1 2025, outperforming Ethereum and Solana, which dropped ~25% and ~17% respectively—highlighting BTC's strength in turbulent market conditions.
Institutional wedge: spot-BTC ETFs saw huge inflows—BlackRock’s took in $336M, and total crypto product inflows approached $45B+ this year.
AI models foresee BTC holding $105K+ by end-June, with ChatGPT pointing to $118K and Grok forecasting $108K, based on momentum and ETF flows.
We see BTC holding the 20 MA and spiking to new all time highs.

PSYCHOLOGY OF A CRYPTO CYCLEWe expected a pullback, and now thats behind us!😅
The market is back on track, and we are firmly in the #Belief phase of the bull cycle.
With heavy short liquidity stacked around $110K, a push into that zone could trigger a short squeeze, launching us into the #Thrill phase.
And if momentum holds, all signs point to #Euphoria by late 2025.
Favorites so far this cycle:
🥑 POLONIEX:GUACUSDT 🔗 POLONIEX:LLUSDT 🎮 KUCOIN:MYRIAUSDT
🌐 HTX:SYNTUSDT 🧪 MEXC:DEAIUSDT 🏠 OKX:PRCLUSDT
🧱 MEXC:YBRUSDT ⛏️ MEXC:KLSUSDT 🧩 $RUJIUSDT
Comment below your favorite coins!

NEXT LEVELSnext move ahead for Bitcoin
Bitcoin Could Reach $140,000 in the Coming Months
Market analysts and crypto enthusiasts are increasingly confident that Bitcoin is on track to reach new highs. After strong institutional adoption, growing interest from retail investors, and the impact of recent halving events, many experts believe Bitcoin could surge to $140,000 in the coming months.
Macroeconomic factors like inflation concerns, limited BTC supply, and a weakening dollar are all contributing to the bullish momentum. If current trends continue, a breakout toward the $140K level is not just possible—it’s becoming more likely.
Stay informed, stay strategic, and get ready for what could be a historic move in the world of crypto.

Bitcoin Short Setup at Key Daily ResistanceIn this analysis, you will find a clear scenario for a potential short setup with precise conditions for confirmation and invalidation. No fluff or guesswork—only institutional analysis of capital footprints and pure price action. I will provide updates for every stage of price interaction with the POI in near real-time, so you can make timely trading decisions, not just observe events after the fact.
Context: What Happened Before?
Bitcoin has perfectly played out Scenario 2 from my previous long analysis. After the liquidity sweep below, which confirmed that the instrument is locked in a large global range, it began an aggressive, correction-less rally. This is often the case after absorbing a large amount of liquidity, which essentially became the fuel for this rise.
The Short Setup
To break out of the range to the upside (or at least make a deviation above it), Bitcoin must overcome the first serious resistance zone. This zone consists of:
The 78.6% Fibonacci level from the daily structure.
Liquidity from the Previous Week's High (PWH).
My plan is to look for a short position if we see a reversal reaction from this zone after the liquidity is taken. The minimum target for this move would be the lower boundary of the range and the daily order block located there. This local move inside the range can be seen as a shorting opportunity.
Invalidation of the Short Scenario:
A break of the 78.6% level with the price closing firmly above it would cancel the short scenario. In that case, Bitcoin would likely continue its move towards the next resistance level.

110k soon , best time to buy altcoins Btc still didnt complete main wave 5 , btc for last time touch 98k but this time price will attack 110k and then we will have NATH.

BTC - Bullish SOON!Hello TradingView Family / Fellow Traders. This is Richard, also known as theSignalyst.
BTC has been in a correction phase, and it feels like it's taking forever! ⏳
As long as the blue trendline holds, the overall bias remains bullish. 📈
As BTC approaches the blue trendline—perfectly aligning with a demand zone and support—we'll be watching for trend-following longs to catch the next big impulse move upward. 🚀
For now, we wait! ⏳
📚 Always follow your trading plan regarding entry, risk management, and trade management.
Good luck!
All Strategies Are Good; If Managed Properly!
~Rich

Bitcoin short position After my win streak from previous trades on btcusd I happy to give me to the people who followed me
Here's another great trade for you
Short Bitcoin with a limit order at 108,500
Take profit at 101k , stop loss at 109,500
A 7.5 to 1 risk reward ratio 🔥😉
You can never find anybody trade Bitcoin like me

Bitcoin - Bounce Incoming or Breakdown to 97.5k?Market Context
Bitcoin recently swept the 100k lows, clearing out built-up liquidity beneath that level. This move formed a strong reaction candle, suggesting interest from buyers and confirming the presence of resting demand. The sweep aligns with the concept of smart money targeting obvious liquidity pools before shifting direction. It also marks a potential short-term low, at least temporarily.
Short-Term Structure and FVG Setup
Following the sweep, price tapped into a clean 1H fair value gap and has been respecting it so far. This is our immediate line in the sand. As long as this gap holds, we’re dealing with a scenario of temporary bullish order flow. The market structure on lower timeframes suggests the potential for a short-term rebound, possibly into the inefficiencies left above.
Upside Target and Gap Fill Potential
If price continues to hold the 1H FVG, we could see a push higher that targets unfilled gaps above, particularly the one where we saw a clean rejection previously. There’s a clear inducement just above recent highs, so a sweep of those could be used to fill that imbalance. This would align with the idea of running internal liquidity before reversing or stalling at supply.
Bearish Breakdown Scenario
On the flip side, if price breaks down from the 1H FVG without reclaiming structure, the entire bullish idea invalidates. In that case, I expect price to gravitate back toward the 97.5k zone. This would be a logical area for deeper mitigation and potential reaccumulation, especially since it sits below the current consolidation. The failure to hold the gap would signal weak demand and continuation of the broader bearish leg.
Scouting Liquidity and Price Flow
Right now, the main idea is tied to how price behaves around the short-term 1H FVG. That is the pivot. Hold it, and we should see some form of liquidity run into the unfilled gap above. Lose it, and the next wave of downside should unlock, pushing us closer to 97.5k. Either way, liquidity remains the core driver in both directions.
Conclusion
Price has swept major downside liquidity and is now reacting to a key imbalance. As long as the 1H fair value gap holds, I expect short-term upside targeting unfilled inefficiencies and internal highs. A failure to hold would shift the bias back to the downside, with the 97.5k range as the next probable draw on liquidity.
___________________________________
Thanks for your support!
If you found this idea helpful or learned something new, drop a like 👍 and leave a comment, I’d love to hear your thoughts! 🚀

BTC Preparing for Final Sweep Before Breakout?I’m currently waiting for a long opportunity on BTCUSDT. Price is consolidating in a range, and I believe we’re approaching the final support zone within this structure. The key area I’m watching is the 4H imbalance zone between ~102,968 and ~104,535, which also aligns with a strong structural support level.
I expect price to sweep this area, potentially triggering stop-losses below recent lows and then show a bullish reaction If confirmed, I’ll look to enter long targeting the liquidity resting around 108,762.
I’ll be watching closely for a reaction and confirmation

Bitcoin sell short 83000After breaking the long-term trend line and pullback, ready for a sharp move and correction to 83,000
Bitcoin (BTC): Buyers Are Back in Control | New ATH Incoming?Buyers have taken full control once again where we had a good bounce near our buy zone. As we approach the local resistance zone, we are expecting to see a proper breakout from here, which would then lead us to a new ATH (around $120,000).
Swallow Academy

Two Possible #BTC Scenarios: July ATH or September Bull Run?#BTC
#1First Scenario: A pullback to $98K first, followed by a breakout from the Bull Flag pattern targeting $120K and a new ATH by the end of July.
#2Second Scenario: Another pullback, some consolidation to build strength, then a move to a new ATH and a full-fledged bull run into September. In this case, we might rally straight up to $130K without major corrections.

#BTCUSDT.p Bearish📉 Short Trade Alert! We're eyeing a potential downside move with a clear entry, stop loss, and multiple profit targets. Keeping a close watch on this one. #Trading #MarketAnalysis #ShortTrade #RiskReward

Bitcoin Short-Term Outlook – Coming Week📈 Bitcoin Short-Term Outlook – Coming Week
Currently, Bitcoin is expected to gather liquidity around the $106,000 zone, potentially initiating a move toward the $110,000 resistance level.
This area will be crucial in determining the next directional move.
🔍 The market's reaction around $110,000 will be closely monitored, and the analysis will be updated once that level is reached.
📌 Note: This outlook is based on current market conditions and may require adjustments if sentiment or price structure changes.

30/06/25 Weekly OutlookLast weeks high: $108,531.02
Last weeks low: $99,592.69
Midpoint: $104,061.86
Overall a positive week for BTC in isolation as price moves steadily all week reclaiming the losses made in the week from the 16th-23rd June. This comes after a $2.2B BTC ETF weekly inflow, the 3rd consecutive week of net inflows.
Having now hit the key S/R level of $108,500 it will be interesting to see where BTC goes from here. Jumping up above the level will require a lot from the bulls as ATH is within touching distance and so buying into major resistance is a tough ask. We also have Geo-political uncertainties to add to the situation, one bad tweet is all it takes sometimes to do a lot of damage.
On the other hand the SNP500 hits new ATH in the same conditions and so BTC is more than capable of doing the same.
So far in the first hours of this weeks trading we do have a SFP of the weekly high setup, not ideal for the bulls in any way and so from here the a retest of the range quarters, midpoint being the key area would make sense, invalidation would be a clean break above weekly high with acceptance and strong volume on the move to break the rangebound/choppy environment.
There is also the "window dressing" element to the months &quarter end today. History shows a de-risking going into these events and more money flowing back into risk-on assets in the days following monthly/ quarterly end. For that reason a bullish move (if there were to be one) would come later in the week IMO.
Good luck this week everybody!
