It Is Belief That Keeps Bitcoin Alive Above $100,000In recent weeks, following Bitcoin’s surge beyond the $100,000 threshold, a new collective sentiment has taken shape. Each rally strengthens the conviction of long-term holders, and each correction plants new seeds of optimism.
The true battle lies not in price fluctuations, but in ideology. For many, Bitcoin represents far more than a tradable asset it's a paradigm shift. They see institutional adoption, such as government-backed ETFs, not as a luxury but as a necessity. In contrast, short-sighted voices focus solely on speculative price gains, missing the broader vision.
What truly fuels this market is collective belief in the future. The steadfast resistance against recent sell-offs reveals a deep and growing confidence not shaken by volatility but shaped by it.
As the saying goes: For the believer, the struggle is not a barrier it is the path.
BTCUSDT.3L trade ideas

50x leverage no brainer short trade (easy profits)
Keep in mind:
With a big daily bearish engulfing candlestick we are most likely to continue the downtrend for the coming days. Looking at the RSI (daily timeframe) it is clear that we now are in a downtrend from previously being in overbought territory. We are most likely to go from overbought to oversold on the RSI and are now looking for a big downward movement! The MACD is showing weakness on the buy signal it has printed on the daily timeframe and is showing a strong sell signal on the 4 hourly timeframe.
Most important information:
Price action is the most important information you can get and trading on price action is what the pros do!
What we can see is that the price of BTC now is inside a strong key resistance area. Combining this with the huge rising wedge we are most likely to fall back down to the 75k area. Keep in mind that we didn’t really get a good backtest of the 69k-75k support zone so we could be looking to make a good backtest of this zone before continuing the macro uptrend.
I can also identify a failed bullish ascending triangle followed by a trend with lower highs. When the second lower high formed on the hourly I entered the 50x leverage trade at 108528,7 and placed the stop loss above that lower high. Keep in mind that the trend is your friend and that we most likely wont hit the SL. At least not before moving the SL into the profit zone (preferably above a lower high that will form). I have currently put my TP at 75950 (a long way down) because I want to ride this short as long as I possibly can. I also think that we are most likely to keep consolidating (until proven otherwise) between the given ranges (from 69k all the way up to 112k).
What about the news?
I think what president Trump does is the most important news we have to consider while trading. At the time of writing it is still unclear if the Musk VS Trump drama will continue. Bringing negativity into the market. The latest trade agreement with China was also not in favor of the United States (The relation between the two countries can strengthen but at a core financial view this ain’t good). Trump also kind of acted like a dictator in the Los Angeles event (this could bring negative energy into the markets). All in all I think that the news is a bit unstable and this strengthens the hypothesis that the price of BTC will consolidate until better times is around.
Conclusion:
I can always be wrong with either my complete analysis or parts of it. But I think that we at least is going to see a 1,65% move to the downside from my entry point. This move is extrapolated from the failed ascending triangle and seeing this move will give me the opportunity to make the trade risk free (I will keep you updated when this happens)!

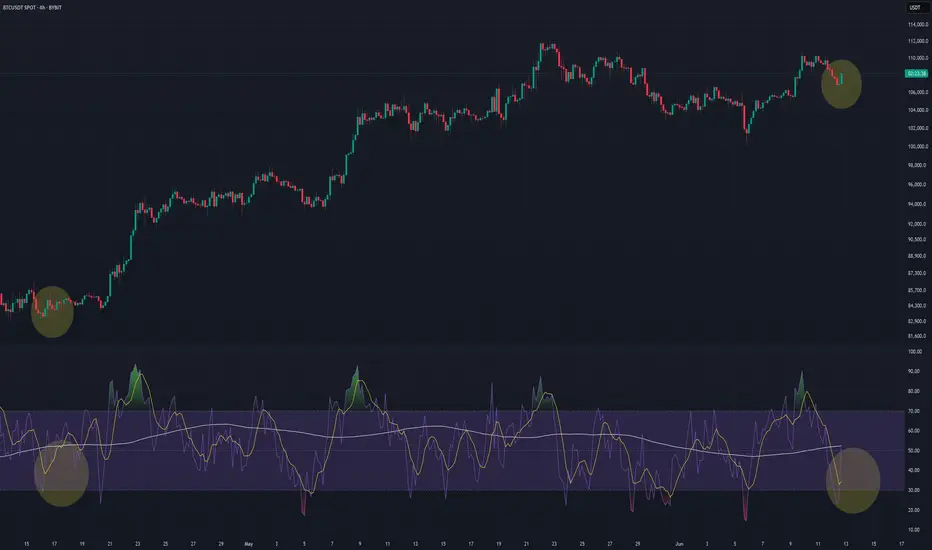
BTC Triple JumpRSI Fired ✔ Breakout Above $110,200 Next ➜ Targeting 140K
BTC is entering a critical phase on the 4H chart, and this setup looks remarkably similar to previous moments that led to sharp bullish continuation. Price is steadily forming higher lows and now pressing right up against the key resistance at $110,200 — the last confirmed swing high. 🧱
What makes this moment particularly interesting is what’s happening beneath the price: momentum is quietly shifting. Using a custom triple RSI setup — with short, medium, and long lengths — I’m seeing a familiar pattern unfold. The white line (longer-term RSI) has already crossed above the 50 level ✅, a strong signal of building trend strength. Meanwhile, both the short and medium RSIs are deep in the oversold zone 🔻 — a dynamic that, in the past, has front-run explosive rallies.
This exact structure has preceded multiple breakout moves over the past months. The RSI alignment acts as an initiative confirmation, and now price is approaching the final confirmation level: a break and 4H close above $110,200. If that happens, I expect a swift push toward $112,500–$114,000, with potential for much more.
🔥 This aligns perfectly with my previous idea, where I laid out a case for a major breakout in June that could drive BTC toward $140K. That outlook was based on higher-timeframe expansion patterns and macro structure — and what we’re seeing now could be the moment where it all starts.
As of now, it’s too early to talk about invalidation. The structure remains intact. Momentum is shifting. All that’s left is the breakout.
If you haven’t seen my 140K projection yet, check it out — this could be the first real ignition point. 🚀
BTC/USDTDo you think Bitcoin has just formed a double top, or is it showing a different pattern? Personally, I think we might range a bit from here and then possibly continue the uptrend. I'm not really into pattern trading—so you tell me, are we bullish or bearish?"

While they panic at 0.618, I loadThis is the type of setup that filters out noise traders. Four-hour price delivered into a stacked FVG zone — aligned with equilibrium, and structured to reprice.
Here’s the logic:
After taking out short-term highs near 111.9k, price repriced sharply — not randomly, but with algorithmic precision — into a series of untouched 240min FVGs.
Price tapped the upper imbalance, hovered at the 0.618 fib retrace (107.3k), and held. That’s not weakness. That’s orderflow.
Below this sits the final FVG + golden 0.786 (106.4k) and round number zone near 105.2k. That’s your invalidation layer. Anything inside it? Still Smart Money accumulation.
Above? The draw remains clear: inefficiency fill to 110.6k and liquidity resting above 111.9k.
My framework:
Bias: Bullish unless 105.2k gets violated with intent
Entry: 107.3k–106.4k
TP1: 108.5k (fib 0.382)
TP2: 110.6k (inefficiency fill)
Final objective: 111.9k raid
Volume confirms the handoff — sellers are trapped chasing the leg, Smart Money has already shifted to accumulation.
Final thought:
I don’t wait for signals. I wait for price to make sense. And here, it’s giving every reason to load.
“Fear at 0.618 is the edge of amateurs. Patience at imbalance is where precision lives.”

Bitcoin Technical Analysis📊 Bitcoin Technical Analysis | BTCUSDT – 1H Timeframe
Key support and resistance zones have been carefully mapped out in this chart — use them as a guide for smart entries and profit targets in your trades.
🔼 If BTC breaks above the key resistance at 107,902, the next targets will be 108,507, 108,842, and potentially 109,377.
🔽 However, if price gets rejected from the 107,902–108,000 zone, watch for support around 107,058, followed by 106,808 and 105,945.
📌 These levels have shown strong reactions in the past and continue to act as key zones for Bitcoin’s movement.
👉 Save this chart and follow for more high-probability setups and live updates!

TradeCityPro | Bitcoin Daily Analysis #115👋 Welcome to TradeCity Pro!
Let’s dive into the analysis of Bitcoin and the key crypto indices. As usual, I’ll be reviewing the futures triggers for the New York session.
⏳ 1-Hour Timeframe
On the 1-hour chart, as you can see, yesterday the price was rejected from the 110256 level I previously mentioned. Following that, with the activation of the 108617 trigger, Bitcoin experienced a downward leg.
📊 Personally, I didn’t open a short position after the break of that level, but if you did, I suggest taking profits now as the price has reached the marked support zone.
🔍 As for me, I’ll wait to see how the price reacts to this support. If it breaks down, we can open a short position.
📈 However, if the price finds support here, we can once again look for a long position. The trigger for this will be found in the lower timeframes.
👑 BTC.D Analysis
Let’s move to Bitcoin dominance. Yesterday, BTC.D made a pullback to the 64.18 zone and now seems ready for another drop.
✔️ If 63.96 breaks, BTC.D could enter another bearish leg. If instead, the 64.18 ceiling breaks, it could push up toward 64.49 or even 64.67.
📅 Total2 Analysis
Looking at the Total2 index, after reaching 1.24 yesterday, it started to correct and dropped down to 1.18, touching the support with a shadow.
✨ If the 1.2 level breaks to the upside, the price could move back toward 1.24. If 1.18 breaks down, the correction may continue further.
📅 USDT.D Analysis
Now onto USDT.D. After a brief correction up to the 4.68 level, it has resumed its downward movement. If 4.64 breaks, the decline could extend toward 4.56.
💥 If instead, the 4.68 top breaks, it might bounce back up toward 4.72.
❌ Disclaimer ❌
Trading futures is highly risky and dangerous. If you're not an expert, these triggers may not be suitable for you. You should first learn risk and capital management. You can also use the educational content from this channel.
Finally, these triggers reflect my personal opinions on price action, and the market may move completely against this analysis. So, do your own research before opening any position.

BTC Long Setup (Short-Term)🚀 BTC Long Setup (Short-Term)
Bitcoin is showing bullish momentum and holding key support levels.
I’m eyeing a short-term long position with a target at 108,294.
If momentum continues, this could be a strong push toward the next resistance zone.
📈 Stay sharp and follow the levels!

BTC/USDT Analysis: Local Downtrend
Hello everyone! This is a daily analysis from a trader-analyst at CryptoRobotics.
Yesterday, despite a positive chart structure, Bitcoin broke out of the accumulation zone to the downside. This move was influenced by the escalation of the conflict in the Middle East and extreme FOMO among retail traders.
The main expectation is a decline toward the nearest buyer zone at $105,800–$104,500 (accumulated volumes), where we will look for long entry opportunities. This zone is very strong and is likely to hold with a 90% probability. An additional confirmation is the presence of predictive liquidations of long positions within this zone, which could serve as fuel for a reversal.
During the decline, two new resistance zones were formed. In the short term, short positions from these areas can be considered until the support is tested.
Sell Zones:
$107,900–$108,500 (strong seller activity)
$109,000–$110,000 (accumulated volumes)
Buy Zones:
$105,800–$104,500 (accumulated volumes)
$101,600–$100,000 (zone of previous pushing volumes + current buyer defense)
$98,000–$97,200 (local support)
Level at $93,000
$91,500–$90,000 (strong buying imbalance)
This publication is not financial advice.

Bitcoin The True king is getting Ready for 130K$It is finally one of those times which happen every few years for Bitcoin and Crypto market and i think personally it is time for a good pump here and for Alt coins.
Major supports now are:
A. 107000$(local support now and here)
B. 102000$(previous daily rejections)
C. 100000$(Major and strong daily support)
After more range or without that soon 114K$ will break to the upside and next strong moves will start there because so many stop loss of sellers and new sellers there can bring good liquidity too.
DISCLAIMER: ((trade based on your own decision))
<<press like👍 if you enjoy💚

Trendline Break Retests: The Setup Nobody Talks AboutHello, Traders! 😎
It’s one of crypto's most overlooked yet commonly recurring structures: the trendline break and retest.
You’ve probably seen it without even realizing it. A clean trendline gets broken, price pulls away, and then, quietly, almost politely, comes back to “kiss” the line before taking off again. Or dropping.
That’s the retest. And in the chaotic crypto world, where hype often drowns out structure, this simple behavior deserves more attention.
🔍 First, What Is a Trendline Really?
A crypto trendline connects key highs or lows on a chart, not to predict the future, but to help visualize the mean price trendline: the market's directional bias. In rising markets, we draw support lines connecting higher lows. In falling markets, resistance lines link lower highs.
Learning how to draw trendlines in crypto properly is a skill in itself. Use wicks or closes? Log scale or linear? Everyone has a method, but consistency is key. If you’re unsure, zoom out and let the chart speak first. But once that line is broken, something changes.
🧠 Why Breaks (Alone) Are Not Enough
In theory, a break of the trendline means momentum has shifted. But in practice? Breaks happen all the time in crypto; many are fakeouts or short-lived. That’s where the trendline break and retest come in. It’s the market asking: “Are we done with this trend?”
Retests often create the cleanest entries for trend continuation, not because they guarantee success, but because they offer structure. They provide a technical “moment of truth” when buyers or sellers show their true strength. And if the retest holds? The move that follows tends to be more confident and less noisy.
📐 Trendline Break & Retest: Mapping the Larger Structure
Looking across the full BTC/USDT weekly chart, several major shifts can be framed through the lens of trendline crypto behavior, particularly the classic sequence of break → retest → continuation.
🔻 2021–2022: Macro Breakdown
After the bull run to ~$69K in 2021, Bitcoin started forming a descending series of lower highs, which gave rise to a macro-level downward trendline — a key reference point for many traders at the time.
🔴 Upper Zone: Failed Retest Cluster
The upper horizontal band (~$47K–$52K) highlights a zone where BTC repeatedly attempted to reclaim the broken structure. Each time the price rallied into this region, sellers stepped in, forming local highs and multiple failed retests (marked with red circles). This wasn’t just resistance — it was a battleground where buyers tried to flip the trend… and couldn’t. This behavior often signals a trendline break rejection, where the market tests the underside of prior structure, then resumes the existing trend.
🔴 Lower Zone: Breakdown and Retest That Held
The lower zone (~$28K–$32K) was formerly a strong support area during mid-2021. Once it was broken in early 2022, the price returned to retest from below, failing to reclaim it, confirming it had turned into resistance. This is a textbook example of trendline retest turned supply, and after the failed reclaim, BTC slid further into the ~$16K range.
✂️ Late 2023: The Breakout
In late 2023, BTC finally broke above the descending trendline, confirming a long-term shift in momentum. Importantly, this wasn’t just a clean breakout. The market returned shortly after to retest the broken trendline, around the $42K–46K range, forming a consolidation zone.
🟩 And Then Came the Retest from Above
Let’s fast-forward to early 2024. After months of chop, Bitcoin finally breaks through that upper red zone (the same one that previously acted as resistance and rejection city). But here’s the part many miss:
It didn’t just moon.
It came back.
Look closely at the green zone around ~$46K–$48K, the same area where BTC got rejected multiple times in 2021–2022. And now? Price pulls back, taps that level from above, and holds.
That makes this zone so interesting: 👉 It’s a classic “retest from the other side”, where former resistance becomes support. The market is saying: “This level matters. Let’s make sure it holds before we go further.” It’s a quiet confirmation and a great example of how crypto trendlines and price memory shape behavior, even months or years later.
🪞 It’s Not Just About Lines — It’s About Psychology
Why does this pattern repeat?
Because breakouts are emotional.
They create FOMO. Traders rush in. Then the market pauses, tests your conviction, and shakes out the impatient.
Retests act like a filter.
They flush out the noise — and confirm who’s really in control.
That’s why drawing trendlines in crypto isn’t just about geometry. It’s about crowd behavior. When enough traders see the same line, and price respects it after the break, it becomes a self-fulfilling zone of interest.
🧭 A Word of Caution
This isn’t a secret formula. Not every trendline crypto setup will play out cleanly.
SOME BREAKS NEVER RETEST.
SOME RETESTS FAKE YOU OUT.
AND SOMETIMES, THE LINE YOU DREW ISN’T THE ONE THE MARKET IS ACTUALLY WATCHING.
But if you learn to draw trendlines in crypto clearly, stay patient, and observe the trendline break retest behavior, you’ll begin to see this pattern appear again and again. Quietly. Consistently.
It won’t make the headlines like “BTC Hits 100K,” but it might just tell the story behind that move. This is just one example. In reality, charts are full of these zones. Each one tells a part of the story. And honestly, why not listen?

BTC ENDED WITH ITS BULL RUN AND NOW IS THE STARTING LINE OF BEARMark my words down as BITCOIN started with its bear RUN!!!
From the view, we can know that bitcoin is unable to break HH recently, and fall sharply align with Nasdaq100, which break through the bull trend from the 4hr view and also daily view. 4% SL and TP 27% pullback bear run is very beneficiary.
When more and more big whale players come in to this game, you have to know who is the banker for now. Binance? Coinbase? Nope. The boss is CME.

[DYOR] BTCUSDT – Rejected from Supply, Watch 200 EMA BreakdownBTCUSDT failed to continue upward and broke below the ascending structure. Now testing key support at 106.9K–107K and the 200 EMA.
📉 Sell on pullback around 108.2K–108.6K
📉 Alternative: Sell stop at 106.3K if breakdown continues
📈 Aggressive bounce possible at 106.9K, but high risk
SL & TP based on key S/R zones
Always apply solid risk management 🚨

BTCUSDT – Ready for the Next Leg Up?Bitcoin is currently consolidating around $107,000 after a strong rally from the ~$73,000 region. I'm using Fibonacci extensions and key support/resistance levels to anticipate potential continuation targets and pullback zones.
Technical Analysis:
Fibonacci retracement levels from previous move:
0.786 – ~$102,359 → strong local support
0.618 – ~$96,382
0.5 – ~$92,185
Current price: ~$106,990
Key resistance: ~$109,971 (Fib 1.0 level)
Potential bullish targets:
1.618 extension → ~$131,956 (medium-term target)
2.618 extension → ~$167,530 (long-term projection)
Bullish Scenario:
If BTC holds above the $102K–$104K area, we could see continuation towards $110K, followed by a breakout toward $132K (1.618 Fib). The structure remains bullish as long as higher lows are maintained.
Bearish Scenario:
A break below $102K opens the door for a deeper retracement toward $96K or even $92K, which aligns with 0.618 and 0.5 Fib levels, respectively.
Conclusion:
Bitcoin is sitting at a critical point. A short-term dip might offer a strong buy-the-dip opportunity. The market structure still favors the bulls unless key support levels are broken.

$BTC - Possible CME Gap FillBINANCE:BTCUSDT | 4h
Watching 106.2k-106k for a potential bounce taking those singleprints/imbalances.
However, if 108.3k rejects, CME gap below likely gets filled around 104k to 102k zone (pink squiggly)

BTC/USD: More Bullish MOVE Ahead? (READ THE CAPTION)By analyzing the #Bitcoin chart on the weekly timeframe, we can see that the price has finally reached our expected level of $111,880, setting a new all-time high.
Currently, Bitcoin is trading around $110,800, and if it manages to hold above this key level, we could expect further bullish movement.
The next potential targets are $130,000 and $163,000, respectively.
Please support me with your likes and comments to motivate me to share more analysis with you and share your opinion about the possible trend of this chart with me !
Best Regards , Arman Shaban

BTC 12.06.25After BTC avoided the last supply there is on the chart since monday, i would expect a reaction as soon it comes in there. There is also a big area of range demand below where i am looking for a bullish reaction. My main focus is at the range high since i still have this HTF distribution scenario in mind and we are right in the first deviation of it.

Bitcoin H1 BreakdownPrice swept 110K with weak volume → no follow-through → sharp rejection.
Now testing 200 EMA near 107K.
Lose it → 105.2K / 103.7K next.
Hold it → bounce to 110.6K likely.
Classic liquidity trap + momentum unwind.


Bitcoin Probabilistic Analysis in the 4-Hour TimeframeIf Jerome Powell lowers interest rates today, we will likely see this trend.
Based on MAKER buy/sell signals and the High/Low of the EMA 200 indicator.

When will #BTC hit a new high?📊When will #BTC hit a new high?
🧠From a structural point of view, we have come to the weekly resistance zone, so it is very reasonable to consolidate sideways here. Only if we successfully break through the resistance here and stabilize above the resistance zone, can we remain optimistic.
➡️The short-term support is around 108800. If we can hold here, then we have the opportunity to build an ascending triangle, which means that we will continue to hit new highs soon, otherwise we need to be alert to the occurrence of a pullback.
➡️106500-107000 is the conversion area of resistance and support, and it is also the psychological defense line of long transactions. If we can't hold here, then we need to be alert to the occurrence of in-depth adjustments.
⚠️Currently in a complex consolidation stage, we need more patience!☕️
🤜If you like my analysis, please like💖 and share💬 BITGET:BTCUSDT.P

Bitcoin (BTC): Sellers Taking Over | Re-Test of Important ZoneWe are dropping hard, where after a clean breakout price is heading now back to the retest area, which will determine the next major movement from here on.
What we are seeking is a successful re-test (which then would trigger our buyside scenario), but if we see that sellers will keep the pressure and take over the control near current region, then we might be looking for slight dip towards the 200EMA line ($104,500)
Swallow Academy

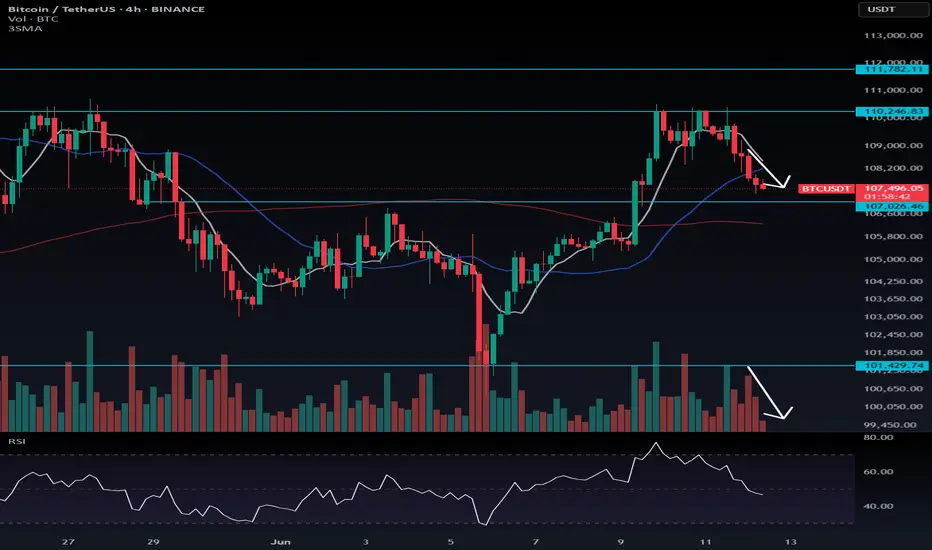
Bitcoin Showing Bullish Intentions as Selling Pressure Weakens📈 Bitcoin Showing Bullish Intentions as Selling Pressure Weakens
In the last three 4H candles, we’ve seen a decline in volume alongside smaller candle bodies, even as the price has moved slightly lower. This typically signals weakening selling pressure and increasing bullish interest.
As long as price doesn't print a lower low below $105,500 and fails to break above $110,246, Bitcoin is likely building structure for a potential bullish breakout. If the current level holds and BTC begins to rally from here, the new higher low would likely be around $107,000 — reinforcing the bullish trend structure.
🧠 Key Insight: Wait for a clear long trigger before entering; the market is currently in a cool-off phase, not a reversal.