BTCUSDT.3L trade ideas
BTC - Short Play - Market Structure UpdateMarket Structure Update:
As we continue forming the right side of the current market structure, several key levels emerge as critical points of control. It's important to highlight that the current formation is mirroring the left side of the structure, and we are now approaching the midpoint of the cycle.
Based on this mirroring cycle, we anticipate downward movement today and tomorrow as the structure progresses toward completion.
---
🔻 Short Entry Zones
A close or wick below the following levels would confirm potential short entries:
109.6k – Left-side structure wick
109.3k – Structural support
108.2k – Key breakdown level
---
🎯 Short Targets
If confirmed, potential downside targets include:
108.3k
105.3k
104.6k
103.2k
102k
101.4k
100.3k
---
🔺 Important Levels to Monitor (If Uptrend Momentum Builds)
In the event of a bullish breakout, keep an eye on:
110.7k – All-Time High wick, right side of structure
111.9k – Wick just below ATH (May 25th), key structural zone
Stay alert. "As Above, So Below."
— ZemoG Trading Group

Is Bitcoin Ready to Launch? In-Depth Analysis of BTC, ETH, XRP, Hello everyone, I hope you're doing well.
Due to time constraints, I won't be analyzing each asset individually. Instead, I’ll provide a collective technical overview in this post.
This analysis includes the following cryptocurrencies: **Bitcoin, Ethereum, Ripple, Solana, Sui, and Chainlink**.
⚠️ **Please note:** On the **daily timeframe**, most of these assets are forming different patterns. However, the **weekly timeframe** provides a clearer and more reliable outlook.
---
### 🔍 **Technical Overview:**
📌 **Bitcoin (BTC)**
Currently forming a **"V" pattern**.
If BTC closes **above \$110,500 on the weekly timeframe**, the first target is **\$131,500**, and the second target is **\$165,000**.
📌 **Ethereum (ETH)**
Also in a **"V" pattern**.
If ETH closes **above \$2,833 on the weekly timeframe**, the first target is **\$4,200**.
📌 **Ripple (XRP)**
Forming a **bullish flag** pattern.
If XRP closes **above \$2.65 on the weekly timeframe**, the first target is **\$4.22**.
📌 **Solana (SOL)**
Forming a **"V" pattern**.
If SOL closes **above \$190 weekly**, the first target is **\$282**.
📌 **Sui (SUI)**
Also forming a **"V" pattern**.
If SUI closes **above \$4.26 weekly**, the first target is **\$6.97**.
📌 **Chainlink (LINK)**
Needs a **weekly close above \$18** to confirm breakout.
First target: **\$25**.
---
### 🧠 **Brief Fundamental Insights:**
* **Bitcoin** is being heavily accumulated by institutional investors and whales. On-chain metrics suggest we are **not at a cycle top**, and the ongoing **supply shock** and **massive exchange outflows** are strong bullish signs.
* **Ethereum** is under **strong accumulation** from both retail and institutional investors, as confirmed by recent **CoinShares reports**.
* **Ripple** is awaiting resolution of its ongoing lawsuit with the **SEC**.
* **Sui** is consistently rolling out updates and shows **unstoppable DeFi ecosystem growth**, giving it strong fundamental support.
* **Solana** is being accumulated by institutional players, including **SOL-specific strategies** and funds.
* **Chainlink** is seeing buying pressure supported by **positive news and strategic partnerships**, some of which are from **anonymous large players**.
---
🧠 Updated Fundamental Analysis (June 2025)
Bitcoin (BTC)
New Investment Record: In May, total investments in crypto funds reached $167 billion, with Bitcoin accounting for $5.5 billion, signaling strong institutional demand.
Institutional Buying Surge: ETF purchases, entries by institutions like Paris Saint Germain, and even countries like Pakistan have contributed to declining exchange reserves of Bitcoin.
Favorable Macro Conditions: Rising bond yields, stock market volatility, and a weakening U.S. dollar have made Bitcoin more attractive as a hedge asset.
Ethereum (ETH)
Consistent Inflows: Ethereum funds have seen seven consecutive weeks of capital inflows, with nearly $296 million added in the past week alone.
Institutional Confidence: Assets under management (AUM) in ETH funds have reached approximately $14 billion, indicating strong long-term faith by institutions.
Solana (SOL)
Strong Institutional Demand: Firms like Société Générale and Siebert Financial have recently invested in Solana.
On the Verge of ETF Approval: Franklin Templeton filed for a spot Solana ETF back in February, potentially boosting demand.
Whale & DeFi Growth: Increased whale activity, growing DeFi ecosystem, and rising developer engagement hint at a potential price rally to $200 and beyond.
Ripple (XRP)
While there is no major new fundamental data recently, the listing of XRP futures on CME and broader access for institutional investors may have a positive impact.
The ongoing legal case with the SEC remains a crucial factor in XRP’s future outlook.
Sui (SUI)
DeFi Expansion: Active daily users have grown by over 14%, and decentralized exchange volume has reached around $34 million per day.
TVL Growth: Suilend’s Total Value Locked (TVL) has hit $700 million, ranking 8th among all blockchains.
Institutional Attention: There are reports suggesting that an ETF for SUI may be under consideration, with on-chain utility continuing to expand.
Chainlink (LINK)
Collaboration with Major Financial Institutions: Chainlink is participating in CBDC pilots between Hong Kong and Australia, working with Visa, ANZ, and the Hong Kong Monetary Authority.
Ecosystem Growth: Development is supported via grants, like the $150K funding provided to Lightchain AI, strengthening Chainlink’s infrastructure.
Strategic Partnerships: Collaborations with JPMorgan, Ondo Finance, and Swift highlight Chainlink’s growing influence in connecting real-world data to blockchains.

BTC - Be mindful of resistance around 109,800 to 110,000Per my second last post about this red trendline - be mindful that there is a resistance located 109,800 to 110,000 zone.
Although Bitcoin can break above, that doesn’t mean the resistance is invalid. Price will weave above and below until it sticks and plays out.
Personally I watch these levels for sudden fast movement and confirmation that it’s holding as resistance.
If you see a fast drop initiate from these levels, be mindful that this could be indicative of intention to hit the lows around 20,000.
For more information see my previous posts.
Happy trading


#BTC Update and Altcoin StrategyCRYPTOCAP:BTC Keeping it simple.
If Bitcoin breaks above the current level, BTC will hit a new ATH, and altcoins may face a short-term hit but will recover, following Ethereum’s lead.
If BTC gets rejected, altcoins will likely take another hit and recover with Ethereum.
What’s the common pattern here?
Altcoins are setting up for a sustained bullish move.
It’s just a matter of time.
This is not the market to over-leverage.
Protect your capital and position yourself wisely for the real opportunities ahead.
Patience now will pay off later.
Cheers.
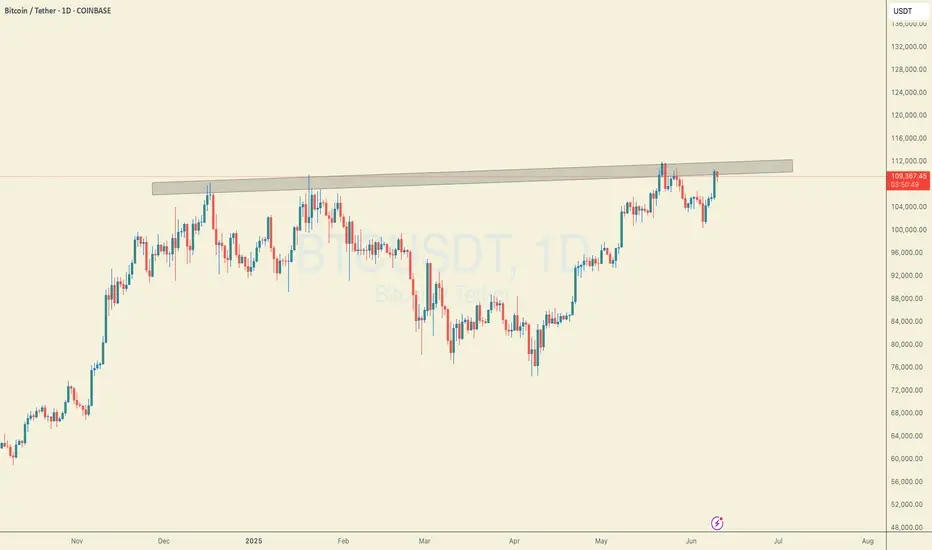
Will there be a new ATH soon?BTC trading above the January ATH again is a big deal since it was the point of rejection in May.

BTCUSDT Re-Test Complete Bullish Continuation Back in PlayAs anticipated in the previous analysis, BTC has successfully completed the projected retest of the $100,000–$101,000 zone. The price action within this region confirmed strong demand and validated it as a key structural support.
With the retest fulfilled and buyers stepping back in, the bullish continuation structure remains intact. We now shift focus toward the next upside targets around $123,420, $136,000, and $149,450, which form the anticipated confluence resistance zone for this current bullish cycle.
So long as price continues to hold above the $100K structure, market sentiment remains constructive. Any decisive break below this zone would warrant a re-evaluation of the short-term bias.
Stay sharp and manage risk accordingly. Feel free to share your thoughts in the comments.

Bitcoin’s Next Big Move? Watch This Before It Happens!In today’s class, we broke down the next key Bitcoin setups. We analyzed past price action to help predict future moves, and we're patiently waiting for bullish continuation – but we’re also staying cautious of a possible range deviation from Monday’s high.
Stay sharp and be prepared for both scenarios!
Follow to stay on top if the curve.

$BTC - Top Down BYBIT:BTCUSDT.P Top Down (10/06/25)
V-Levels Bias
Weekly = Bullish
Daily = Bullish
10-Hour = Bullish
1-Hour = Bullish
V-Levels Momentum
Weekly = Bullish
Daily = Bullish
10-Hour = Neutral
1-Hour = Neutral
Analysis & Insights
DeCode Market Breakdown
Macro Context
Overall, the Weekly structure remains bullish — both in bias and momentum. We’re trading below a key level at $111,968.0, and continuation is likely unless we see a clear Failed Auction at that level.
That would trigger some serious red flags and force a reevaluation of the directional bias.
Daily Chart
Daily structure is extremely bullish at the moment.
The price recently showed a Failed Auction around the $102,000.0 V-structure Higher Low — indicating aggressive absorption and buyer strength.
As long as price holds above that area, the priority is to stay on the long side.
⸻
10-Hour Chart
Still holding a bullish structure overall.
One thing I’ll be watching closely: the price reacting to the previous High at $110,660.8.
If we get a rejection + Failed Auction at that level, that opens up the possibility for intraday shorts; as a short-term shift in momentum and local resistance kicks in.
1-Hour Chart
📈 Long Setup: Waiting for a clean entry from an OTE / Fib zone + Over/Under structure.
📉 Short Setup: Watching for a sweep of the current highs + a clear Failed Auction (ideally with footprint confirmation).
There’s visible compression between $104k and $105k, so price might look to grab liquidity there first before any real move upward.
10-Min Chart
Currently, no clear trade setups on the 10M.
The 1H hasn’t reached optimal trade zones yet. I’ll be watching closely for any structure shifts or setups aligning with the macro bias.
⸻
🔍 Trading Plan Summary
Bias: Bullish (Weekly + Daily)
Look for longs aligned with HTF support + intraday confirmation
Short opportunities only if we get clear rejection from $110,660.8 + footprint signals

The bulls' strong momentum drives a new all-time high.hour gain stands at 4%, and the weekly increase expands to 6.7%. The total market capitalization has rebounded above $2.5 trillion. Three major positive factors have resonated: the expectation of (eased) Sino-US trade tensions, the SEC's policy shift to support on-chain innovation, and the continuous inflow of institutional capital (notably, Ethereum ETFs have seen 15 consecutive days of net inflows).
For the next 24 hours, the focus will be on the breakthrough of the all-time high at $111,980. The first resistance level is $112,500 (a dense short liquidation zone).
Humans need to breathe, and perfect trading is like breathing—maintaining flexibility without needing to trade every market swing. The secret to profitable trading lies in implementing simple rules: repeating simple tasks consistently and enforcing them strictly over the long term.
Trading Strategy:
buy@107000-107500
TP:109000-1095000

Hanzo / BTC 15 Min ( Accurate Tactical Bearish Breakout )🔥 BTC – 15 Min Scalping Analysis
⚡️ Objective: Precision Breakout Execution
Time Frame: 15-Minute Warfare
Entry Mode: Only after verified breakout — no emotion, no gamble.
👌Bearish Break : 109000
Price must break liquidity with high volume to confirm the move.
☄️ Hanzo Protocol: Dual-Direction Entry Intel
➕ Zone Activated: Strategic liquidity layer detected — mapped through refined supply/demand mechanics. Volatility now rising. This isn’t noise — this is bait for the untrained. We're not them.
🩸 Momentum Signature Detected:
Displacement candle confirms directional intent — AI pattern scan active.
— If upward: Bullish momentum burst.
— If downward: Aggressive bearish rejection.
🦸♂️ Tactical Note:
The kill shot only comes after the trap is exposed and volume betrays their position.

Bitcoin done and next target - $96,000⚡️ Hello everyone! Bitcoin reached $110,000 and everyone started celebrating. The market also rebounded slightly. But is everything really that great, and what's next for BTC?
Let's take a look:
Bitcoin is now undergoing a correction after reaching the $110,000 level. The rest of the market looks more buoyant than the first cryptocurrency. ETH is already trading at $2,700, pulling many altcoins with it. Apparently, position fixing in Bitcoin and liquidity spillover into altcoins have begun.
➡️ There is practically no liquidity left at the top. At the $110,000 level, only 100 million shorts were liquidated. According to the liquidation map, if the price drops to $100,000 right now, more than $10 billion in longs will be liquidated!
➡️ Two gaps have also formed below us: 102,800 - 96,990 and 93,310 - 88,470. And as we know, in 99% of cases, gaps close sooner or later.
⚙️ Metrics and indicators:
Money Flow - liquidity inflow is still positive overall. However, since May 22, profit-taking has continued and liquidity has been decreasing.
Volume - divergence in volumes. Purchasing power is weakening as prices rise, which means that there is little chance of moving much higher from these levels. There is still a lack of liquidity in the market.
Liquidation Levels - there are two more obvious short stop zones above. But globally, there is now much more liquidity below than above. So if we fail to consolidate above the $108,600 level, the market is likely to go lower.
DSRZ - the nearest strong support level is at 99,800 - 99,900. This is the first zone of potential price reversal back to growth in the event of a correction.
📌 Conclusion:
I continue to say that it is summer now and liquidity in the markets will be decreasing. No matter how good things look now. At the first signs of weakness, positions will be closed instantly. No one wants to spend their vacation days watching the market.
Especially in a market where any news from Trump can cause prices to drop by several percent in the blink of an eye.
⚠️ I see two options:
It will be an exceptional summer. Bitcoin will spend it in the range of 108,000 - 88,000. And in the fall, when everyone expects growth, it will begin to decline. This cycle is already different from others, so I wouldn't be surprised by that.
It will be a standard summer, and by July we will begin a slow and dull correction. To return to growth in the fall.
Write your opinion and have a good week, everyone!

Bearish Shark Harmonic: Bitcoin Faces Potential PullbackBitcoin has confirmed a bearish shark harmonic on the intraday timeframe, indicating potential for a short-term correction. Volume remains average, with no signs of a short squeeze behind the move, increasing the likelihood of a reversal back into key volume zones.
Key Highlights:
Price testing the Value Area High — a key inflection level
Downside targets: Point of Control and 0.618 Fibonacci retracement
No short squeeze detected — risk of long squeeze triggering range rotation

Today's Bitcoin Signal: Time to be braveHello friends🙌
Given the good price movement from support and buyers entering, now we can enter the position with capital and risk management and move with it to the specified targets.
🔥Join us for more signals🔥
*Trade safely with us*

Waiting for confluence on PAR & TSI before entering a tradeWaiting for confluence on PAR & TSI before entering a trade. Put SL over swing high or low

TradeCityPro | Bitcoin Daily Analysis #113👋 Welcome to TradeCity Pro
Let’s dive into the Bitcoin analysis and key crypto indexes. As usual in this analysis, I’ll walk you through the futures triggers for the New York session.
⏳ 1-Hour Timeframe
As you can see in the one hour timeframe, Bitcoin has continued its upward movement and reached the 110256 level and is now undergoing a correction.
✔️ If the price continues correcting, the next support level will be 108777. In case of a deeper pullback, the next area to watch is 106586.
📈 For a long position, our first trigger level is 110256, with a target of 111747.
📊 Market volume is currently increasing, and if this inflow of buy volume continues, the probability of a bullish move increases.
💥 The RSI oscillator has dropped below the 70 level. If RSI reenters the overbought zone, we’ll also get a strong momentum confirmation.
👑 BTC.D Analysis
Let’s take a look at Bitcoin Dominance. Today, it finally closed below the 64.49 level and has dropped to 64.12.
⚡️ This drop has allowed capital to flow into altcoins, and many of them are moving upward today. If 64.12 breaks, the downtrend may continue.
📅 Total2 Analysis
Moving on to Total2, this index finally broke above the 1.21 level and is now heading toward 1.24.
💫 At the moment, there is no major resistance preventing the market from continuing its upward trend. But there’s an important point regarding USDT Dominance, which I’ll cover below.
📅 USDT.D Analysis
During this bullish move in the market, the dominance of Tether hit the support at 4.56, while other indexes and most altcoins activated their triggers.
🔑 The key point here is that Tether Dominance has such a significant influence on the market that the inability to break this support has caused the entire market, including Bitcoin, to start correcting.
🔽 The 4.56 level in USDT Dominance is very important and will be the key to triggering the next bullish leg.
❌ Disclaimer ❌
Trading futures is highly risky and dangerous. If you're not an expert, these triggers may not be suitable for you. You should first learn risk and capital management. You can also use the educational content from this channel.
Finally, these triggers reflect my personal opinions on price action, and the market may move completely against this analysis. So, do your own research before opening any position.

BTC/USDT Analysis: Best Long Entry Zones
Hello everyone! This is a daily analysis from a trader-analyst at CryptoRobotics.
After a strong breakout through the high-volume zone of $104,500–$105,800 and a full trend reversal to the upside, Bitcoin has reached its resistance zone at $107,000–$109,800 (accumulated volumes). At the upper boundary of this range, strong volume anomalies and profit-taking were recorded. The global trend remains bullish, but currently, there is a possibility of a strong correction down to the $105,800–$104,500 zone (accumulated volumes), which also roughly coincides with predictive liquidations that act as a magnet for the price.
An initial correction has already begun, but strong absorption of selling pressure has appeared around ~$109,200. If this level is breached without a renewed defense, the likelihood of further decline increases.
Sell Zone:
$110,000–$110,600 (profit-taking by large players).
Buy Zones:
$105,800–$104,500 (accumulated volumes),
$101,600–$100,000 (zone of previous pushing volumes + current buyer defense),
$98,000–$97,200 (local support),
Level at $93,000,
$91,500–$90,000 (strong buying imbalance).
This publication is not financial advice.

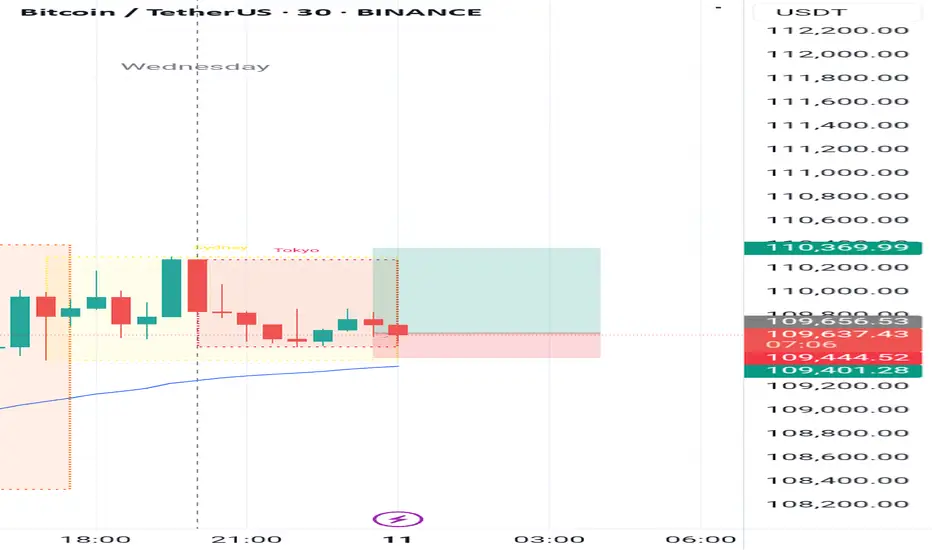
BTCUSDT Hello traders. I’ve spotted an ideal entry opportunity on the BTCUSDT pair. I’ve taken the trade and wanted to share it with you as well.
🔍 Trade Details
✔️ Timeframe: 15-Minute
✔️ Risk-to-Reward Ratio: 1:2
✔️ Trade Direction: Buy
✔️ Entry Price: 109,357.89
✔️ Take Profit: 110,502.43
✔️ Stop Loss: 108,768.53
🔔 Disclaimer: This is not financial advice. I’m simply sharing a trade I’ve taken based on my personal trading system, strictly for educational and illustrative purposes.
📌 Interested in a systematic, data-driven trading approach?
💡 Follow the page and turn on notifications to stay updated on future trade setups and advanced market insights.

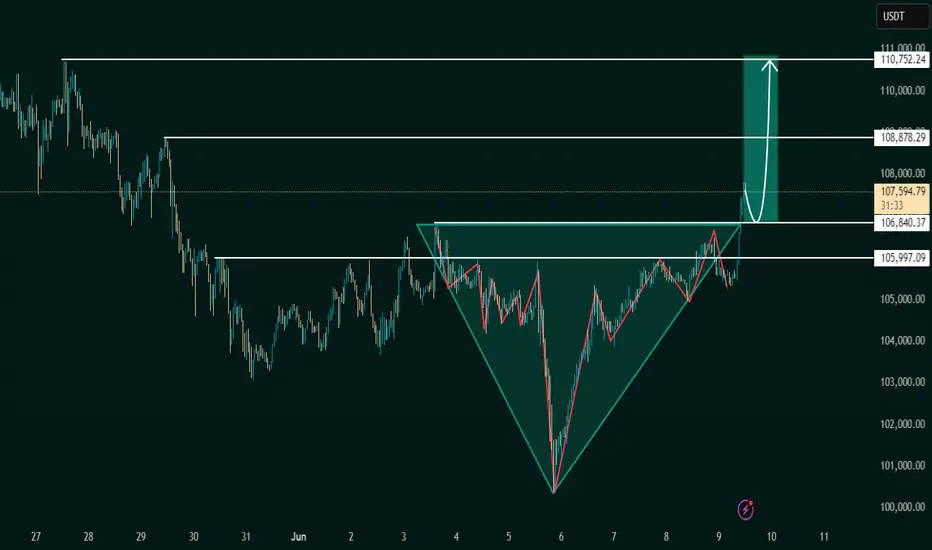
Inverse Head and Shoulders Breakout Signals BullishThe chart under review presents a classic Inverse Head and Shoulders pattern, a reliable and widely recognized bullish reversal formation in technical analysis. This structure typically forms after a downtrend, indicating a potential shift in market sentiment from bearish to bullish.
The pattern is composed of:
Left Shoulder: A modest price decline followed by a temporary upward correction.
Head: A deeper price decline forming the lowest point in the pattern.
Right Shoulder: A higher low that mirrors the left shoulder, followed by another upward movement.
The neckline, which acts as a critical resistance level, is clearly illustrated at approximately 106,840.37 USDT. A confirmed breakout above this neckline suggests the completion of the reversal pattern and validates the potential for a sustained bullish movement.
2. Breakout Confirmation
The current price action confirms a successful breakout above the neckline, with the market currently trading around 107,586.58 USDT. This breakout is a key signal for bullish continuation, provided it is supported by increased volume and follow-through price action.
From a technical standpoint, the breakout is reinforced by:
A clean violation of neckline resistance
Price consolidation near breakout zone before a strong upward thrust
Higher lows preceding the breakout, indicative of growing buying pressure
This confluence of technical signals strengthens the case for an upward price trajectory in the near term.
3. Projected Price Targets
Upon confirmation of the Inverse Head and Shoulders breakout, target levels can be derived using the measured move technique. This involves projecting the vertical distance from the head to the neckline upward from the breakout point.
Target 1 (Initial Resistance):
108,878.29 USDT – This level represents a potential short-term resistance where price may consolidate or retrace slightly before continuing.
Target 2 (Measured Move Completion):
110,752.24 USDT – This is the ultimate price target derived from the height of the head-to-neckline structure. Reaching this level would represent the full realization of the reversal pattern.
4. Key Support and Risk Levels
Risk management is a critical component of any trading strategy. The following support levels should be closely monitored:
106,840.37 USDT (Neckline Support):
Former resistance turned support. Holding above this level post-breakout is essential for sustaining bullish momentum.
105,997.09 USDT:
Acts as a secondary support level and potential stop-loss region for conservative traders.
If price fails to hold above the neckline and falls back below these levels, the breakout could be classified as a false breakout, warranting caution.
5. Strategic Implications for Traders
This setup provides a favorable risk-to-reward ratio for long entries, particularly for traders seeking to capitalize on momentum-based patterns. An optimal trading approach could involve:
Entry: Near the neckline breakout or on a minor retest of 106,840.37 USDT
Stop-Loss: Below 105,997.09 USDT or under the right shoulder to account for volatility
Take-Profit Zones: Partial profits near 108,878.29 USDT, with final target at 110,752.24 USDT
6. Final Remarks
This chart illustrates a textbook example of a bullish reversal pattern in play. While the technical outlook is favorable, traders should remain cautious of potential invalidation scenarios, especially in highly volatile or news-driven markets. Confirmation through volume analysis and supportive macro/fundamental conditions can further enhance confidence in the bullish thesis.
Overall, the current setup indicates a well-structured opportunity for upward price movement, with a clearly defined entry, risk, and reward framework.
Let me know if you'd like this tailored for a trading journal, client report, or automated strategy setup
Bitcoin H1: Effort vs Result Breakdown!Massive selling volume spikes near the last swing low, but price reversal came in strong! 📉➡️📈
The law of Effort vs Result at play:
Effort: Sellers dumped hard, but the result? A bullish reversal 🚀
Result: Price back above key levels and closing near $109.5K. 💥
🔮 Price Target:
→ Immediate Resistance: $110K
→ Next Extension: $112K
This move shows that even with high volume sell-offs, buyers are in control. 🚀💰

BTC - TradeRight now, we're seeing resistance at the former ATH.
If we manage to break out of this area, I think we’ll likely shoot past the current ATH, possibly into price regions of .
But nobody knows the exact price.
LFG!

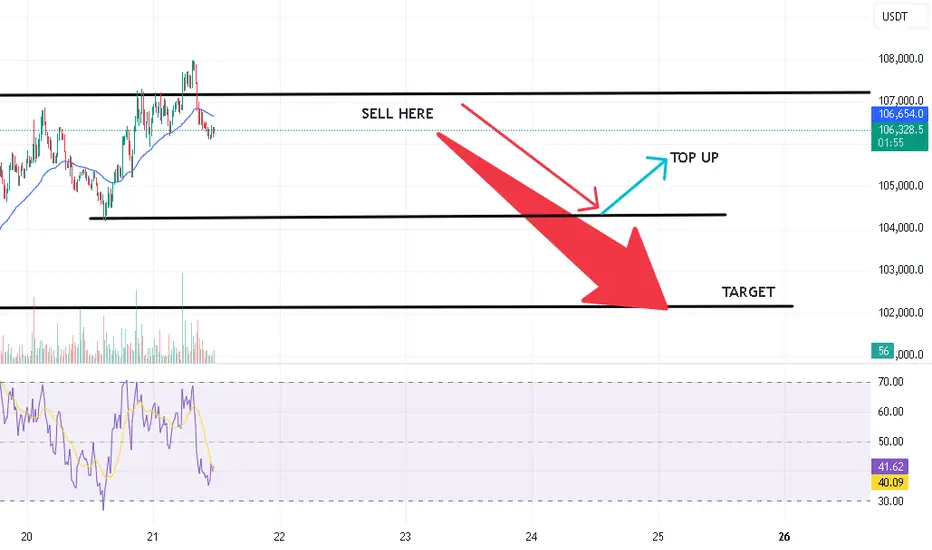
BEARS INTO MARKET FOR BTC SELL COMINGHi Guys Expecting some sell for BTC
I can see some Seller walk into market thats possible will sell next few days
Lets see what happens
Best of luck