BEARS INTO MARKET FOR BTC SELL COMINGHi Guys Expecting some sell for BTC
I can see some Seller walk into market thats possible will sell next few days
Lets see what happens
Best of luck
BTCUSDT.3L trade ideas
BTC: Strong bullish trend, key resistance 111–112k in focus__________________________________________________________________________________
Technical Overview – Summary Points
__________________________________________________________________________________
Strong bullish momentum across all timeframes (1D to 15min).
Major supports: 100335, 104940, 106743 – multi-timeframe confluence, natural risk management levels.
Key resistances: 109952 – 111949 (historical pivot zones).
Risk On / Risk Off Indicator clearly favoring "Risk On" (strong buy). Tech sector in leadership mode, favorable context.
Volumes normal to moderately elevated, no major behavioral anomalies (ISPD DIV neutral).
No significant divergence between technical and behavioral indicators detected.
__________________________________________________________________________________
Strategic Summary
__________________________________________________________________________________
Overall bias : firmly bullish, but tactical caution just below 111,000–112,000.
Opportunities : prioritize buys/reloads on pullbacks to 104,900–100,300.
Risk zones : clean break below 103.7k ⇒ risk of acceleration to 95.6k; invalidation if daily close <103,700$ or >2 sessions <97,100$.
Macro catalysts : Fed decision (06/18), US CPI (06/12), Trump speech (06/10); anticipate higher volatility.
Action plan : engage tactically below resistance; recommended swing stop-loss at $97,000; active management after each catalyst event.
__________________________________________________________________________________
Multi-Timeframe Analysis
__________________________________________________________________________________
1D : Massive support 100k-103k, critical resistance 111–112k. Robust momentum and context, no behavioral overheating.
12H : Steady staircase progression, intermediate supports respected (104940–106743), healthy volumes, ongoing up-trend.
6H : Bullish background, no excessive flow or defensive behavioral signals.
4H : Resistance zone test (111949–109952), structure remains solidly up, no reversal detected.
2H : Slightly rising volumes on resistance test, no behavioral excess. Positive momentum.
1H : Active resistance test, moderate volumes. Bullish structure intact.
30min : Micro-consolidation below resistance, no excessive volume/behavior. Trend up.
15min : Volume spike on last upward move, rapid normalization. Reload possible if breakout above 110k is confirmed.
Multi-timeframe summary : Bullish confluence, no strong reversal signal as long as support at 103.7k holds.
Risk On / Risk Off Indicator : Strong buy, tech sector leading, no structural risk detected in capital rotation.
__________________________________________________________________________________
Synthesis & Decision-Making
__________________________________________________________________________________
Dominant structure : BTC market structurally bullish, supported by multi-timeframe converging supports and solid tech sector.
No behavioral anomaly (ISPD DIV neutral); volumes under control; only vigilance below 111–112k due to matured seller pressure.
Macro context : Fed’s rates unchanged expected, major catalysts nearing with potential for significant volatility.
On-chain analysis : active distribution from long-term holders, critical area 103.7k–97.1k, demand must absorb “long-duration” supply.
Trading recommendation : favor buys/reloads on pullback (104,900–100,300); tactical caution under 111–112k; swing stop-loss at $97,000 advised.
BTC structurally bullish, but approaches a critical phase: robust multi-timeframe supports, positive macro momentum, no excessive behavioral exuberance. Heightened vigilance required below 111–112k due to pressure from long-term holders; dynamic risk management needed around major macro events.
__________________________________________________________________________________

DeGRAM | BTCUSD fixed above the downtrend line📊 Technical Analysis
● Bulls pierced the descending purple trend-line and closed two candles above the 106 k pivot, confirming a pennant breakout and resetting higher-lows along the black mid-channel.
● Re-test of 104.8 k demand (green band) held as support; the new up-sloping flag projects to the 111.8 k-112 k red supply at the channel roof, with dynamic backup now rising to 103.8 k.
💡 Fundamental Analysis
● U.S. CPI whispers point to a softer June headline while spot-ETF cohort added another 3 200 BTC in two sessions and exchange reserves keep declining, underscoring supply squeeze amid easing rate fears.
✨ Summary
Long 104.8-106 k; sustained trade >107 k targets 111.8 k → 115 k. Bull thesis void on a 4 h close below 99 k.
-------------------
Share your opinion in the comments and support the idea with a like. Thanks for your support!
Bitcoin - Bulls in Control: Aiming For $110kBitcoin has just confirmed a strong bullish breakout after consolidating beneath a prior fair value gap. The market not only broke out of that zone cleanly but did so with conviction, creating a new inversion fair value gap (IFVG) along the way. This type of structure often indicates a shift in sentiment, especially when paired with increasing volume and impulsive candles.
Fair Value Gap Break and Continuation Context
Following the breakout, price surged straight through another 4H FVG overhead, flipping it with strength and no hesitation. That kind of move shows clear intent. The market didn't pause or stall at resistance, which increases the probability that the same pattern could play out again, clean break, shallow pullback, and continuation. The breakout level now holds as short-term support.
Near-Term Expectations – FVG Fill Before Higher
With this latest 4H candle close, I’m now expecting a short pullback to fill the newly created 4H FVG below. This would provide the market with the fuel it needs to continue higher without leaving inefficient price action behind. The structure is setting up a classic breakout-fill-continue sequence, and the next key objective sits just below a clear resistance zone overhead.
Conclusion
Bitcoin broke out of a compression zone, formed an IFVG, and followed up with a strong push through the next fair value gap. I’m expecting a controlled retracement to fill the new 4H imbalance, after which price could continue pushing toward the major resistance area. The momentum is clean and structured—until that changes, continuation remains the more likely path.
___________________________________
Thanks for your support!
If you found this idea helpful or learned something new, drop a like 👍 and leave a comment, I’d love to hear your thoughts! 🚀

#BTCUSDT(BITCOIN): Two Targets First $130,000 And Then $150,000Bitcoin is poised for significant distribution, with a potential price surge to $130,000, followed by a swing target of $150,000. The current accumulation phase is poised to transition into a substantial bullish move. We anticipate a surge in bullish volume in the coming days or weeks. Our analysis anticipates this transition to be completed by the end of the year or sooner.
It is important to note that this analysis does not guarantee a specific price movement and is provided solely for educational purposes.
We extend our best wishes for your successful trading endeavours. If our analysis has been of assistance, we would appreciate it if you could express your gratitude by liking and commenting.
For further insights, please follow our account.
Team Setupsfx_

BTC 4H – Critical Support Zones Being TestedCRYPTOCAP:BTC is currently retesting its $107.2k support, which has now turned into resistance after a decisive breakdown.
Support Levels to Watch:
- Upper Support Zone: $105k – $104.4k
- Lower Support Zone: $101.4k – $100.7k
Bounce from $104.4k–$105k will be a temporary relief, but it needs strength to reclaim $107.2k.
If the upper zone is not held, the next leg will be towards the lower zone, near $101.4k—$100.7k.
Breakout confirmation only above $110k (previous rejection zone).
The market is showing signs of weakness, especially with increased selling around resistance. Avoid rushing into trades—better setups may come if key zones hold or break.
Tip: Watch for bullish divergences or strong volume at the lower support for potential reversal setups.

BTC Returns to Highest ATH💎 Update Plan BTC (June 10)
BlackRock’s spot Bitcoin ETF has made history, becoming the fastest-growing exchange-traded fund (ETF) ever by surpassing $70 billion in assets under management (AUM).
The iShares Bitcoin Trust (IBIT), launched in January 2024, has achieved this milestone in record time, reflecting surging demand for Bitcoin exposure through regulated, mainstream investment vehicles. IBIT’s exceptional growth trajectory has outpaced all previous ETFs, eclipsing even established funds like the SPDR Gold Shares (GLD) in terms of asset accumulation speed.
The ETF recently returned to net inflows — posting a $274 million single-day increase — following a brief period of outflows during a broader market pullback. This rebound signals renewed investor confidence, with capital flowing in from both institutional players and retail investors alike, underscoring Bitcoin’s growing role in diversified portfolios.
Technical analysis angle
Congratulations to investors when the Plan transaction has detected the bottom of 100k and is currently the highest at 110.5k. It is a prosperous signal for investors who are holding this power currency
Another good news is that the organizers have breaked out of the decrease price channel to confirm the trend of increasing and confidence in the price increase continues to be enhanced by the Buyer.
Currently, the BTC price area is slowed by the resistance level with Fibo 0.786 around the 110k price area. We expect the adjustment of the investors to collect goods before the price area goes further around 111.5k even 115k
At this time, whether new or old, should spend more time to practice, load more knowledge about the PTKT, as well as find knowledge posts at the channel ..., to strengthen the solid foundation, as well as avoid losing money at this time offline
==> Comments for trend reference. Wishing investors successfully trading

BTCUSDT UPDATEBitcoin's likely move scares me. Let's be careful. Bitcoin dominance could also move with this decline.

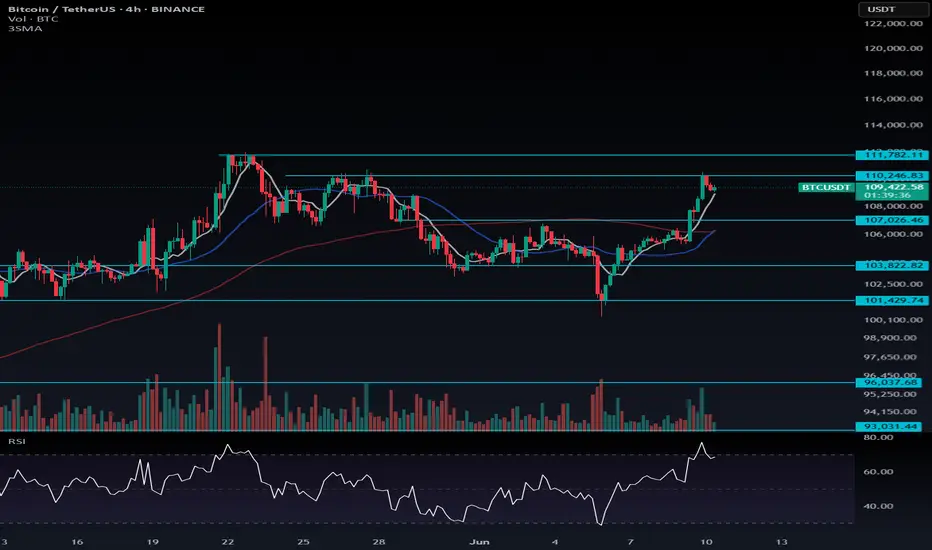
Bitcoin Price Update📊 Bitcoin Price Update: Key Resistance Zone Between $110K and $111.7K — Range-Bound Potential Ahead
As previously mentioned, Bitcoin's price action suggests that a break above $106,355 would signal the start of a bullish trend, and so far, we've seen upward momentum maintained while staying above $107K.
Now, Bitcoin has reached a critical resistance zone between $110,246.83 and $111,782.11. This area presents a potential for market hesitation, as it aligns with a strong resistance level. Given the significant movement over the past few days, it’s possible the market may enter a range-bound phase as it consolidates and structures itself for the next move.
---
📉 Possible Short-Term Range:
Range Between: $110,246.83 to $111,782.11
Expect possible sideways consolidation before continuing the trend
---
📈 Bullish Continuation:
As long as Bitcoin remains above $107K, the bullish trend remains intact
Break above $111,782.11 may signal continuation toward higher targets
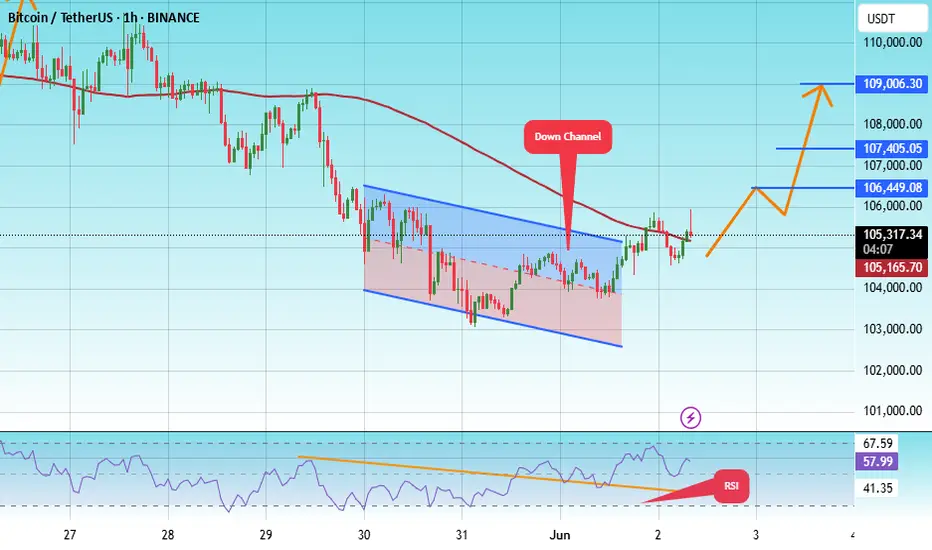
#BTC/USDT#BTC
The price is moving within a descending channel on the 1-hour frame, adhering well to it, and is heading for a strong breakout and retest.
We are experiencing a rebound from the lower boundary of the descending channel, which is support at 103141.
We are experiencing a downtrend on the RSI indicator, which is about to break and retest, supporting the upward trend.
We are looking for stability above the 100 moving average.
Entry price: 105268
First target: 106500
Second target: 107405
Third target: 109006
Tuesday Scalps! 🔥 These are the scalps I’ve got my eye on today. 🔥
Mostly looking at continuation longs — unless structure tells a different story.
💡 Key Plan:
For each long setup, I’ll wait for an internal market structure (MS) flip before pulling the trigger. No confirmation, no entry. Precision is the priority.
📅 Class Schedule:
Tuesday | After 6 PM

DeGRAM | BTCUSD held the $100k level📊 Technical Analysis
● Bounce from 99.8-100 k confluence (violet trend-line + former wedge top + horizontal demand) confirms the zone as fresh support.
● Price coils in a tight pennant under 106 k; 1.618 target of the pattern meets the rising-channel roof and red supply at 111-112 k, while RSI prints higher lows, flagging hidden bullish momentum.
💡 Fundamental Analysis
● CME futures basis widened above 10 % annualised as softer US claims cooled dollar bids, boosting carry appetite; meanwhile, on-chain reserves keep shrinking, hinting at supply squeeze.
✨ Summary
Buy 100-103 k; pennant break >106 k aims 111 k → 115 k. Bull view void on an H16 close below 99 k.
-------------------
Share your opinion in the comments and support the idea with a like. Thanks for your support!

Bitcoin Rally Overextended: Patience is Key for the Next Move💹 BTC/USDC – Bullish Outlook, heres my Trade Plan.
Bitcoin (BTC/USDC) is currently maintaining a strong bullish trajectory 🚀, showing impressive momentum after breaking through recent resistance levels 🔓.
However, price is now overextended from the last swing low, and I’m anticipating a pullback into value 🔄 — specifically targeting the 50%–61.8% Fibonacci retracement zone drawn from the latest swing low to swing high 📐. This zone often acts as a rebalancing point for institutional traders and provides confluence for smart entries 🎯.
I’ll be closely watching this retracement area for signs of support forming, and more importantly, a bullish break in market structure 🧠📊. Only after that confirmation, would I consider executing a long position — no structure break, no trade ✅.
This isn’t about predicting — it’s about reacting with discipline.

Bitcoin Approaches Resistance as Momentum Cools: What’s Next?Bitcoin has been on a strong upward trend 🚀, but recent moves show signs of exhaustion as it approaches major resistance zones 🛑. The appearance of a three-drive pattern on the 4-hour chart, suggests the market could be due for a healthy correction 🔄. While the broader trend remains bullish, I'm watching for a potential pullback and then looking for renewed strength (bullish BoS) before considering new long positions. Patience and confirmation are key in these conditions! 👀✨

BTCUSDT – Uptrend Intact, Resistance Still in PlayBitcoin is currently moving within a healthy uptrend, showing a strong rebound from the 101,332 USDT support zone—aligned with the EMA 89 on the daily chart. Following an impressive recovery, the price is now approaching the 111,892 resistance area, which previously halted the bullish momentum and triggered a deep correction.
However, recent price action shows signs of stalling, suggesting a possible consolidation phase. If BTC fails to break above 111,892, a mild pullback toward the 104,000–101,000 zone may occur to build fresh momentum for the next bullish leg.
From a news perspective, the crypto market is buoyed by improving sentiment after weak U.S. job data, increasing the odds of an earlier-than-expected Fed rate cut. Additionally, continued capital inflows into Bitcoin ETFs are supporting medium-term upside potential for BTC.

Bitcoin’s Final Wave & Time Reversal Zone _ New ATH Loading?Today, I want to analyze Bitcoin ( BINANCE:BTCUSDT ) on the weekly time frame and answer these questions :
Can Bitcoin create a new All-time High(ATH) or not!?
At what price range can Bitcoin's uptrend end!?
When can we expect the uptrend to end!?
Please stay with me.
Bitcoin appears to have managed to break the Resistance lines , although we saw a fake break a few months ago , and it also appears to have a Hammer Candlestick Pattern in the previous weekly candle , which could signal the completion of Bitcoin's pullback to the Resistance lines(broken).
In terms of time , if we want to analyze the Bitcoin chart and look at Bitcoin's past, in general, the months of June(Average=-0.13%/Median=+2.20%) and especially July(Average=+7.56%/Median=+8.90%) have been among the most productive months for Bitcoin , and the months of August(Average=+1.75%/Median=-8.04%) and September(Average=-3.77%/Median=-4.35%) were the months when Bitcoin had a correction . Technical analysis tools show the end of the upward trend and the beginning of Bitcoin's correction at the Time Reversal Zone(TRZ=June 23 to August 4) .
In terms of Elliott Wave theory , Bitcoin appears to be completing the main wave 5 , as the main wave 3 was extended .
I expect Bitcoin to trend higher(+10%) in the coming weeks and create a new ATH . New ATH could be created in the Potential Reversal Zone(PRZ) and TRZ , and then we can wait for the start of the main correction .
What do you think about Bitcoin’s future movement? Can Bitcoin create a new ATH? When and at what price?
Note: If Bitcoin falls below $100,000, we should expect further declines.
Please respect each other's ideas and express them politely if you agree or disagree.
Bitcoin Analyze (BTCUSDT), weekly time frame.
Be sure to follow the updated ideas.
Do not forget to put a Stop loss for your positions (For every position you want to open).
Please follow your strategy and updates; this is just my Idea, and I will gladly see your ideas in this post.
Please do not forget the ✅' like '✅ button 🙏😊 & Share it with your friends; thanks, and Trade safe.

BTC/USDT Long PositionAfter a strong bullish impulse, price pulled back and formed a clear demand zone (OB) near the origin of the move.
The market is now retesting this zone after breaking short-term structure to the upside.
Entry:
Long from demand zone (OB) at the base of the bullish impulse.
Confluences:
✔️ Clean bullish BOS (Break of Structure)
✔️ Strong rejection wick from demand
✔️ Lower time frame liquidity grab
✔️ Favorable R:R setup
SL: Below the OB
TP: Targeting previous supply zone above
Bias: Bullish until structure shifts again
FOLLOW ME FOR MORE SIGNAL

BTC/USDT Analysis (15m) – Short Position Setup📌 BTC/USDT Analysis (15m) – Short Position Setup
🔍 After a sharp rally, the market started a corrective phase and formed a bearish structure with lower highs.
A sell limit order is placed at the 110063 supply zone, targeting potential continuation to the downside.
🎯 Target: 108578
⛔️ Stop Loss: 110557
⚠️ Risk/Reward: Favorable and aligned with current market structure.

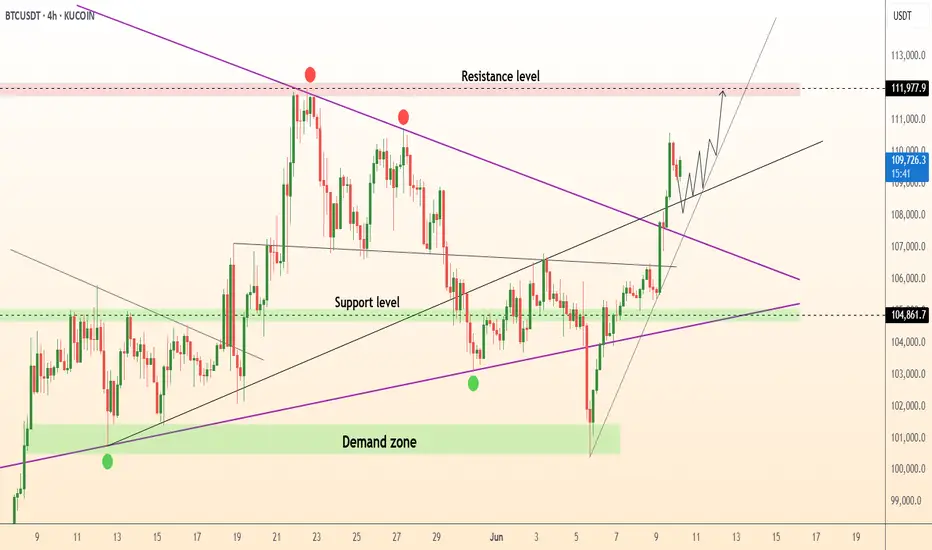
Bitcoin (BTC) Technical Analysis and Trading Strategy
Daily Level
Price Structure: Last week, it fell to 100,000 points and did not break the support. Then it returned to the horizontal adjustment range, but it was still suppressed by the downward trend line above, and the overall high-level decline structure was maintained.
K-line pattern: The two consecutive days of closing cross stars showed that the long-short game intensified, but there was no clear direction.
Momentum indicator: RSI continued to shrink, indicating that short-term momentum weakened, and attention should be paid to breakthrough signals.
4-hour level
Key resistance: 106,700 (horizontal channel top + downward trend line bonding pressure), breaking through is expected to test the 110,000 mark.
Key support: 103,500 (range bottom), 101,000 (strong support), if it falls below, it may form a head and shoulders top structure, and further look down to 97,600 (previous step support).
Short-term trading strategy
Short order opportunity
Entry area: 106,000-106,700
Stop loss: 108,000 (short order invalidated after trend line breakthrough)
Target: 103,500 → 101,000
Long order observation point
If the price stabilizes above 106,700, you can wait for confirmation of the retracement before arranging long orders, with a target of 110,000.
If it stabilizes at 101,000-103,500, you can consider short-term rebound trading.
Key trend judgment
Break above 106,700 → Continue to adjust upward and test 110,000.
Break below 103,500 → Confirm the head and shoulders top, target 97,600.
Range oscillation (103,500-106,700) → Wait for a breakthrough signal.
(Risk warning: Pay attention to changes in market liquidity and the impact of macro data, and strictly stop loss.)

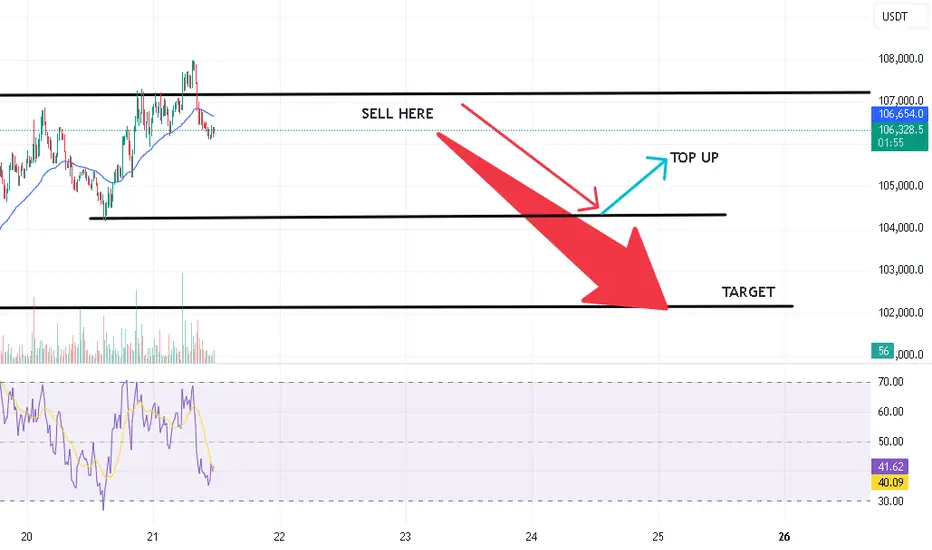
BTC's trading strategy for todayBTC has continued its upward trend as analyzed. It tested the resistance area above 110,000 today and began to decline. A small - scale decline is expected within the day, and short - term trading can try shorting.
BTC's trading strategy for today:
BTCUSDT sell@110000-111000
tp:108000-107000

Bitcoin Pre-CPI PlanJust like in trading it’s all about structure, levels and reaction.
We’ve seen BTC bounce cleanly from the psychological level of $100,299 and rally all the way to $110,667.
Based on that impulse move, I’m watching the 0.618 Fibonacci retracement at $106,586 as a potential dip-buy zone. That level aligns perfectly with:
✅ 4H Fair Value Gap
✅ Previous Week High
If we get a healthy CPI print today, I expect BTC to continue the bullish move and go for a new ATH.
🎯 First target: $112,345 (slightly above Previous Month High)
📉 Then, a potential pullback to $110,667 (support retest)
🚀 Followed by a breakout move to $117,604 the 1.618 Fib extension
All eyes on today’s CPI. If the data is good, the sky’s the limit.
Let’s see if bulls have the strength to push it all the way. 💪📈

Bitcoin Breaks Out: Bullish Momentum Builds Above Key LevelsHello guys!
The chart of Bitcoin reveals a significant bullish breakout, characterized by two key technical developments:
Broken Ascending Channel:
Bitcoin was trading within an ascending parallel channel, gradually making higher highs and higher lows. This channel was recently breached to the downside, suggesting a temporary weakening in momentum.
False Breakdown and Strong Reversal:
Despite the initial breakdown from the channel, Bitcoin swiftly reversed and surged upwards, reclaiming previous support levels with strong bullish candles. This “fake-out” move often traps bears and reinforces bullish sentiment.
Trendline Breakout:
More notably, BTC has broken above a descending trendline, which had acted as a resistance zone. This breakout, backed by strong volume and momentum, indicates a shift in market structure from consolidation to potential expansion.
Projected Upside Target:
Based on the breakout projection drawn on the chart, the next major resistance appears near the $109,600 level. This aligns with the upper purple dashed line, which may represent a historical resistance zone or a Fibonacci extension.

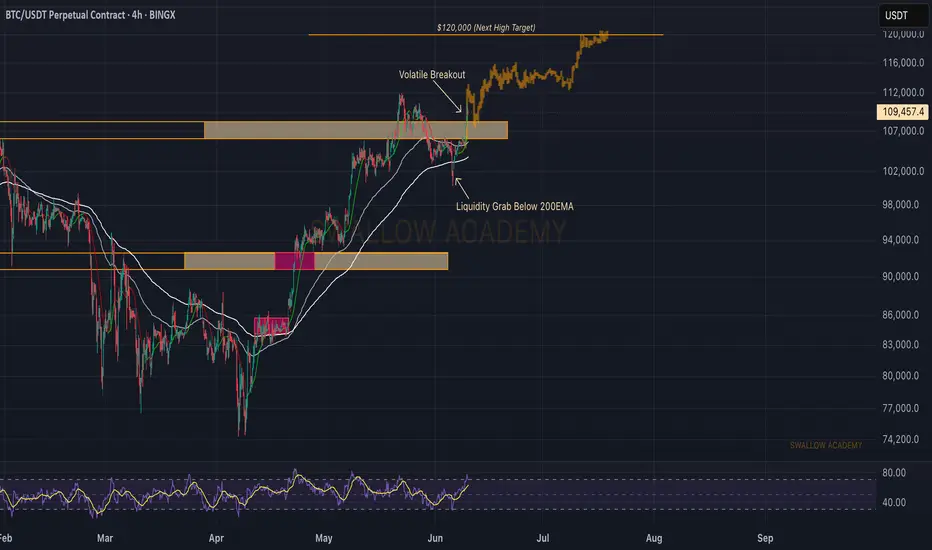
Bitcoin (BTC): Heading Towards The All Time Hight Bitcoin is still pushing into the second day of the week, where the price is heading towards the ATH area for a retest and potential breakout (which we have been looking for). Now if we keep that same momentum, we are guaranteed to retest the ATH area, where high volatility can be expected!
Swallow Academy