Next Volatility Period: Around July 2nd
Hello, traders.
If you "Follow", you can always get the latest information quickly.
Have a nice day today.
-------------------------------------
(BTCUSDT 1D chart)
The key is whether it can rise above 108316.90 and find support.
When OBV rises above the High Line, we need to check if the PVT-MACD oscillator switches to above the 0 point.
However, since the StochRSI indicator is currently showing signs of entering the overbought zone, I think there is a high possibility of resistance.
We need to check for support in the 108316.90-111696.21 zone, which is the high point boundary zone.
- If OBV fails to rise above the High Line,
- If the PVT-MACD oscillator fails to remain above the 0 point,
- If the StochRSI indicator falls from the overbought zone and switches to a state where K<D,
It is highly likely that it will eventually encounter resistance in the high point boundary zone and fall.
Therefore, what we need to do is to check for support near 108361.90-108353.0.
If it rises after that, we need to check for support near 111696.21.
Entering a new purchase in the high point boundary section is a very risky transaction.
Therefore, a short and quick response is required when making a purchase.
The basic trading strategy is to buy near the HA-Low indicator and sell near the HA-High indicator.
Do not forget this.
However, since the HA-Low or HA-High indicators are intermediate values, they may move in the opposite direction.
In other words, there is a possibility that the HA-Low indicator will receive resistance and fall, showing a stepwise downtrend, and the HA-High indicator will receive support and rise, showing a stepwise uptrend.
Therefore, you must check whether there is support in the low point boundary section of the DOM(-60) ~ HA-Low section or the high point boundary section of the HA-High ~ DOM(60) section.
To do this, you must trade in a split transaction method.
-
The next volatility period is expected to start around July 2 (July 1-3).
The reason why we calculate the volatility period is because it can be a turning point of the trend.
Therefore, making a new trade during the volatility period means that there is a high possibility of being caught in a fake.
-
Thank you for reading to the end.
I hope you have a successful trade.
--------------------------------------------------
- Here is an explanation of the big picture.
(3-year bull market, 1-year bear market pattern)
I will explain the details again when the bear market starts.
------------------------------------------------------
BTCUSDT.3L trade ideas

StochRSI indicator and support and resistance levels
Hello, traders.
If you "follow" me, you can always get the latest information quickly.
Have a nice day today.
-------------------------------------
The StochRSI indicator on the left chart is slightly different from the StochRSI indicator on the right.
The StochRSI indicator on the left chart is the StochRSI indicator provided by default in TradingView, and the StochRSI indicator on the right chart is an indicator with a modified formula.
The StochRSI indicator is a leading indicator that is reflected almost in real time.
Therefore, it reacts sensitively to price changes.
Although it is advantageous because it reacts sensitively, it also increases the possibility of being caught in a fake, so I thought that a slight delay(?) was necessary, and so I created the StochRSI indicator on the left chart.
If you look at the relationship between the K and D of the StochRSI indicators on the two charts, you can see that there is a big difference.
In the end, you can predict the movement by checking whether the movement of the K line has escaped the overbought or oversold section.
However, I think that you will receive information that can determine the sustainability of the trend depending on the positional relationship between K and D.
Therefore, it is important to distinguish the inflection points that occur in the StochRSI indicator.
This is because these inflection points provide important information for drawing trend lines.
Therefore, the StochRSI indicator on the left chart, which better expresses the inflection point, is being used to draw the trend line.
(Unfortunately, this indicator was not registered on TradingView because I did not explain it well.)
-
As a new candle was created, the StochRSI indicator on the left chart is showing an inflection point on the K line.
The StochRSI indicator on the right chart is showing a transition to a state where K < D.
We will have to check whether the inflection point was created only when today's candle closes, but I think that the fact that it is showing this pattern means that there is a high possibility of a change in the future trend.
Since the next volatility period is expected to start around July 2nd (July 1st-3rd), I think it has started to show meaningful movements.
-
It is true that you want to buy at the lowest price possible and sell at the highest price.
However, because of this greed, one mistake can lead to a loss that can overturn nine victories, so you should always be careful.
Therefore, if possible, it is better to check for support and respond.
In that sense, I think it is worth referring to the relationship between K and D of the StochRSI indicator on the left chart.
This is because the actual downtrend is likely to start when K < D.
-
In order to check for support, you definitely need support and resistance points drawn on the 1M, 1W, and 1D charts.
Ignoring this and checking for support at the drawn support and resistance points can result in not being able to apply the chart you drew to actual trading.
Therefore, you should draw support and resistance points first before starting a trade.
Otherwise, if you draw support and resistance points after starting a trade, you are more likely to set support and resistance points that reflect your subjective thoughts, so as I mentioned earlier, you are more likely to lose faith in the chart you drew.
If this phenomenon continues, it will eventually lead to leaving the investment market.
-
It is important to determine whether there is support by checking the correlation between the StochRSI indicator and other indicators at the support and resistance points drawn on the 1M, 1W, and 1D charts.
Even if the inflection point of the StochRSI indicator or other indicators occurs at a point other than the support and resistance points you drew, you should consider it as something that occurred beyond your ability to handle.
In other words, you should observe the price movement but not actually trade.
As I mentioned earlier, if you start to violate this, you will become less and less able to trust the chart you drew.
-
Accordingly, the basic trading strategy I suggest is to buy near the HA-Low indicator and sell near the HA-High indicator.
However, since the HA-Low and HA-High indicators are expressed as average values, they may move in the opposite direction to the basic trading strategy.
In other words, if the HA-Low indicator is resisted and falls, there is a possibility of a stepwise downward trend, and if the HA-High indicator is supported and rises, there is a possibility of a stepwise upward trend.
Therefore, the basic trading strategy mentioned above can be considered a trading strategy in the box section.
In the case of deviating from this box section, it is highly likely to occur before and after the volatility period indicated by the relationship between the trend line using the StochRSI indicator mentioned above and the support and resistance points drawn on the 1M, 1W, and 1D charts.
Therefore, special care is required when conducting new transactions during the volatility period.
This is because there is a high possibility of being caught in a fake when trading during the volatility period.
-
The DOM(60) and DOM(-60) indicators are good indicators to look at together with the HA-Low and HA-High indicators.
The DOM indicator is an indicator that comprehensively evaluates the DMI, OBV, and MOMENTUM indicators.
Therefore, the DOM(60) indicator is likely to be at the end of the high point range, and the DOM(060) indicator is likely to be at the end of the low point range.
In the explanation of the HA-Low and HA-High indicators,
- I said that if the HA-Low indicator receives resistance and falls, there is a possibility that a stepwise downtrend will begin,
- and if the HA-High indicator receives support and rises, there is a possibility that a stepwise uptrend will begin.
In order for an actual stepwise downtrend to begin, the price must fall below DOM(-60), and in order for a stepwise uptrend to begin, it must rise above DOM(60).
In other words, the DOM(-60) ~ HA-Low section and the HA-High ~ DOM(60) section can be seen as support and resistance sections.
-
If these correlations start to appear, I think you will be able to create a trading strategy that fits your investment style without being swayed by price volatility and proceed with trading.
The reason for analyzing charts is to trade.
Therefore, the shorter the time for chart analysis, the better, and you should increase the start of creating a trading strategy.
-
Thank you for reading to the end.
I hope you have a successful trade.
--------------------------------------------------

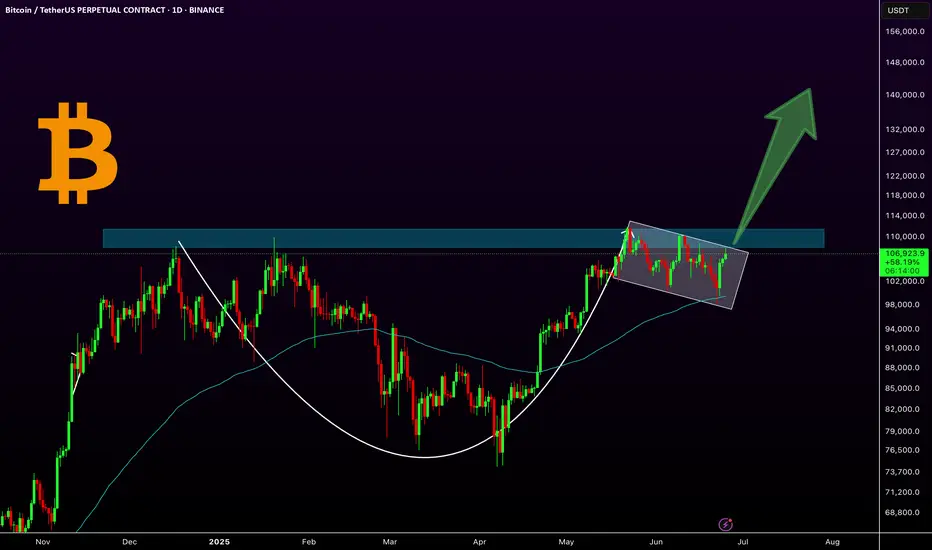
$BTC Consolidating Before the Next Big Move?CRYPTOCAP:BTC consolidating after a strong bounce!
Bitcoin is holding well above the 106K support zone and forming a tight range just below resistance.
After a false breakout above 100K, the price is compressing just below key resistance at 108100.
This consolidation between 106500 and 108100 looks like a pause, not a top.
If BTC breaks 108100, the next targets are 110500 and ATH.
Market structure is still bullish.
A retest of 106500–105650 is possible before liftoff.
Are you positioned for the breakout?
If you find my updates helpful, don’t forget to like and follow for more!
DYOR, NFA
#BitcoinRecovery

Bitcoin Bullish But... Support Zones (Incl. Altcoins)Bitcoin is bullish right now but we know things can change. As long as the action is happening within the blue and gray space, all is good, the bullish bias remains intact. If the action moves below the gray zone and enters the orange zone, this is the danger zone. This danger zone can turn into a buy opportunity or a wait and see approach.
On the other hand, if Bitcoin remains above the blue zone this is ultra-bullish short-term. This is specially bullish for the altcoins but it is bullish for Bitcoin as it reveals consolidation at high prices, but right now we have a lower high so anything goes.
The chart is mixed when looked at up-close. Bullish long-term and on all bigger timeframes. Corrections tend to develop from high prices.
One more thing to consider
When we look at the action short-term we can miss the bigger picture, we can become clouded with noise. The bigger range is $100,000 - $110,000, this is the new long-term support zone that is being established and created before additional growth. Bitcoin can remain here for weeks or even months, if this happens, the altcoins will continue to grow.
We are in a bull market. Bitcoin is obviously in a bull market as it is trading near its all-time high after years of growth. The altcoins are just getting started after years of sideways action... Some altcoins hit new all-time lows but still part of a broad, long-term consolidation phase. Many produced higher lows, some produced lower lows, it makes no difference.
The bear market ended in mid/late 2022 and the ensuing two years we had mix growth. Bullish waves and bearish waves, with the usual variations of course.
The year is now 2025 and Bitcoin is up, most of the big projects have been growing for years now and we are getting close to the final advance, the major fifth wave and the bull market bull run. When this happens, close to its end, all the smaller projects will produce the biggest growth in their history and this will be the boom that will catapult Crypto to take over the financial world.
It won't be the first time this event happens nor the last, the market will continue to fluctuate.
I know there is a lot of information out there and we can become uncertain with every drop, but look at the price; what do you see? Bitcoin is going up.
The altcoins are set to follow, the altcoins do what Bitcoin does.
Namaste.

Analyzing the new month, new week, new day
Hello, traders.
If you "follow", you can always get the latest information quickly.
Have a nice day today.
-------------------------------------
(BTCUSDT 1M chart)
A new month begins in one day.
The key is whether it can hold the price by rising above 109588.0.
If not, there is a possibility that it will fall below the 94172.00 StochRSI 50 indicator point that the arrow is pointing to.
We need to see if it can rise with support near the Fibonacci ratio of 1.618 (89050.0).
Since the current low-point trend line is not complete, it is not surprising that it can show a downward trend at any time.
However, if it rises above 109588.0 and maintains the price, it is expected that there will be an attempt to rise near the Fibonacci ratio of 2.618 (133889.92).
I think it is likely to be the last target of the target bull market in 2025.
-
(1W chart)
It is a period of volatility around the week including June 23.
That is, from June 16 to July 6 is the volatility period.
The key is whether it can rise to the right Fibonacci ratio 2.24 (116940.43) during this volatility period.
Even if it fails to rise, if the price maintains above 104463.99, it is expected to show an upward trend around the next volatility period.
The next volatility period on the 1W chart is expected to be around the week of August 18.
-
When it falls below 104463.99, we need to check whether the HA-High indicator is newly generated.
If not, it is important to check whether there is support around the current HA-High indicator point of 99705.62.
Since the M-Signal indicator on the 1W chart is passing around 99705.62, its importance can be said to be high.
If it falls below the M-Signal indicator of the 1W chart, it is expected to determine the trend again when it meets the M-Signal indicator of the 1M chart.
-
(1D chart)
The key is whether it can maintain the price by rising above the HA-High indicator point of 108316.90 on the 1D chart.
If it fails to rise,
1st: 104463.99
2nd: 99705.62
You should check for support near the 1st and 2nd above.
If it falls below the M-Signal indicator of the 1W chart,
1st: 89294.25
2nd: M-Signal of the 1M chart
There is a possibility that it will fall near the 1st and 2nd above.
-----------------------------------------
(1W chart)
The chart above is a trend line chart drawn on the 1W chart.
It looks complicated, but what's important to look at is the correlation between the high-point trend line and the low-point trend line.
That is, even if the price rises above 109.588.0, if it doesn't rise above the high-point trend line, it is likely to fall near the low-point trend line.
Fortunately, since it is forming an upward channel, it is expected that the price will eventually rise even if it falls.
-
(1D chart)
Unlike the trend line on the 1W chart, the high-point trend line on the 1D chart forms a downward trend line.
Accordingly, the period around July 7, when the low-point trend line and the high-point trend line intersect, can be considered an important period of volatility.
However, the volatility period starts around July 2nd and is expected to end around July 10th.
----------------------------------------------
As shown above, many lines were drawn to analyze the chart.
I have roughly explained which of the lines drawn in this way should be prioritized.
Since chart analysis is for creating a trading strategy, the support and resistance points drawn on the 1M, 1W, and 1D charts are ultimately the most important.
Therefore, it is most important to check how the support and resistance points were created and find the reason for them.
Other analyses are only additional elements.
As I always say, chart analysis that does not show support and resistance points is only an analysis chart that can be used for trading.
You cannot trade with such analysis charts.
Also, if support and resistance points are shown, you should check the basis for setting the support and resistance points.
In order to serve as a support and resistance point, there must be a basis.
When you cannot confirm the basis for the support and resistance point, it is important to ask questions and find out the basis.
Fibonacci ratios are not suitable for actual trading.
However, when the ATH or ATL is updated, it is valuable enough for analysis.
Other than that, there must be support and resistance points drawn on the 1M, 1W, and 1D charts.
-
Thank you for reading to the end.
I hope you have a successful trade.
--------------------------------------------------
- This is an explanation of the big picture.
(3-year bull market, 1-year bear market pattern)
I will explain more details when the bear market starts.
------------------------------------------------------

BITCOIN PRICEACTION TRADING STRATEGIESBitcoin’s price is influenced by macroeconomic factors, including U.S. inflation trends and institutional adoption (e.g., Bitcoin ETFs with $138B in assets). Its volatility remains high, with 10% daily moves possible, driven by 24/7 trading and sentiment shifts. Recent recovery from a dip below $102,000 was tied to geopolitical tensions, but macro signals suggest a risk-on environment supporting further gains.
Outlook: Bitcoin is at a critical juncture, with technical indicators leaning bullish but resistance at $108,000 posing a challenge. A decisive breakout above $108,950 could signal a move toward $111,000-$115,000, failure to hold this level will retest 100k$ level or below.and below 100k could turn bearish .

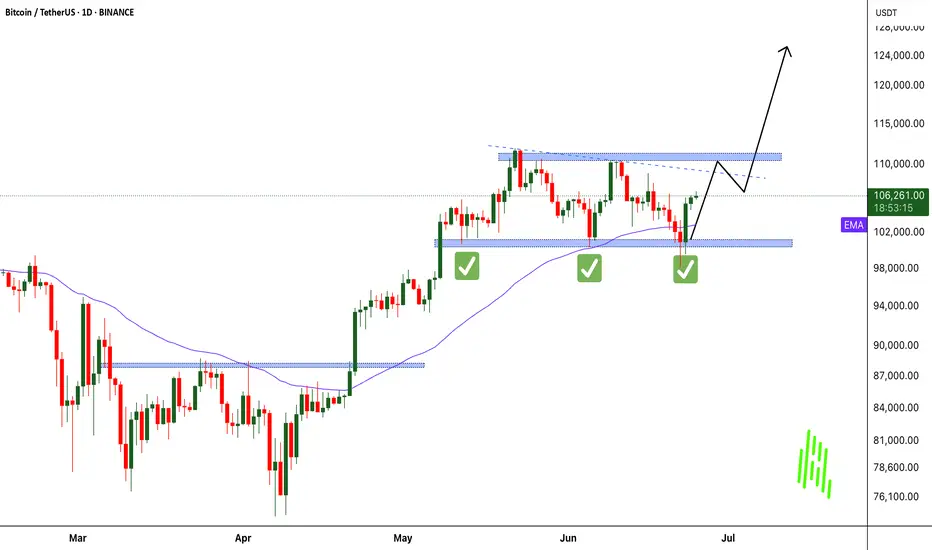
BTCUSDT Analysis – Bullish Focus Amid ConsolidationBTCUSDT Analysis – Bullish Focus Amid Consolidation
Bitcoin is currently mirroring the broader market sentiment, particularly tracking the S&P 500. After a false breakout above the psychological 100K level, BTC entered a distribution phase, followed by a consolidation range. This indicates a potential accumulation before a bullish continuation, although resistance levels remain key hurdles.
False Breakout at 100K: A failed breakout attempt triggered a sharp reversal, signalling short-term weakness. Price rolled back and found temporary support around 106,200, pausing further downside The pair is consolidating within a tight range, indicating a possible setup for a renewed bullish push.
Outlook: Despite the resistance cascade, BTC remains in a bullish structural zone as long as it holds above 106,000. A clean breakout above 108,500–110,000 could open the path back toward 114,000–117,000. However, failure to break may result in a deeper pullback towards 104,000–102,500.
Ps Support with like and comments for more analysis Thanks for supporting.

Skeptic | RSI Masterclass: Unlock Pro-Level Trading Secrets!Hey traders, it’s Skeptic ! 😎 Ready to transform your trading? 95% of you are using the Relative Strength Index wrong , and I’m here to fix that with a game-changing strategy I’ve backtested across 200+ trades. This isn’t a generic RSI tutorial—it’s packed with real-world setups, myth-busting insights, and precise rules to trade with confidence. Join me to master the art of RSI and trade with clarity, discipline, and reason. Big shoutout to TradingView for this epic free tool! 🙌 Let’s dive in! 🚖
What Is RSI? The Core Breakdown
The Relative Strength Index (RSI) , crafted by Welles Wilder, is a momentum oscillator that measures a market’s strength by comparing average gains to average losses over a set period. Here’s the formula:
G = average gains over n periods, L = average losses.
Relative Strength (RS) = | G / L |.
RSI = 100 - (100 / (1 + RS)).
Wilder used a 14-period lookback , and I stick with it—it’s smooth, filters noise, and gives a crystal-clear read on buyer or seller momentum. Let’s get to the good stuff—how I use RSI to stack profits! 📊
My RSI Strategy: Flipping the Script
Forget what you’ve read in books like The Handbook of Technical Analysis by Mark Andrew Lim— overbought (70) and oversold (30) aren’t just for shorting or buying. I go long when RSI hits overbought, and it’s been a goldmine. I’ve backtested over 200 trades with this approach, and it’s my go-to confirmation for daily setups. Why does it work? When RSI hits overbought on my 15-minute entry chart, it signals explosive buyer momentum. Here’s what you get:
Lightning-Fast R/R: I hit risk/reward targets in 30 minutes to 2 hours on 15-minute entries (longer for 1-hour entries, depending on your timeframe).
Massive R/R Potential: An overbought RSI on 15-minute can push 1-hour and 4-hour RSI into overbought, driving bigger moves. I hold for R/Rs of 5 or even 10, not bailing early. 🚀
Rock-Solid Confirmation: RSI confirms my entry trigger. Take BTC/USD:
BTC bounces off a key support at 76,000, sparking an uptrend.
It forms a 4-hour box range, but price tests the ceiling more than the floor, hinting at a breakout.
Trigger: Break above the box ceiling at 85,853.57.
On 15-minute, a powerful candle breaks the ceiling, and RSI hits overbought—that’s my green light. I open a long.
Soon, 1-hour and 4-hour RSI go overbought, signaling stronger momentum. I hold, and BTC pumps hard, hitting high R/R in a short window.
This keeps trades fast and efficient—quick wins or quick stops mean better capital management and less stress. Slow trades? They’re a mental grind, pushing you to close early for tiny R/Rs. 😴
Pro Rules for RSI Success
Here’s how to wield RSI like a trading weapon:
Stick to the Trend : Use RSI in the direction of the main trend (e.g., uptrend = focus on longs).
Confirmation Only: Never use RSI solo for buy/sell signals. Pair it with breakouts or support/resistance triggers.
Fresh Momentum: RSI is strongest when it just hits overbought/oversold. If the move’s already rolling, skip it—no FOMO, walk away!
Customize Zones: Overbought (70) and oversold (30) can shift—it might show reactions at 65 or 75. Adjust to your market’s behavior.
Backtesting RSI: Your Path to Mastery
To make RSI yours, backtest it across at least 30 trades in every market cycle— uptrend, downtrend, and range. Test in volatile markets for extra edge. 😏 Key takeaways:
Range Markets Kill RSI: Momentum oscillators like RSI (or SMA) are useless in ranges—no momentum, no signal. Switch to ROC (Rate of Change) for ranges—I use it, and it’s a beast. Want an ROC guide? Hit the comments!
Overextended RSI Zones: On your entry timeframe (e.g., 15-minute), check higher timeframes (e.g., 4-hour) for past RSI highs/lows. These are overextended zones—price often rejects or triggers a range. Use them to take profits.
Final Vibe Check
This RSI masterclass is your key to trading like a pro—fast R/Rs, big wins, and unshakable confidence . At Skeptic Lab, we live by No FOMO, no hype, just reason. Guard your capital— max 1% risk per trade, no excuses. Want an ROC masterclass or more tools? Drop a comment! If this fired you up, smash that boost—it means everything! 😊 Got a setup or question? Hit me in the comments. Stay sharp, fam! ✌️

BTC/USDT Trade Setup – Lord MEDZStrategy: Goldbach Fair Value Gap + Smart Money Concepts (SMC)
Timeframe: 6H
Bias: Long
Trade Parameters
Entry: 102,577
Stop Loss: 99,527
Take Profit: 118,153
Risk to Reward: Approximately 5:1
Confluences and Justification
Price is expected to retrace into a clear Fair Value Gap (FVG) formed after displacement, aligning with the Goldbach model.
The structure confirms a completed reaccumulation phase, presenting a high-probability long setup.
This would complete the right shoulder of the classic inverse head and shoulders pattern, with the shoulder projected to dip into the POI. Head and shoulders patterns are often manifestations of Wyckoff accumulation or distribution phases, for those who may not be aware.
Liquidity left inside the gap provides inducement, increasing the likelihood of a sweep into the 102.5K zone.
The take-profit target at 118,153 aligns with the high of the Goldbach Fibonacci extension level.
Execution Plan
Wait for price to return to the FVG zone around 102,577. Look for confirmation such as a bullish displacement candle, a lower time frame BOS (break of structure), or mitigation of a lower time frame order block. Upon confirmation, execute long with a stop below 99,527. Take profit is set at 118,153.
Final Note from Lord MEDZ
"I await the return of price to imbalance. The reaccumulation is complete, and the alignment is clear. Entry shall be taken where inefficiency remains, and profit shall be claimed where liquidity awaits."

Good moment for try to Buy BTCGood moment for try to Buy BTC. Very good down movement and now we make small step of the up. This point can be point for start to move new up trend with update local highest high. Stop to previous local low bar. Will see...

#BTC enters resistance zone, beware of pullback📊#BTC enters resistance zone, beware of pullback⚠️
🧠From a structural perspective, the target of this rise has been achieved, so we need to be wary of a mid-term correction.
➡️From a graphic perspective, the daily level seems to be forming a bull flag. This is the third time we are close to the upper edge of the flag. I think the probability of encountering resistance and falling back is higher than the probability of continuing to break through.
Let's see👀
🤜If you like my analysis, please like💖 and share💬
BITGET:BTCUSDT.P

Example of how to draw a trend line using the StochRSI indicator
Hello, traders.
If you "Follow", you can always get new information quickly.
Have a nice day today.
-------------------------------------
We use the StochRSI indicator to draw a trend line.
We draw a trend line by connecting the peaks of the StochRSI indicator, i.e. the K line, when they are created in the overbought area or when they are created in the overbought area.
That is, when the K line of the StochRSI indicator forms a peak in the overbought area, the trend line is drawn by connecting the Open values of the falling candles.
If the candle corresponding to the peak of the StochRSI indicator is a rising candle, move to the right and use the Open value of the first falling candle.
When drawing the first trend line, draw it from the latest candle.
Since the third trend line indicates a new trend, do not draw anything after the third trend line.
The currently drawn trend line corresponds to the high-point trend line.
-
Therefore, you should also draw the low-point trend line.
The low-point trend line is drawn by connecting the K line of the StochRSI indicator when the top is formed in the oversold zone.
The low-point trend line uses the low value of the candle when the K line of the StochRSI indicator forms the top in the oversold zone.
That is, it doesn't matter whether the candle is a bearish candle or a bullish candle.
The drawing method is the same as when drawing the high-point trend line, drawing from the latest candle.
The top of the best K line of the StochRSI indicator was not formed within the oversold zone.
(The top is indicated by the section marked with a circle.)
Since the trend line was not formed, the principle is not to draw it.
If you want to draw it and see it, it is better to display it differently from the existing trend line so that it is intuitively different from the existing trend line.
-
The chart below is a chart that displays the trend line drawn separately above as a whole.
It is also good to distinguish which trend line it is by changing the color of the high-point trend line and the low-point trend line.
The chart below is a chart that distinguishes the high-point trend line in blue (#5b9cf6) and the low-point trend line in light green (#00ff00).
The low-point trend line is a line drawn when the trend has changed, so it does not have much meaning, but it still provides good information for calculating the volatility period.
-
To calculate the volatility period, support and resistance points drawn on the 1M, 1W, and 1D charts are required.
However, since I am currently explaining how to draw a trend line, it is only drawn on the 1M chart.
-
I use the indicators used in my chart to indicate support and resistance points.
That is, I use the DOM(60), DOM(-60), HA-Low, HA-High, and OBV indicators to indicate support and resistance points.
Since the DOM(-60) and HA-Low indicators are not displayed on the 1M chart, I have shown the 1W chart as an example.
The indicators displayed up to the current candle correspond to the main support and resistance points.
Although it is not displayed up to the current candle, the point where the horizontal line is long is drawn as the sub-support and resistance point.
It is recommended to mark them separately to distinguish the main support and resistance point and the sub-support and resistance point.
The trend line drawn in this way and the support and resistance points are correlated on the 1D chart and the volatility period is calculated.
(For example, it was drawn on the 1M chart.)
The sections marked as circles are the points that serve as the basis for calculating the volatility period.
That is,
- The point where multiple trend lines intersect
- The point where the trend line and the support and resistance points intersect
Select the point that satisfies the above cases at the same time to display the volatility period.
When the point of calculating the volatility period is ambiguous, move to the left and select the first candle.
This is because it is meaningless to display it after the volatility period has passed.
If possible, the more points that are satisfied at the same time, the stronger the volatility period.
If the K-line peak of the StochRSI indicator is formed outside the overbought or oversold zone, it is better to exclude it when calculating the volatility period.
-
The chart below is a chart drawn on a 1D chart by summarizing the above contents.
The reason why there are so many lines is because of this reason.
For those who are not familiar with my charts, I have been simplifying the charts as much as possible these days.
However, when explaining, I have shown all the indicators to help you understand the explanation.
-
Thank you for reading to the end.
I hope you have a successful trade.
--------------------------------------------------

Timeframes in Trading: Which Chart Tells You WhatHello, traders! 👋🏻 Why can the same chart tell a different story on 1D, 4H, or 15M? You’ve probably been there. BTC looks bullish on the daily… bearish on the 4-hour… and totally sideways on the 15-minute. So, which one is right?
The truth is: none of them is wrong. They’re just telling different parts of the story. Understanding timeframes in trading isn’t just a technical skill. It’s how you decode what the market is actually doing.
Every Timeframe Has a Role
Think of timeframes like zooming in and out on a map: The 1W chart tells you where the mountain ranges are, the macro trend. The 1D chart shows the highways and the current direction within that macro. The 4H chart reveals city streets, the local trend swings. And the 15M chart? That’s the back alleys, where the noise and micro moves live. BTC, for example, doesn't behave the same way across these views, and it shouldn't.
What Happens If You Ignore Timeframes?
You try to short a "breakdown" on the 15M, only to realize you just sold into 4H support.
You enter a 1D bullish breakout, only to panic when price pulls back aggressively on the 4H… forgetting that the 4H was just doing a retest. Or worse, you start trading against the macro trend, thinking the 15M chart holds more weight than it actually does.
How Professionals Read Timeframes (BTC Example)
Example:
You can start high, work down: 1W → 1D → 4H → 1H/15M. Check the macro first. Is BTC bullish, bearish, or ranging on the 1D or 1W? Then, you can map key levels: Support/resistance from higher timeframes is 10x more meaningful on lower timeframes. For example, BTC’s $30K, a weekly level, creates reactions even down on 5-minute charts. And, align context: A bullish setup on 15M is excellent, but check if it aligns with the 4H trend direction. If the 4H is also bullish, your setup has context. If not, expect chop.
🔗 BTC Right Now: Timeframe Confusion in Action
Just look at the current BTC structure. On the 1W, BTC is still trending higher, higher highs and higher lows from the $15K bottom in 2023. On the 1D, BTC trades inside a broad consolidation range after a strong uptrend. The price has repeatedly tested the $107K–$112K zone, acting as a key resistance cluster, while forming a series of higher lows. It's not a breakdown but a correction inside a bullish structure, testing previous supply zones. The 4H? Chaos. The price bounces between $105K and $112K, which is pure range behavior. The 15M? Traders are getting whipped trying to catch fake breakouts that mean nothing in the daily or weekly context.
Which Chart Tells You What?
All of them. But differently.
THE 1W TELLS YOU THE NARRATIVE.
THE 1D SHOWS YOU THE CURRENT DIRECTION.
THE 4H REVEALS TRADEABLE SWINGS WITHIN THAT DIRECTION.
THE 15M CAPTURES THE NOISE, THE TRAPS, AND THE MICRO OPPORTUNITIES.
If you’re only looking at one timeframe, you’re only seeing part of the picture. So, timeframes aren’t about right or wrong. They’re about perspective. If you’re a day trader, you probably live on the 5-minute to 15-minute charts, while still peeking at the 1H or 4H for structure.
If you’re a swing trader, the 4H and 1D are your home base, with the weekly chart guiding the bigger story. And if you’re thinking in months or quarters, the 1W and 1M are what actually matter – everything else is just noise.
So next time BTC feels “confusing”… zoom out. Or zoom in. The answer is probably hiding in the chart, just not the one you were looking at. Which timeframe do you trust the most when trading crypto? Drop it in the comments!

BTC: A Classic Cup & Handle in Play!Bitcoin has formed a classic cup and handle pattern on the daily chart, with the 100 EMA providing solid support during the handle formation. Currently, the price is consolidating in what appears to be a bullish flag or extended handle, just below the key resistance zone around $109K. A breakout above this level could ignite a strong bullish rally toward higher targets like $144k.
Key Highlights:
-Cup & Handle pattern confirmed
-10 EMA acting as dynamic support
-Bullish flag/handle forming near resistance
- A breakout could lead to explosive upside
Regards
Hexa
CRYPTOCAP:BTC BITSTAMP:BTCUSD
Once again a perfect time to enter a short
As we are closing in to key resistance area we can see that we are getting a lot of smaller bodied 4H candlesticks. This is indicating a weak buy side and that we are looking to top out!
We also got overbought on the hourly RSI and the MACD has flipped bearish
Combining a crocodile tooth shaped formation taking form on the 15min, a rejection from the downward sloping trend line (third rejection indicates strong trend line) and that we are looking to reverse at key resistance. I entered a 100x short at 106375.
As I am writing we also got in another confirmation on the hourly timeframe. As we can see we got a nice bearish engulfing candlestick.
I think the chart speak for itself. We are about to go down big time!

BITCOINBITCOIN wait on the close of daily candle for clear directional bias ,break and close 108k will expose 111-115 and more higher zones .break below by rejection on daily candle will call for sell and target will be around 100-94k zone .
trading is 100% probability, some people are gifted while some are not.

BTC - Is it time to 105 - 102k?Just wait and watch, as said it went what i said, Will explain more, but it would take more longs with it and eventually bonk it down, wreckage intensity would be said soon

Bitcoin Reclaims Momentum: War Fears Fading, Bulls Eye $125K! MARKETSCOM:BITCOIN just delivered a powerful bounce right off the critical $100K level. A key psychological and technical support zone tested multiple times in recent sessions. This time, the bounce came with strong volume confirmation, signaling renewed buyer interest. As geopolitical tensions in the Middle East begin to ease, market confidence is returning, fueling bullish sentiment across the board.
CRYPTOCAP:BTC now looks poised to retest the $110K resistance zone, where some short-term rejection could occur. However, a decisive breakout above $110K opens the gates for a potential rally toward the next major target at $125K. Stay sharp, always manage your risk, and don’t forget to set a proper stop loss. The trend is strong, and momentum is building!
Follow Our Tradingview Account for More Technical Analysis Updates, | Like, Share and Comment Your thoughts
Bitcoin Recovers...What we've learned in the past few years is that Bitcoin's demand is just too strong. Retraces and corrections are no longer wild like before, these are limited and capped. Nobody wants to take the risk of selling too much and being left out or losing their Bitcoins for good, they are just too valuable. Many times more valuable than the USD Dollar or Gold. It is the most valuable asset in the whole digital world.
Other than food and toilet paper, nothing is more valuable than Bitcoin.
Technical analysis
Ok, let's focus on the chart.
The retrace has been ongoing for 31 days, since 22-May.
Total drop amounts to 12.33% (-12%).
The action moved below the 5-June low around $100,400. Bitcoin is now back above this level. Clearly showing that this is a stop-loss hunt event.
Stop-loss hunt and liquidity hunt because thousands, if not millions, of over-leveraged traders have been liquidated. They were betting on the wrong side short-term. Long-term yes, bullish is the trend, the direction and the win. Short-term, it was SHORT but not anymore.
Never trade with 20X that's crazy. Imagine going LONG 20X at the all-time high? Isn't that stupid?
I can bet you the same people didn't want to buy LONG when Bitcoin was trading at $75,000. In fact, I can bet that these people that just got liquidated were selling below $80,000 and buying LONG with 20X at $110,000. A recipe for disaster.
Anyway, I am calling it early. This is it, we are going up.
I got my signals, as you already know, from the altcoins.
If you agree boost and follow.
Thanks a lot for your continued support.
Namaste.

Check if price can hold above M-Signal indicator on 1D chart
Hello, traders.
If you "Follow", you can always get new information quickly.
Have a nice day today.
-------------------------------------
I failed to register a modified indicator of StochRSI indicator on TradingView alone, so I added it to the existing OBV by readCrypto indicator.
From the top of the indicator setting window to the bottom
1. OBV indicator of Low Line ~ High Line channel
2. PVT-MACD oscillator indicator
3. StochRSI indicator
They are registered in the order above.
Since the values used are all different, you should activate and use one indicator.
Please check the chart above.
------------------------------------------
(BTCUSDT 1D chart)
It is showing a downward trend as it failed to rise above the HA-High indicator (108316.90) on the 1D chart.
It is currently checking whether there is support near 107340.58, which is the StochRSI 50 indicator point.
If it fails to receive support and falls, it is expected to fall to around 104463.99.
The 104463.99 point is the DOM (60) indicator point of the 1W chart, which corresponds to the end of the high point on the 1W chart.
Since the StochRSI 20 indicator point is formed near the 104463.99 point, its importance can be considered high.
-
Since the M-Signal indicator of the 1D chart is passing near 106133.74, there is a possibility of volatility when touching this area.
Since the volatility period begins around July 2 (July 1-3), it is necessary to keep an eye on the current movement.
-
However, the key is to buy near the HA-Low indicator and sell near the HA-High indicator, so the current movement may be natural.
This volatility period is expected to last until around July 10 (July 9-11), so be careful when trading to avoid being fooled by fakes.
----------------------------------------
- The StochRSI indicator is showing signs of transitioning to a state where K < D.
- The PVT-MACD oscillator indicator is showing signs of decline.
- The OBV indicator of the Low Line ~ High Line channel is showing signs of decline in the High Line.
Therefore, if you look at the indicators, they are showing signs of decline overall.
However, if the OBV rises above the High Line, the price will show signs of rise.
Therefore, we need to observe the movements of the indicators while checking whether there is support at the StochRSI 50 indicator point.
Basically, the time to make a purchase is when it shows support near the DOM (-60) ~ HA-Low indicator.
If you want to make a purchase outside of that, you should not forget that a short and quick response is required.
The indicators that tell you the high point are HA-High, DOM(60) indicators.
In addition, there are StochRSI 80 and StochRSI 20 indicators that require quick response.
-
Thank you for reading to the end.
I wish you successful trading.
--------------------------------------------------
- Here is an explanation of the big picture.
(3-year bull market, 1-year bear market pattern)
I will explain the details again when the bear market starts.
------------------------------------------------------

BTC's Mid 2025 OutlookBitcoin is currently trading around $107,000 on the 4-hour 4H timeframe, navigating a consolidation phase following a sharp rally that culminated in a new all-time high of $111,900 in May 2025. Despite recent price corrections, BTC remains up 3% on the week, reflecting underlying bullish momentum. This sustained strength hints at continued confidence in the market, particularly among larger players.
A notable development supporting this view is the increase in the number of Bitcoin wallets holding at least 10 BTC, which has surged to a three-month high of 152,280. This metric is widely regarded as a proxy for whale activity and may indicate renewed institutional interest, especially amid accelerating inflows into spot Bitcoin ETFs.
On the 4H chart, Bitcoin appears to be consolidating within a tight range, hovering just beneath a key supply zone at $107,000, which could act as short-term resistance.
Several potential outcomes are currently in play:
Bullish scenario:
A breakout above the $107,000–$108,000 range could clear the path toward the critical resistance at $115,000. A successful move above this threshold would likely signal resumption of the broader uptrend, with some technical analysts eyeing a potential cup and handle formation that could project long-term targets up to \$180,000
Bearish scenario:
If BTC fails to hold above the current level, it may correct toward the first major support at $102,800, with further downside risk to $98,500. In a more pessimistic setup, price could extend losses toward $96,000, especially if macroeconomic or geopolitical pressures intensify
Key levels to watch:
Resistance: $107,000 - $115,000
Support: $102,800 - $98,500 - $96,000
Market Sentiment and External Drivers:
Bitcoin's price is being shaped not only by technical dynamics but also by powerful external forces
Spot Bitcoin ETFs:
The US regulatory greenlight for spot ETFs has dramatically altered market dynamics. With projections of $190 billion in assets under management AUM for these products by the end of 2025, institutional access to BTC has become more streamlined, providing strong tailwinds for long-term accumulation
Geopolitical risk and macro conditions:
Global uncertainty, particularly due to escalating tensions in the Middle East and potential US military involvement, has introduced volatility. At the same time, rising inflation and economic instability in developed markets is a double-edged sword, either undermining risk assets or conversely boosting Bitcoin’s narrative as digital gold and a hedge against fiat devaluation
Forward-Looking Outlook:
Bitcoin is at a critical juncture. The ability to sustain above $107,000 and reclaim the $115,000 resistance will be pivotal. A confirmed breakout could open the door to price discovery and possibly a surge toward $130,000 to $150,000, with $180,000 as an extended target in more bullish scenarios
However, a failure to hold key support levels could shift momentum toward the bears, prompting a deeper correction toward the $96,000 zone. Traders should monitor:
- Price reaction around $107,000 and $115,000
- ETF inflow data and AUM growth
- Macro news especially inflation reports and central bank commentary
- Developments in global conflict zones impacting risk appetite
Conclusion:
Bitcoin’s medium-term direction hinges on a delicate interplay of technical consolidation institutional flow and macro geopolitical signals. While the bullish structure remains intact for now a decisive move in either direction above $115,000 or below $98,000 could set the tone for the next major trend.

BTC - High Probability Trade Idea Here we have a major resistance at this upper level. And market seems to create a "Double Top Patter". So its indicating a possible bearish move.
Target and Sl on chart. Follow risk and money management.
BINANCE:BTCUSDT BITSTAMP:BTCUSD BINANCE:BTCUSDT.P INDEX:BTCUSD BYBIT:BTCUSDT.P BINANCE:BTCUSD

BTC Leg2 115KBINANCE:BTCUSDT major movement from base 98K S to 106K $.BTC want to next movement to 115K $ but in middle of way 110K $ level there are sellers.
Support: 106.000 - 102.000
Resistance: 110.400 - 115.000
⚠️Control Risk Management
