BTC buying power is gradually increasing💎 Update Plan BTC at the beginning of the week (June 30)
Notable news about BTC:
Anthony Pompliano has merged Procap BTC with Columbus Circle Capital I, established Procap Financial - a Bitcoin warehouse company up to $ 1 billion. The company will deploy lending activities, derivatives ... in order to create a collection line from BTC, according to the similar model
Bitcoin price is stable at about $ 107.4K on June 27, before the expiry date of options worth up to US $ 40 billion, capable of causing strong fluctuations. At the same time, on June 29, BTC exceeded $ 108k, up ~ 0.68% compared to the previous day
In the past 7 days, BTC maintained around $ 104–107K despite tensions in the Middle East and the US economic data is not heterogeneous. Reduce slightly but receive support from organized cash flow and global trade progress.
Technical analysis angle
Overview of trends - many signs of increasing
Looking at the candle is signaling "Strong Buy" on many time frames, especially healthy momentum, the ability to breakout $ 116k if surpassed the $ 110k resistance
ETF liquidity and organizational capital flows are supporting the trend of increasing, strengthening the possibility of breakthrough.
Moving Averages:
Frame 1H: 64% Bullish signal (MA20 reversed), but there is a neutral signal from short -term ghosts
Daily/Weekly: Golden Cross (Golden Cross) between 50‑ and 200‑ MA, is a long -term trend increase signal
Oscillators:
RSI frame Daily ~ 55, showing neutral momentum, not too much purchased but there is a rise. Double Rounded Top model on the chart Daily, the current trend is neutral - Bearish if the breakdown supports Neckline ~ $ 106k; In contrast, strong recovery above $ 114k will invalid this model
Long -term / Swing Trade: Keep the position if the price is maintained> $ 106k, use $ 103–104K as a spare hole stop.
Short -term / Scalp Trade: can be in order when the test price is $ 106k–107k, small latches around $ 110k.
==> Comments for trend reference. Wishing investors successfully trading
BTCUSDT.3L trade ideas

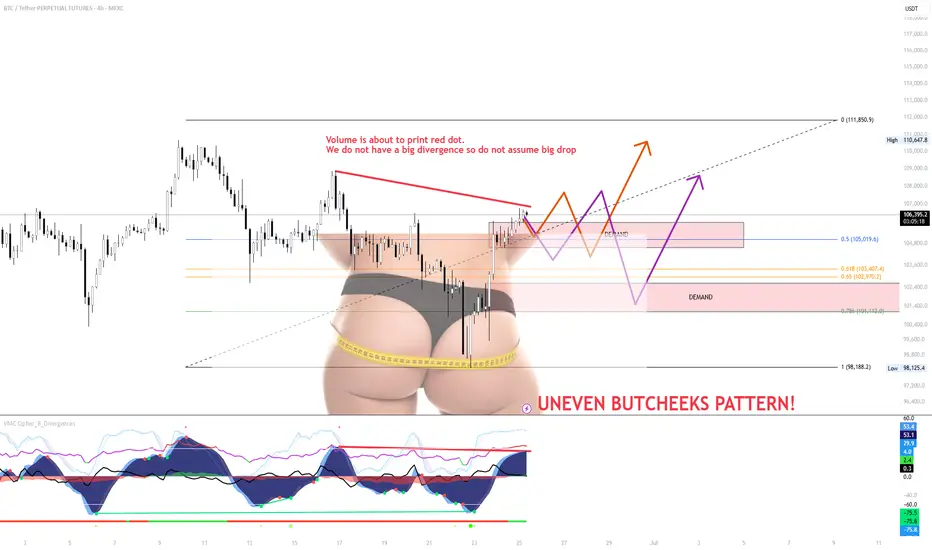
SMALL RETEST on BTC and continuation of BTC TrendThe small range forming just under local resistance is weak and showing signs of exhaustion. Despite a possible red dot printing soon, volume is not confirming a strong bearish divergence, so don’t assume a major drop is guaranteed just yet.
The “Uneven Butcheeks” pattern visually highlights imbalance
A fakeout back into the range, or
A flush to grab liquidity sitting beneath key demand zones.
Key Scenarios
Scenario A (Orange Path)
A breakout through the overhead supply zone could trigger upside continuation toward $111,850.
But unless it’s backed by strong volume and broader BTC strength, I’ll be fading this move.
Right now, this doesn’t look like conviction from bulls — it looks like exhaustion.
Scenario B (Purple Path)
A rejection at current levels or a weak fakeout could break back into the demand zone.
With thin structure below and low buy-side aggression, price could sweep down toward $102.9k–$101.1k, or even lower.
If we get this move, I’ll be watching how buyers behave around the lower demand — that’s where bulls need to prove themselves.
⚠️ Strategy:
Don’t front-run this — let the price confirm or invalidate.
Watch volume. Watch BTC dominance.
Until then, this zone is chop-heavy, and patience = protection.
BITCOIN - Price can continue grow inside flat to $107933 level#BTC
The price is moving within a descending channel on the 1-hour frame and is expected to break and continue upward.
We have a trend to stabilize above the 100 moving average once again.
We have a downtrend on the RSI indicator that supports the upward move with a breakout.
We have a support area at the lower boundary of the channel at 106500, acting as strong support from which the price can rebound.
We have a major support area in green that pushed the price upward at 106000.
Entry price: 106736
First target: 106996
Second target: 107434
Third target: 107933
To manage risk, don't forget stop loss and capital management.
When you reach the first target, save some profits and then change your stop order to an entry order.
For inquiries, please comment.
Thank you.

Bitcoin ready for new ALL TIME HIGHS.I think a breakout from this region is closer than people think.
Break of structure to the upside on the daily already occured . Order block is holding nice . A fvg has formed and a retest could occur , around 103.4k- 104.5k.
Overall the chart is bullish.
Next week we might see new All Time Highs.

Bitcoin ready to move towards 85,000Be prepared to fall after breaking the trend line and back to the target of 85,000.
Bitcoin ready to move towards 85,000🤪🤪🤪🤪🤪

Bitcoin Technical Analysis | The Most Important Channel 📊 Bitcoin Technical Analysis | The Most Important Channel You’ll Ever See!
This might be the most critical BTC chart you come across. I've mapped out the key ascending channel that has defined Bitcoin’s long-term trend over the past few years. The upper boundary, lower boundary, and especially the midline have repeatedly acted as dynamic support and resistance levels.
Right now, BTC is trading near the channel top, with strong bullish momentum. While the buying pressure remains high and a breakout is possible, watch out for potential rejections or fakeouts around this area.
All major support and resistance levels are clearly marked in this chart. Make sure to draw this channel on your own chart and use it as a powerful tool in your trading decisions.
🧠 Follow for more high-probability setups, smart technical insights, and real-time updates!

BTC/USDT.P – Intraday Plan (15m, Ichimoku) by RiscoraPrevious idea played out. The last candle showed strong volume and a wick to the upside, signaling some liquidity has been taken.
From here, I expect either a minor high above that wick or a correction down to the 0.618 area, then continuation of the bullish move towards the yellow liquidity block.
If price breaks below recent lows, the 106,300 level has proven itself as solid support—buyers have stepped in there twice with strong volume, so I’m not expecting it to give way easily.
Overall, I anticipate another push up to collect liquidity above and will reassess once price reaches the upper range.
Watching price action closely for confirmation.
#BTC #Crypto #Trading #Ichimoku #Riscora

btc my weekly analysis for the btc move insha allah btc shows as big opportunity dirrection toward sell or bear position at the price of 99k
Today's BTC trading strategy, I hope it will be helpful to you Four Bullish Drivers Behind Bitcoin's Rally
(1) Institutional Capital Rampage: From Whale Holdings to Market Scarcity
- **BlackRock et al. as anchor investors**: BlackRock's Bitcoin ETF (IBIT) has ballooned to $71.9 billion, holding 660,000 BTC—equivalent to 3.1% of total circulating supply. Such "whale-level" positions not only provide liquidity support but also shatter traditional financial institutions' attitude toward crypto.
- **Accelerating OTC concentration**: OTC platform data shows Bitcoin inventory plunged from 166,500 coins at the start of the year to 137,400 coins, a 17.5% drop. This signals massive coins are shifting from exchanges to institutional custody, creating a "scarcity effect" analogous to apple prices surging due to supply shortages.
(2) Fed Rate Cut Expectations Ignite Hot Money Inflows
- **Policy pivot-driven capital reallocation**: After Fed Governor Bowman signaled a possible July rate cut, CME futures now price in two 2025 rate cuts (up from one). Historical parallels: Bitcoin surged 42% in 6 months post-Fed's first 2019 rate cut (S&P 500 +12%), as low rates enhance Bitcoin's appeal as a "non-sovereign asset".
- **Diminishing opportunity costs**: A potential Fed rate cut would lower real yields (nominal rate - inflation). If 10-year Treasury real yields fall from 2.3% to 1.5%, the opportunity cost of holding gold/Bitcoin declines, pushing funds from bonds into risk assets.
(3) Regulatory Gate Opening: Chinese Brokerage Breaks New Ground
- **Guotai Junan International's milestone**: On June 24, Hong Kong's SFC approved its virtual asset trading services, making it the first Chinese-funded brokerage to gain such. This opens a "compliant channel" for mainland capital—post-announcement, its HK shares surged 101%, while OTC Bitcoin inventory dropped by 3,000 coins, indicating institutions are front-running liquidity inflows.
- **Financial infrastructure upgrade**: The service allows clients to trade BTC via traditional securities accounts, lowering entry barriers. Analogous to Chinese brokerages accessing gold ETFs in 2013, such channels typically trigger explosive incremental flows, expected to attract $1-2 billion from family offices initially.
(4) Technical "Golden Cross" Confirms Long-Term Trend
- **Key moving average resonance**: BTC recently completed a 50-day MA (102,300 USD) cross above 200-day MA (94,700 USD), forming a "golden cross". Backtesting 2019 and 2020 instances, this pattern preceded 58% average 6-month gains, though short-term pullbacks (10-15%) are common (e.g., June 2023 post-cross correction).
- **Strong support forming a safety net**: The 200-day MA now acts as dynamic support—pullbacks to ~95,000 USD would represent a "secondary buying opportunity at institutional cost bases", similar to housing prices finding support when breaking below moving averages.
Today's BTC trading strategy, I hope it will be helpful to you
BTCUSDT BUY@106000~107000
SL:105000
TP:108000~109000

Bitcoin at Risk: Will Geopolitical Tensions Push BTC Below $90K?By analyzing the #Bitcoin chart on the weekly timeframe, we can see that the price continued its correction amid rising tensions and conflict between Iran and Israel, dropping to as low as $98,000. Currently, Bitcoin is trading around $101,000, and if these tensions escalate further — especially if Iran decides to close the Strait of Hormuz — it could significantly impact global markets, and Bitcoin would not be an exception.
If BTC fails to hold above $100,000 by the end of the week, a continuation of the drop toward $90,000 is possible.
Please support me with your likes and comments to motivate me to share more analysis with you and share your opinion about the possible trend of this chart with me !
Best Regards , Arman Shaban

Premium zone tagged — now we watch how the Smart Money reactsBitcoin just tapped into the 108,151 level — the top of a measured premium range and a likely area where profit-taking begins and fresh distribution footprints form.
This run-up wasn’t random. Price surged from inefficiency, cleanly filled the fair value gap (FVG), and is now flirting with a key liquidity pocket.
Here's what the structure says:
Premium reached: 108,151 (0% fib)
If rejection holds, Smart Money looks to discount entries:
0.236: 106,136
0.382: 104,889
0.5: 103,882
Deep retracement zone: 0.618 at 102,874
Final defense for bulls? The unmitigated FVG block between 101,440 → 99,613
Possible Playbook Scenarios:
Quick retrace → higher high:
Bounce off 104,889 or 103,882 before attacking 108,967+
Deeper sweep:
Into 102,874 (0.618) before Smart Money steps in again
Invalidation:
Break below 99,613 closes this bullish narrative and confirms a structural break
TL;DR Execution Logic:
Wait for retracement into 0.5–0.618 fibs
Look for bullish reaction (engulfing or SFP)
Upside targets:
108,151 (retest)
108,967 (liquidity sweep)
Further upside if momentum sustains

Bitcoin possible sell idea Bitcoin appears to be losing momentum, with buying pressure easing. This could signal a short-term selling opportunity as the market enters a correction phase.

BTC - LONG SET-UPBINANCE:BTCUSDT
Bitcoin is currently testing its critical resistance level
If the price gets rejected here, the key support to watch is the $𝟏𝟎𝟏,𝟐𝟎𝟎 - $𝟏𝟎𝟐,𝟖𝟎𝟎 zone. This area represents a strong demand level where a potential buying opportunity could emerge.
For a trade setup based on this support, a strategic Stop Loss (SL) should be placed below the $𝟗𝟖,𝟎𝟎𝟎 mark to manage risk.
For now, patience is crucial. Keep a close eye on the price action

BTC - 103.5 - 102k when?OKay so the move as marked did move but is choppy, owing to the new pattern, lets see if triple tops are made and is done in a manner where it falls, LIQ shows at 108,800, BTC genuinely looks very very tired!

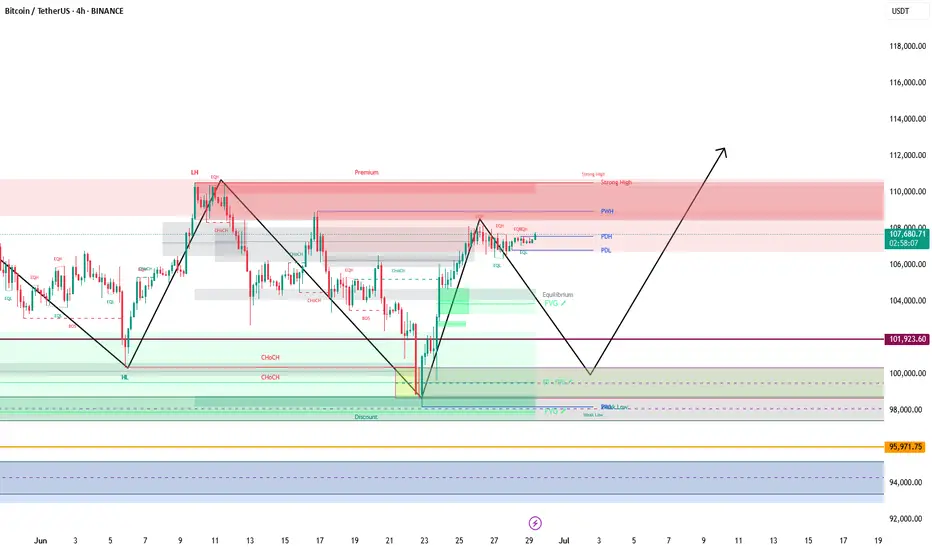
Bitcoin (BTC/USDT) – 4H Analysis UpdateBTC is currently holding above the key resistance-turned-support zone of $106,057, after a clean breakout from the symmetrical triangle last week. Price is consolidating just below $107,000, signaling a potential pause or minor pullback before the next leg.
Technical Overview:
Trendline support from May is intact
$106K zone flipped into support — critical for bulls to hold
Price action is compressing under resistance at $107,000
Holding here may lead to a retest of $108,895, then $111,785
Key Levels to Watch:
Support:
$106,057 – Immediate support
$101,409 – Mid-range demand zone
$98,898 – Rising trendline
$93,343 – Strong base zone
Resistance:
$107,000 – Minor resistance
$108,895 – Major resistance
$111,785 – Upper breakout target
Outlook:
Bulls need to defend the $106K zone to maintain momentum. Failure to do so could cause the price to pull back toward $101K. On the flip side, strong volume above $108900 may trigger a rally toward $111K+.
DYOR | Not Financial Advice

Bitcoin (BTC): Aiming For $104,000 Before Next Bullish MoveWe are getting ready for another upward movement on Bitcoin, which we have marked as an area near $104K.
Ideal zone slightly below EMA where the order book has shown a decent amount of orders just sitting. This is the zone we will be looking for any kind of MSB to form with a proper breakout, which then would lead the price back to upper zones!
Swallow Academy

Bitcoin Bullish Flag Breakout Incoming?MARKETSCOM:BITCOIN is currently consolidating within a bullish flag pattern on the daily chart, following a strong impulse move from the $74,000 support zone marked in April. The price is hovering near a critical horizontal resistance zone ($ 108,000–$ 109,000), which has historically acted as a major barrier to further gains.
Technical Highlights:
Bullish Flag Pattern: Clear flag formation after a strong uptrend, suggesting continuation potential.
Strong Support Rebound: April's bounce from the ~$74K support zone marked a key higher low.
EMA: Price is currently trading above both the 50-day and 100-day EMAs — a bullish sign of momentum.
Breakout Potential: A confirmed breakout above the flag resistance (~$109K) could ignite a strong rally toward $130K+.
Breakout Move: If the flag pattern plays out, CRYPTOCAP:BTC could target the $125K–$135K zone in the coming weeks.
Buy Entry: Once the day candle closes above the flag resistance line

BTC Key levelsBTC key levels are below
These are very important levels for reversals and breakouts.
111, 898
97,893
89,362
74, 538

BTCUSDT:Sharing of the Latest Trading StrategyAll the trading signals last week have resulted in profits!!! Check it!!!👉👉👉
Bitcoin Technical Analysis (4-Hour Chart):
Price remains within an ascending channel. The MACD above the zero line with expanding red histograms indicates bullish dominance. After firmly breaking above the key resistance at $105,000, price is testing $110,000.
Caution: The RSI near 70 has entered overbought territory, increasing short-term pullback risks.
Support levels: $106,000 and $105,000.
Trading Recommendation for Aggressive Traders
Consider light long positions near $106,000 on pullbacks, with stop-loss set below $105,000.
Trading Strategy:
buy@105000-106000
TP:108000-110000

Bitcoin (BTC): Still Hovering Near ATH | Seems WeakeningBitcoin is still hovering near the local ATH area, where sellers and buyers are fighting over the zone there.
There is nothing clear yet so we keep on monitoring, but we are seeing smaller signs of weakness, which indicate upcoming volatile movement as we are approaching the end of the month.
Now we will keep an eye on how sharp the monthly opening will be and based on that, we will trade. Our attentions are still at $120K for now.
Swallow Academy

BTCUSDT in a sell zone Let's keep it simple.
The IOF is bearish on the H4 timeframe.
Price has retraced to a premium zone.
Technically, once we see a lower timeframe confirmation from these zones, we take a sell.
While I'm eyeing the liquidity at 109050, any break below 106415 will usher us into a sell towards 99000.
Use your proper entry confirmation and risk management.

BTC may going low after ATH?Weekly Analysis:
- Market to go higher , as last week's weekly candle was very bullish
- May sweep Weekly Buyside Liquidity
- May move bearish towards the Weekly FVG

BTC to sweep liquidity?4 Hour Analysis:
- Market moving out consolidation phase (Accumulating late buyers)
- May sweep the 1st buyside liquidity (see chart)
- Or may sweep the ATH above the 1st buyside liquidity (see arrow on the right of the chart)
