BTC gonna surprise us its not the end for btc
looks very juicy
last bull flag gave huge pump
will this bullflag will be the same ?
place ur bets
BTCUSDT.3L trade ideas
Do you think it supports this model?After two weeks away from you, I am back.
Hello friends, as some of you dear ones know, I live in Iran, and due to the two-week war in Iran, I was not in the mood for analysis, nor was the internet helpful.
But I came back to you so that we can identify the profits together.
.
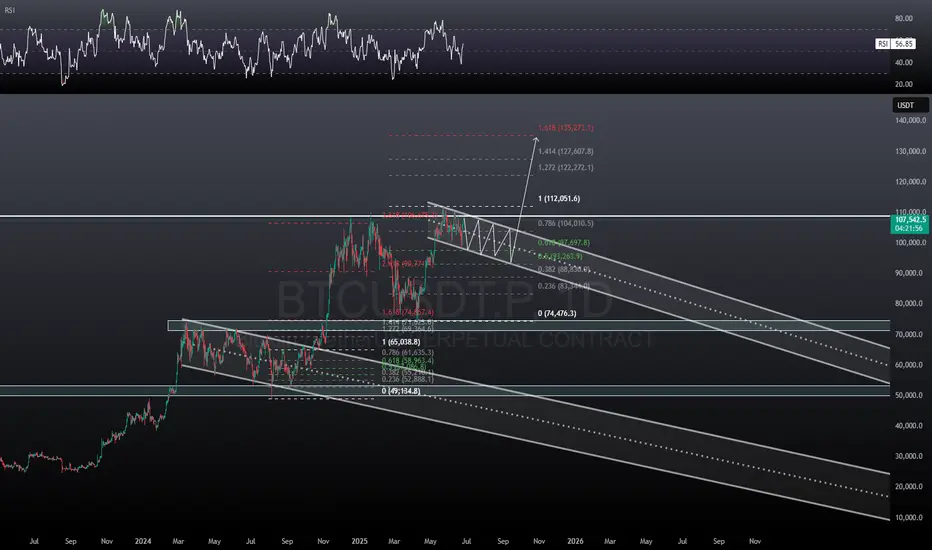
The chart you see has formed an old pattern (flag pattern), and if it breaks out of this pattern from above, we can expect an increase as large as the previous lag.
The target of this increase is the area that we had mentioned in previous Bitcoin analyses. (You can enter the page and look at the analyses)
.
I hope you have used this analysis well.
I wish you complete peace wherever you are.
You can follow the page to see more analyses, hoping for good days.

BTC recovers, price range sideways trend line💎 Update Plan BTC (June 25)
Notable news about BTC:
🌐 Growth stimulus factor
Reducing geopolitical tensions: The ceasefire agreement between Iran and Israel has helped improve investor psychology, promote capital inflows into risky assets like Bitcoin.
The dollar weakened: The USD index dropped to the lowest level in a year due to concerns about the economic impact from President Trump's tax policies, making Bitcoin a more attractive choice for investors to search for replacement assets.
Expectations for monetary policy: The decision of the US Federal Reserve (Fed) on keeping interest rates stable and interest rate cutting capacity in July has motivated the cryptocurrency market.
Technical analysis angle
Bitcoin may increase to the highest level of all time
Bitcoin price reached the lowest level of $ 98,200 on Sunday but has recovered strongly 5% in the next two days, closed on the dynamic average line according to the 50 -day exponential jaw at $ 103,352. At the time of writing on Monday, the price continued to trade higher at about $ 106,500.
If BTC continues to increase, the price can expand the momentum to the highest level of all time is $ 111,980 on May 22.
The relative power index (RSI) on the daily chart is 54, higher than the neutral level of 50, showing the motivation for price increase. The average divergent divergence (MACD) is referring to the price intersection (the MACD is about to cut on the signal line), if completed, the purchase signal will be made.
==> Comments for trend reference. Wishing investors successfully trading

BTC: One More Leg Down?
I believe the impulse BINANCE:BTCUSDT BITSTAMP:BTCUSD BINANCE:BTCUSDT.P from April to May has been completed, and we are currently in a correction phase, which is likely to continue for some time.
In the base case, I’m considering a simple zigzag pattern:
Wave A – impulsive move down
Wave B – forming a symmetrical triangle
Wave C – expected next
🎯 Target zone: 97,500, where we have a confluence of weekly FVG, 20-week MA, and vWAP.

Weekly trading plan for BitcoinLast week price action showed a local correction before reaching the first target. This week, we may see a deeper pullback before the next targets are hit and ATH is revisited. In this idea I marked the important levels for this week
Write a comment with your coins & hit the like button and I will make an analysis for you
The author's opinion may differ from yours,
Consider your risks.
Wish you successful trades ! mura


BTC/USDTSince last November, price action has been ranging above and below a rising wedge which is typically a bearish structure. This has created plenty of market indecision with bears poised to regain control at every dip.
However, the recent pullback didn’t reach the wedge’s support line which is a subtle bullish sign and we’ve now clearly formed an inverse head and shoulders, a classic bullish reversal pattern.
A breakout is on the table with a target at $143K.

Bitcoin Update
Just to make it simple panda fam, Lets analyze it ! 💭
— Scenario #1 - PBr2 still possible we get rejected since we are on PBr2 keylevel resistance ranging 108099 - 107465, Same time we are under major trend resistance also. 📉
— Scenario #2 - PBr1 bounce support at 102188 - 101786 this will be valid if we get rejected at PBr2 and retest as normal correction movement. 🐂
— Scenario #3 - Breakout above major trend resistance, valid if we sit on trend major resistance as support . Short term possible target at 112004. 🚀
Always trade safe and stay updated to our updates panda fam ! Kupit kupit lang muna tayo sa altcoins. 🙌

Bitcoin Weekly, Not Good But... Opportunities AboundI cannot say about the weekly timeframe the same I said for the daily, the situation here is different. The chart looks bad. The weekly close changes nothing.
If Bitcoin moves and closes weekly above $106,000, this can be good news, but any trading below this level has bearish potential. It can be a period of bullish consolidation but the bearish potential cannot be ignored. So, I will keep it short. Bitcoin remains in doubt on the weekly timeframe.
Bullish above $100,000. Bearish below $100,000.
It has been six weeks with Bitcoin moving with basically no change.
Last week's action did produce some loses for some traders, but for us the market remains the same. We focus on the altcoins, ignore Bitcoin for now, there is no growth and the action is still happening near resistance; at short-term support but overall, closer to a top than a bottom. It is risky to say the least. Many altcoins are trading at bottom prices and growing strong. We go for the low risk vs high potential for reward chart setups. We don't mind the market shaking, evolving or reacting to some geopolitical event, we do care about making the right choices... Focus on the altcoins for now, and for long...
Hold on. I shall give you more information.
Bearish action is indeed present but still weak.
Bearish volume is very low.
The fact that more than 1B worth of leveraged positions were liquidated calls for a pause. Each and every time this amount of money is taken out of peoples hands and transferred to the exchanges, the market changes direction. Regardless of the signals, the bigger picture or the long-term. This is a huge transfer, the whales are getting richer, retail is getting rekt.
So, the market is likely to shake some more. This is only because Bitcoin is trading way too high and hasn't produced any significant retrace after considerable growth. Again, we buy those trading low near support. We sell those trading high near resistance. As long as this is the MO, we are sure to win in the long-run.
I wouldn't want to buy-long a project that is crashing when there are others growing, yet to grow and with huge potential for growth.
Remember, the market is big now, Bitcoin is very strong above 100K. It can happen that Bitcoin goes on a retrace while the altcoins move ahead. Money flowing out of the big projects reaches the smaller projects, classic bull market dynamic. Nothing surprising; opportunities are endless.
Thanks a lot for your continued support.
Namaste.

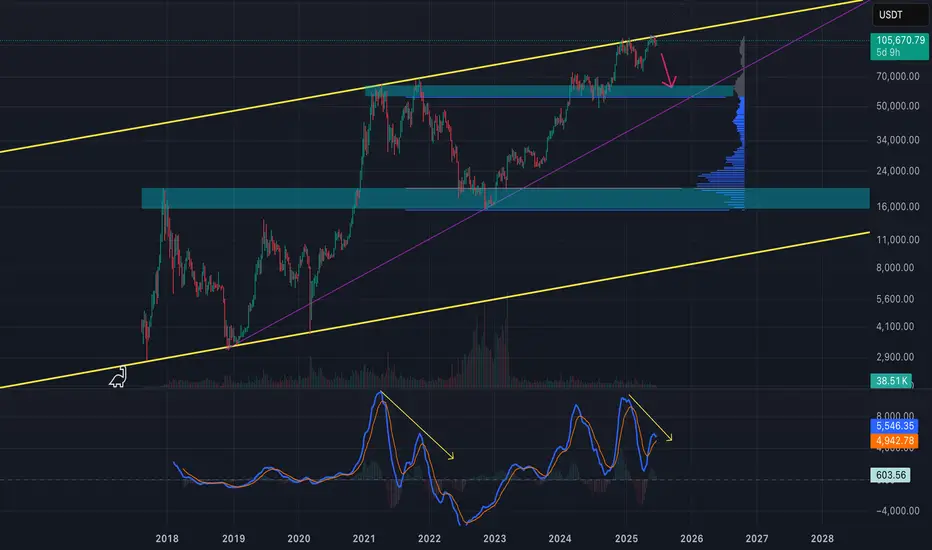
BTC - Getting 2021 Double Top/Bearish VibesLooking at the weekly chart for BTC, I'm seeing similar price action from when we double topped in 2021. We hit the top of the channel, corrected, and then had a slightly higher high before going down hard. Again we hit the top of the channel, had a strong correction, only to hit it again for a slightly higher high. But the signs of market weakness are showing in the indicators and price action. Not to mention war is looming between Israel and Iran. I'm taking a defensive posture here. I think if the bears take control, we could hit the $60k liquidity area that we missed on the last correction. We can reassess the market better at the time based on the price action and current events.
BTC/USD.4H CHART PATTERN.Based on MY BTC/USDT 4H chart the following analysis and price targets apply:
---
📉 Chart Pattern:
A symmetrical triangle pattern is visible, with price nearing a potential breakdown.
You’ve marked a breakdown scenario, supported by the Ichimoku cloud turning bearish and resistance rejection.
The market has respected both support and resistance trendlines multiple times, increasing pattern validity.
---
🎯 Bearish Targets After Breakdown:
1st Support Target:
Level: Around $98,000
This is the first zone where buyers might step in. It aligns with previous consolidation and structural support.
2nd Support Target:
Level: Around $94,000
This is a deeper support level and likely final target if selling pressure continues.
---
🔍 Summary:
Sell below: ~$104,000 (on breakdown confirmation)
Target 1: ~$98,000
Target 2: ~$94,000
Stop-loss suggestion: Above upper triangle trendline (~$106,500 or above recent high)
Let me know if you want a trading strategy with risk/reward ratio or SL/TP management tips.

Bitcoin Hits PRZ — Is This the Perfect Short Entry?Bitcoin ( BINANCE:BTCUSDT ) has entered the Potential Reversal Zone (PRZ) after a strong bullish impulse , testing the confluence of Daily Resistance(3) .
In terms of Elliott Wave analysis , the market seems to have completed a complex WXY corrective structure , with the recent rally likely representing the final wave Y . This makes the current zone highly reactive for potential reversal .
I expect Bitcoin to retrace toward the CME Gap($105,075-$105,055) and possibly continue downward toward the Support zone($104,380-$103,060) and Cumulative Long Liquidation levels if the sellers regain momentum .
Cumulative Short Liquidation Leverage: $107,568-$106,601
Cumulative Long Liquidation Leverage: $105,360-$104,784
Cumulative Long Liquidation Leverage: $103,937-$103,217
Note: It is better to look for short positions at the Potential Reversal Zone (PRZ) or if Bitcoin touches $104,780 before reaching PRZ. That is why I chose to label this analysis as ''Short".
Note: If Bitcoin can touch $107,620 , there is a possibility of breaking the resistance lines and increasing further.
Please respect each other's ideas and express them politely if you agree or disagree.
Bitcoin Analyze (BTCUSDT), 1-hour time frame.
Be sure to follow the updated ideas.
Do not forget to put a Stop loss for your positions (For every position you want to open).
Please follow your strategy and updates; this is just my Idea, and I will gladly see your ideas in this post.
Please do not forget the ✅' like '✅ button 🙏😊 & Share it with your friends; thanks, and Trade safe.

Bitcoin Crash to $93k is Progressing Well! But be Careful Now!I have explained the price action of Bitcoin, shared my insights on what will happen next, and updated my previous idea on $BTC!
Smash the rocket button if you feel the Bitcoin bearish vibe!

Bitcoin Daily Bearish: If 100K Breaks, 80KBitcoin being bearish is only true if the $100,000 support level breaks. If it breaks expect the market to dive down, deep and fast and reach around $82,500 or $88,888. But this is only if the support breaks. If support holds, as it is doing so far, then you can expect higher prices in the coming weeks. If support breaks, the flush is likely to be super fast and strong which means that you will still get higher prices in the coming weeks, so the conditions remain the same mid- to long-term, only the short-term is now in question. The bears are putting pressure on the market and many LONGs have been liquidated already.
It will be nice to see how it all develops, but it shouldn't take more than two weeks. We are likely in the clear in a matter of days (2-3 days). Do not be afraid if the market shakes, Bitcoin is going up; Crypto will grow, regardless of the short-term.
Namaste.

BITCOIN → Possibility of retesting 100K. Buyer weakeningBINANCE:BTCUSDT.P is in consolidation after the rally stalled due to the exhaustion of the bullish driver. The price updates local lows and starts looking at 100K
Bitcoin is under pressure after the escalation of conflict in the middle east and after the FOMC speech. There is also another observation: large companies, politicians, funds and investors have long and aggressively motivate the crowd to buy, verbally confirming that they bought dozens and hundreds of bitcoins at a time for the balance, but bitcoin is standing still and updating lows. At the same time, various services such as "cryptorank" fix bullish sentiment at the lows. The market either lacks liquidity or something more unpredictable is happening (chart drawing????)
Technically, bitcoin is following the behavior of the SP500 quite strongly, which closes Friday's session quite weak and close to key support, which could trigger a continuation of the decline. Bitcoin won't stay on the sidelines and could also follow the index....
Resistance levels: 104K, 105K, 106K
Support levels: 102K, 100.6K, 97.5K
The price is coming out of the “symmetrical triangle” consolidation breaking the support, thus confirming the bearish mood. After a small correction after a false breakdown of 102500 the price may again return to storm (retest) the level under market pressure, which will only strengthen expectations of further decline. The target is liquidity 100600 - 100K. From 100K rebound and growth is possible.
Regards R. Linda!

Bitcoin Short-Term Recovery Confirmed Bulls Win!Ranging markets/sideways markets is when traders lose the most money. Always keep this in mind.
» Short-term signals are pointing to a recovery right away.
» Bitcoin's drop wicked below the 13-June low but the RSI produced a higher low and thus we have a bullish divergence.
» Bitcoin's current drop went lower yet the chart reveals lower volume now compared to 13-June. This reveals weakness on the bear camp. This means a recovery will happen next, right away.
These are just a few signals but taken together with the altcoins analysis that I showed you and the bigger picture; Ha ha! The bulls win again.
Namaste.

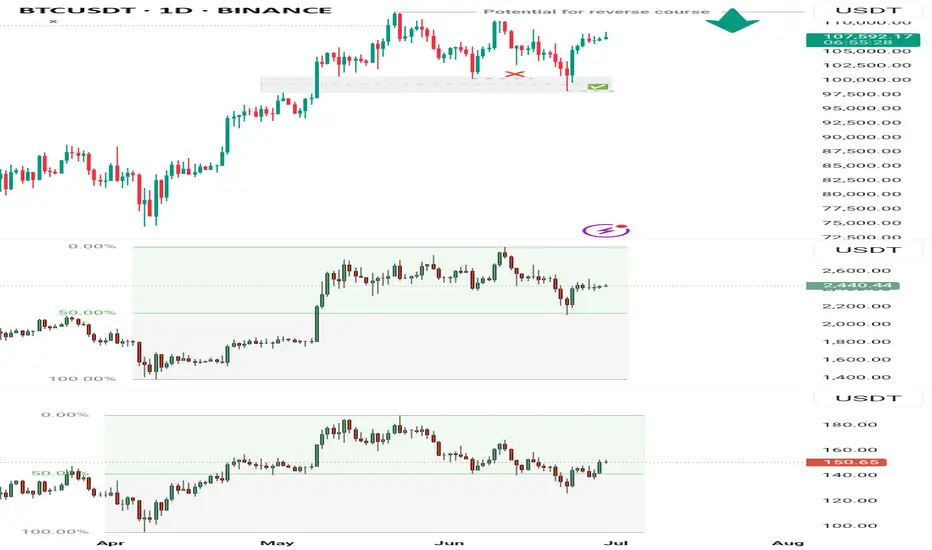
BTCUSDT Market Outlook (Daily Chart)BTC’s failure to rally into a new all-time high (ATH) from the June 5th low can be attributed to the fact that price wasn't coming from a true discount zone. Similarly, key correlated assets like ETH and SOL also hadn’t reached their respective discount levels at that point. This misalignment created an unbalanced market structure, which necessitated a corrective move to realign broader market pricing.
Now that both ETH and SOL have tapped into their discount zones and shown signs of recovery, the conditions are more technically sound to project a potential ATH for BTC in the coming weeks or month. However, on a broader scale, this current rally could serve as a liquidity trap — drawing buyers into a high before distribution.
As for now, any sudden price drop should be seen as a potential buying opportunity into the anticipated new ATH. But caution remains key — any strong sell signal or reversal confirmation near the ATH zone could trigger a significant selloff as sellers regain control.
BTC/USDT, 4H chart, Futures - Bullish projection.The price is expected to consume time in its SQZ and take liquidity at the bottom of the range to make decisions... to UP

BitSupport and resistance levels are identified on the one-hour timeframe, and the momentum increases in either direction when broken.

BTC | At the Line Between ATH Expansion or Macro FlushBINANCE:BTCUSDT Bulls need to hold the $102k–$100.8k support and 1D 50MA for a shot at new highs.
– Wick into 1D FVG ($98k) is fine, but no daily close below 50MA allowed.
– Lose $100k? Then it’s sideline season — next real support only at $93k/$87k, macro flush risk toward $75k–$58k if momentum fails.
– As long as above 1D support/MA, there’s a chance for a clean ATH breakout from the OB under the highs.
This is the zone to bet on continuation. If not, don’t fight the trend lower.

BTC TIME TO HEAD SOUTH BTC has given a CHOCH
Proper risk management
Sit tight as we ride to 102634.59 region.

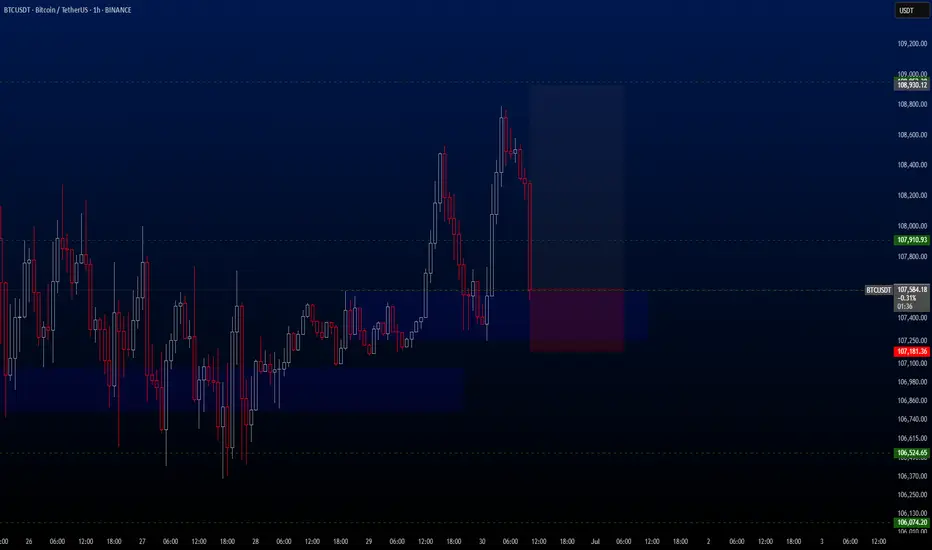
BTCUSDT Hello traders. Wishing you a great start to the week!
This week’s first trade opportunity comes from the BTCUSDT pair. Over the weekend, the pair showed significant volatility, dropping from 108,776 to 107,565 in just a few hours. However, I see this drop as a potential buying opportunity.
In my view, the price is likely to bounce back towards the 108,930.12 level in the short term. Therefore, I’ve activated the trade and I’m sharing the details with you below:
🔍 Trade Details
✔️ Timeframe: 1-Hour (H1)
✔️ Risk-to-Reward Ratio: 1:3.20
✔️ Trade Direction: Buy
✔️ Entry Price: 107,590.73
✔️ Take Profit: 108,930.12
✔️ Stop Loss: 107,181.36
🕒 If momentum weakens or price consolidates in a tight range, I will keep this trade open only until 23:00 (UTC+4). After that, I’ll manually close it—whether in profit or loss—based on how price action evolves.
🔔 Disclaimer: This is not financial advice. I’m simply sharing a trade I’ve taken based on my personal trading system, strictly for educational and illustrative purposes.
📌 Interested in a systematic, data-driven trading approach?
💡 Follow the page and turn on notifications to stay updated on future trade setups and advanced market insights.
Bitcoin - overview with Initiative AnalysisHey traders and investors!
📍 Context
On the daily timeframe, the market is in a sideways range.
The boundaries are marked with black lines.
Buyer initiative is currently active.
Targets: 108,952; 110,530; 111,980.
📊 Key Actions
The seller attempted twice, on increased volume, to break down below the range, but both times the buyer brought the price back inside. Only seller wicks remained below the lower boundary.
🎯 Trade Idea
🔹 Look for long setups from 105 500 -104,622 or the 103,400–100,718 zone.
There is no context for short trades at the moment.
This analysis is based on the Initiative Analysis concept (IA).
Wishing you profitable trades!
