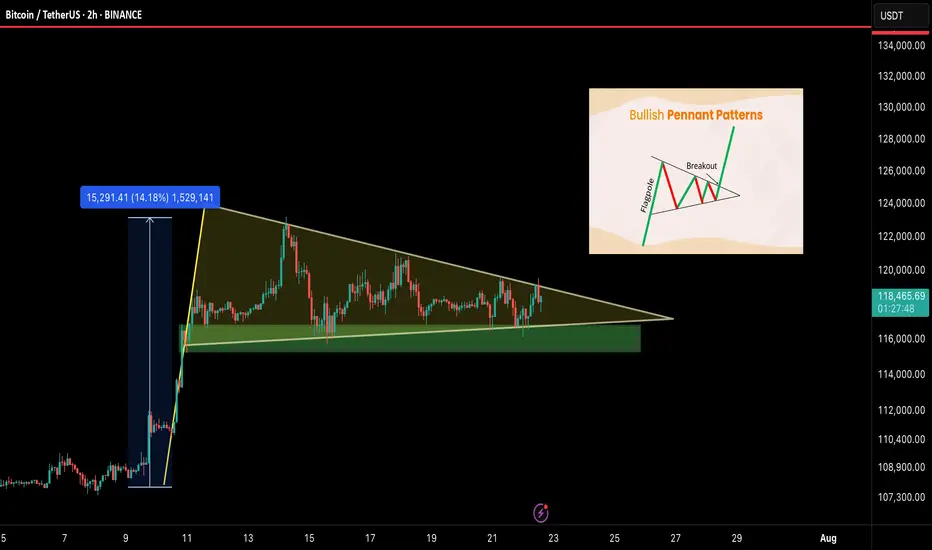
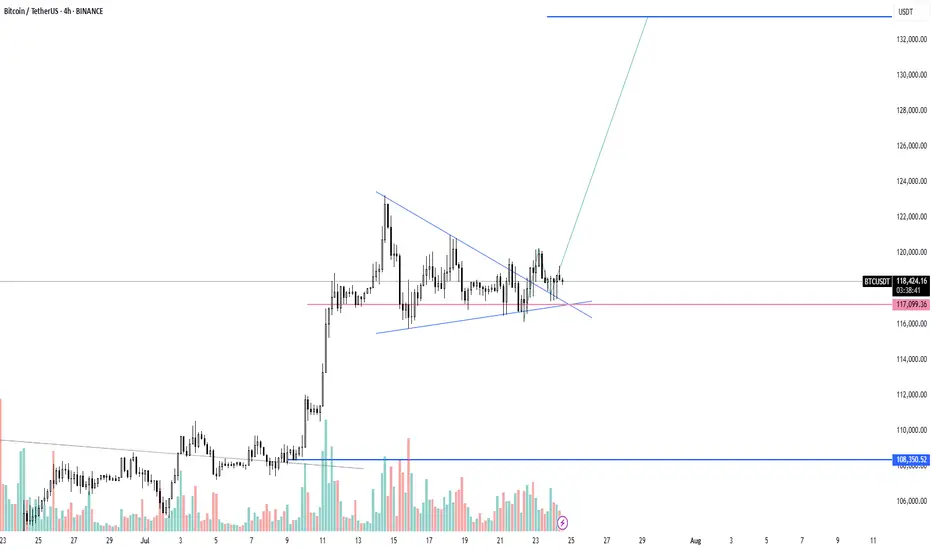
BTC/USDT – Bullish Pennant Setting Up for the Next Leg!Bitcoin is currently forming a bullish pennant — a classic continuation pattern — right after a strong 14% impulse move. This type of structure often leads to a breakout followed by another powerful rally. And it’s coiling up nicely.
🧠 Technical Breakdown:
🟢 Bullish pennant formation in progress
🔽 Support zone: $115.5K – $116.5K
📏 Flagpole projection targets $135K+ on breakout
⚠️ Currently consolidating with lower volatility — breakout could be near
🔍 What to Watch For:
Clean breakout above pennant = breakout confirmation
Daily close below $115K = invalidation zone
Volume spike will likely signal the next move
📢 Final Take:
BTC is showing healthy consolidation after a strong move, and this pennant could launch us toward $135K and beyond. Keep your eyes on the breakout and manage risk wisely.
💬 Share your thoughts below & smash that ❤️ if you’re watching this move!
BTCUSDT.3S trade ideas
BTC SHORT IDEA114500 is TP1
113 is TP2
BTC is in Price Discovery Mode...
New ATH was created recently.
500M Shorts were Liquidated at 122k Region.
All the dips are healthy.

BTC - Nuke down to 104k?Hahhaa noo, but payttern shall commence in orange for a good move altogether!

$BTC Breakout Coming?CRYPTOCAP:BTC is coiling up inside a symmetrical triangle on the 2H chart.
A breakout looks close if it clears resistance; we could see a 7.5% move toward the $127K–$128K zone.
Watch for volume confirmation.
DYOR, NFA

Support around 115854.56-116868.0 is the key
Hello, traders.
If you "Follow", you can always get the latest information quickly.
Have a nice day today.
-------------------------------------
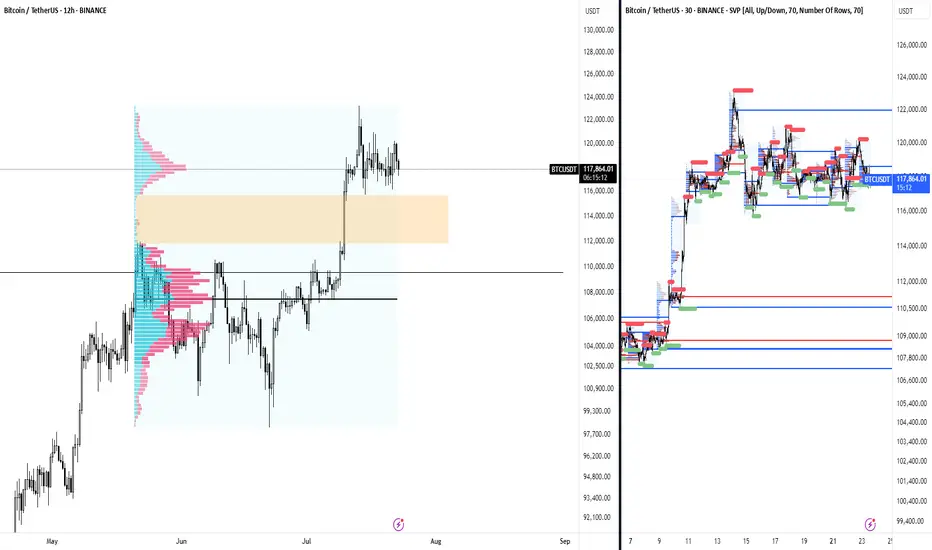
(BTCUSDT 1D chart)
The DOM(60) indicator of the 1W chart is generated at the 119177.56 point, and the DOM(60) indicator of the 1D chart is generated at the 119086.64 point, and then shows a downward trend.
However, since the HA-High indicator is formed at the 115854.56 point, it is difficult to say that it has yet turned into a downward trend.
Accordingly, it is necessary to check whether it is supported in the HA-High ~ DOM(60) section.
The next volatility period is expected to occur around July 25 (July 24-26).
However, the important volatility period is expected to be around August 2-5 (maximum August 1-6), so we need to look at what kind of movement it shows as it passes through the volatility period that will occur in the future.
-
Since the StochRSI indicator has entered the oversold zone, there is a possibility that the decline will be restricted.
Therefore, the key is whether there is support around 115854.56-116868.0.
This is because if it falls below the HA-High indicator, there is a possibility that a downtrend will begin.
Also, since the M-Signal indicator on the 1D chart is rising around 115854.56, it can be seen as an important zone.
--------------------------------------------------
An indicator called Trend Check has been added to the OBV indicator.
This indicator is an indicator that comprehensively evaluates the StochRSI, PVT-MACD oscillator, and OBV indicators and expresses them in a column.
Accordingly, if the TC indicator rises from the 0 point, it can be interpreted that the buying force is dominant, and if it falls, the selling force is dominant.
Therefore, if it rises above 0, it is likely to show an upward trend, and if it falls below 0, it is likely to show a downward trend.
Also, if the TC indicator touches the highest point (6) or lowest point (-6), there is a high possibility that the trend will reverse, so you should think about a response plan for this.
-
Thank you for reading to the end.
I hope you have a successful trade.
--------------------------------------------------
- Here is an explanation of the big picture.
(3-year bull market, 1-year bear market pattern)
I will explain the details again when the bear market starts.
------------------------------------------------------

Bitcoin is testing the triangle ┆ HolderStatBINANCE:BTCUSDT is ranging $132K–$137K in a triangle pattern. Breakout above $137K may target $143K. Decision point near.

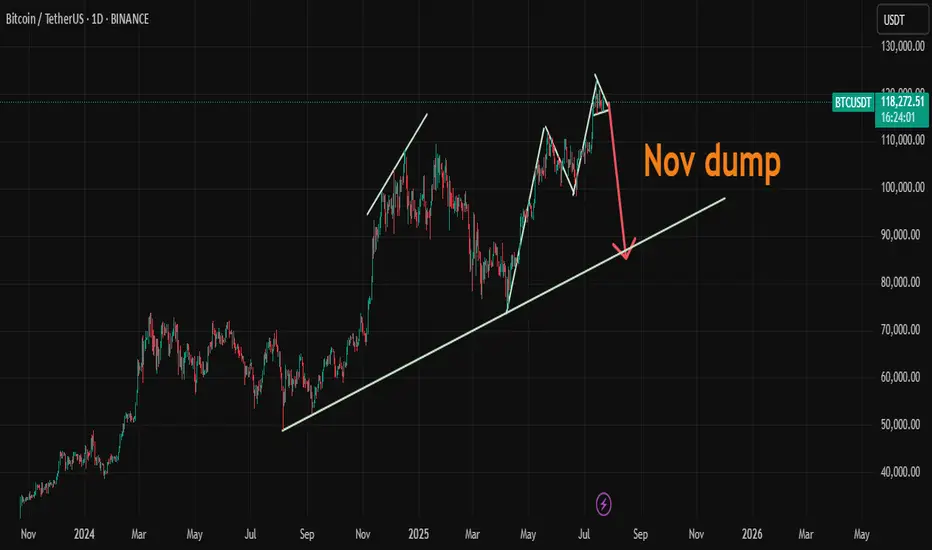
BTC/USDTHello friends, I hope you are well. We should probably expect a slight increase in Bitcoin after the big drop in the financial market, which will most likely start in November. What is your opinion?
BTCUSD NEW OUTLOOKBTCUSD market Continuously running in both sides from last couple of days now market will be touch the support zone you have to great chance to go long from
SOPPORT ZONE if you want
TRADE AT YOUR OWN RISK
REGARD ALBERT

BTC/USDT LONG SET UP (BITCOIN)Entry Price 1: $118,000
Entry Price 2: $116,500
Stop Loss: $115,000
Take Profit 1: $121,000 (Close 25%)
Take Profit 2: $124,000 (Close 50%)
Take Profit 3: $127,000 (Close 75%)
Take Profit 4: $130,000 (Close 100%)

BTC AI Prediction Dashboard - 6h Price Path (23.07.25)
Prediction made using Crypticorn AI Prediction Dashboard
Link in bio
BTCUSDT Forecast:
Crypticorn AI Prediction Dashboard Projects 6h Price Path (Forward-Only)
Forecast timestamp: ~11:00 UTC
Timeframe: 15m
Prediction horizon: 6 hours
Model output:
Central estimate (blue line): -118,258
Represents the AI’s best estimate of BTC’s near-term price direction.
80% confidence band (light blue): 118,206 – 118,719
The light blue zone marks the 80% confidence range — the most likely area for price to close
40% confidence band (dark blue): 117,712 – 119,423
The dark blue zone shows the narrower 40% confidence range, where price is expected to stay with higher concentration
Volume on signal bar: 133.21
This chart shows a short-term Bitcoin price forecast using AI-generated confidence zones.
Candlesticks reflect actual BTC/USDT price action in 15-minute intervals.
This helps visualize expected volatility and potential price zones in the short term.

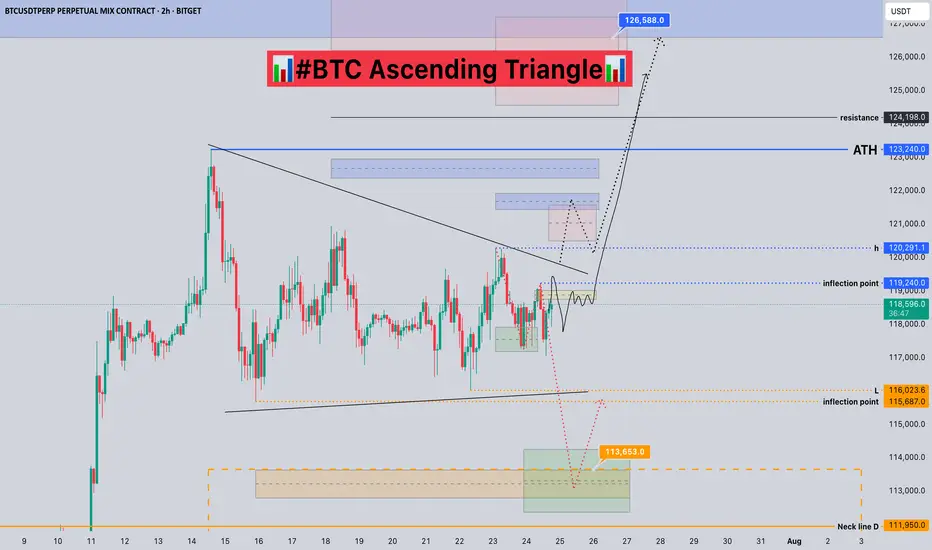
#BTC Ascending Triangle📊#BTC Ascending Triangle📊
🧠From a structural perspective, we are still in a sideways consolidation phase. We have already built a short structure. If we want to continue to rise, we need to break through the blue turning point 119240 and stabilize before we can usher in a big surge.
➡️From a morphological perspective, an ascending triangle is forming. After breaking through h, it is confirmed that the upward breakthrough will occur. The subsequent pullback is worth our participation.
⚠️If we fall below the low point near 116000, we cannot blindly go short, because the sideways consolidation time is too long. After the selling pressure is exhausted, the lows that appear are all opportunities for us to participate in long transactions.
🤜If you like my analysis, please like 💖 and share 💬 BITGET:BTCUSDT.P
BTCUSDT-LONG IDEABTCUSDT is in accumulation forming a triangle if it break this triangle then it will be heading toward top end of the pole buy using a buy stop Stop loss and take profit is mentioned in the chart

Bitcoin (BTC): Liquidity Hunting + Buyside Dominance | Bullish!What a week we have had so far; it has moved this whole week so far like one big rollercoaster, but nevertheless we are still above the $116K zone so we are bullish.
While we see slight buyside dominance,, we also see huge order limits sitting at $115K,, which means we might still see some kind of "last liquidity hunting."
That being said, we are keeping an eye on $116K and $115K zones.
Swallow Academy

Crypto Market Update & BTC & ETH Analysis
🚀 Crypto Market Update & Technical Analysis
🟢 Bullish News & Positive Signals:
• Altcoin Season Index is rising + CZ calls this the “FOMO season” → signaling emotional growth in altcoins, especially in short timeframes.
• Fear & Greed Index hits 74 → market is in a greedy phase; growth continues but a correction might be near.
• Goldman Sachs: Possible rate cuts from 2025 → expectations for a looser monetary policy, which is good for risk assets like BTC and ETH.
• Whales and institutions buying ETH (over 50K ETH in 48 hours) → suggests accumulation or preparation for the next Ethereum rally.
• $332M inflow into U.S. Ethereum ETFs → strong mid-term bullish fundamental for ETH.
• A whale withdrew 76,000 SOL from exchanges → usually a sign of HODLing and price growth expectations.
🔴 Warning News & Caution Signals:
• Bitcoin selling by long-term holders (high CDD) → selling pressure near historical highs could slow the rally, but not end it.
• Whale opened a 10x leveraged DOGE long ($19.82M) → could cause high volatility and liquidation risk for traders.
• TRON rings Nasdaq bell but TRX is negative → promotional event, but no strong demand reaction.
• BNB market cap surpasses Starbucks, but price is negative → long-term positive, but short-term market may be overheated.
• High Greed Index → short-term correction risk for BTC and alts.
✅ Analytical Summary (News + Charts):
• If technical signs of selling appear (especially on BTC or ETH), take them seriously as news supports selling pressure from some whales.
• Big institutional entries into ETH and SOL confirm the strength of the bigger trend.
• Market is emotional but still has a strong support base under BTC & ETH. Possible corrections = better buying opportunities, not exit signals.
📊 Technical Analysis
Strategy I use:
I analyze HWC (1D), MWC (4H), and LWC (1H).
Entry is based on breakouts in MWC (4H) and confirmation in LWC (1H).
♦️BTC/USDT♦️
• BTC is moving in the 116.2 – 120 range, keeping a bullish structure intact.
• I will not look for shorts as long as 110 holds.
• To keep the bullish scenario alive, we need high volume and sharp candles to break 121 – slow moves won’t work anymore.
• Stop-buy orders near 121 can be used to enter a long if the breakout is strong.
♦️BTC Dominance (BTC.D)♦️
• After a sharp drop last week, BTC.D is now correcting.
• Key level 61.31 was broken.
• The next resistance zones are 62.17 – 62.74 (currently being tested).
• If BTC.D holds above these levels, altcoins could see a bigger drop.
• If BTC.D rejects this zone, alts near breakout points will become our focus with better entry levels.
♦️USDT Dominance (USDT.D)♦️
• Showing signs of forming a bullish structure.
• Next resistance levels: 4.36 – 4.44.
• For a bullish continuation in coins, 4.14 must break down.
• Early but important level: 3.83 – if reached, we must rethink position management.
TOTAL / TOTAL2 / TOTAL3 /♦️ ♦️OTHERS.D
• Currently bearish, but BTC.D and USDT.D will show earlier signs of whether the correction is ending.
• Key levels to watch:
• TOTAL: 3.91
• TOTAL2: 1.55
• TOTAL3: 1.08
• OTHERS.D: 8.05 (a lower high may form if the uptrend resumes).
♦️ETH/BTC♦️
• Key level: 0.02975 (not reached yet).
♦️ETH/USDT♦️
• 3470 is the crucial level to keep the bullish structure.
• Many buyer orders (maker/taker) are stacked here, so the breakout may not be easy.
• Possible fake breakout in this area → could reset the bullish scenario again.
🎯 Conclusion:
The altcoin market correction is not over yet, but BTC & ETH are holding key support zones.
Focus remains on BTC.D and USDT.D.
If BTC breaks 121 with volume and dominance drops, it’s a green light for altcoins.
📣 If this analysis helped you, hit the 🚀, leave a comment 💬, and follow for more updates!

AI called it, Bitcoin listened! Now, will BTC stay the course?My AI saw Bitcoin's path weeks ago, and it's playing out PERFECTLY!
Uptrend, check.
Sideways pause? Check.
This cutting-edge tool is rewriting how we trade.
But now the stage is set for suspense...will it stay the course? Can it continue to defy the odds?
Lets see

BTCUSDT Forming Bullish WaveBTCUSDT is currently forming a bullish wave pattern, signaling a potential continuation of its upward momentum. This technical setup suggests a series of higher highs and higher lows, indicative of strong buyer demand and consistent market optimism. With volume remaining robust, the foundation for a significant breakout is solid. If the pattern plays out, analysts expect a 09% to 10% gain in the mid to long term, which could be fueled by renewed institutional interest and global adoption.
Bitcoin has historically responded well to bullish wave formations, often leading to aggressive rallies once key resistance levels are breached. As the largest cryptocurrency by market cap, BTCUSDT not only reflects investor sentiment in Bitcoin itself but also often sets the tone for the broader crypto market. The current price action shows consolidation with positive volume spikes, which further supports the bullish thesis and provides a potential launchpad for another major leg upward.
With increasing attention on macroeconomic shifts, regulatory developments, and halving cycles, Bitcoin continues to position itself as a hedge against traditional market uncertainties. The bullish wave pattern now forming could signal that Bitcoin is entering a new phase of growth, especially as global interest in decentralized finance, ETFs, and blockchain innovation surges.
Traders and long-term investors alike should closely monitor this structure. A breakout with volume confirmation could offer an excellent entry point, backed by strong technicals and a solid fundamental backdrop. The combination of a bullish pattern and broader adoption trends makes BTCUSDT one of the most watched assets in the market right now.
✅ Show your support by hitting the like button and
✅ Leaving a comment below! (What is You opinion about this Coin)
Your feedback and engagement keep me inspired to share more insightful market analysis with you!

BTC NEW VOLUME TREND 122KThis is a small time frame update, where BTC can try to target 22K again in the coming time frames. Since the last 15H breakdown volume, BTC can enter new uptrend volume
From the box level, there is a good chance for a new uptrend.

A bearish 12 Month candle could be in the cardsBitcoin made an yearly high of 20% after 6 months in on the yearly candle
This does not make me feel great about the rest of the year
a clear sell signal would be an higher timeframe close under 100k after an upthrust to new ath around 110k - 120k
around 50k-54k for me is an good buy level to build an longterm position:
0.382 fib retracement for an primary 1-2 wave
0.500 fib retracement from the 25k low
0.886 fib retracement from 49k low
50% pullback from current high to projected low
where will bitcoin go ? i don't know, but i do know where i want to buy and when i want to sell

BTC Triangle Consolidation: Ready for TakeoffBTC is gearing up for its next move following a triangle consolidation
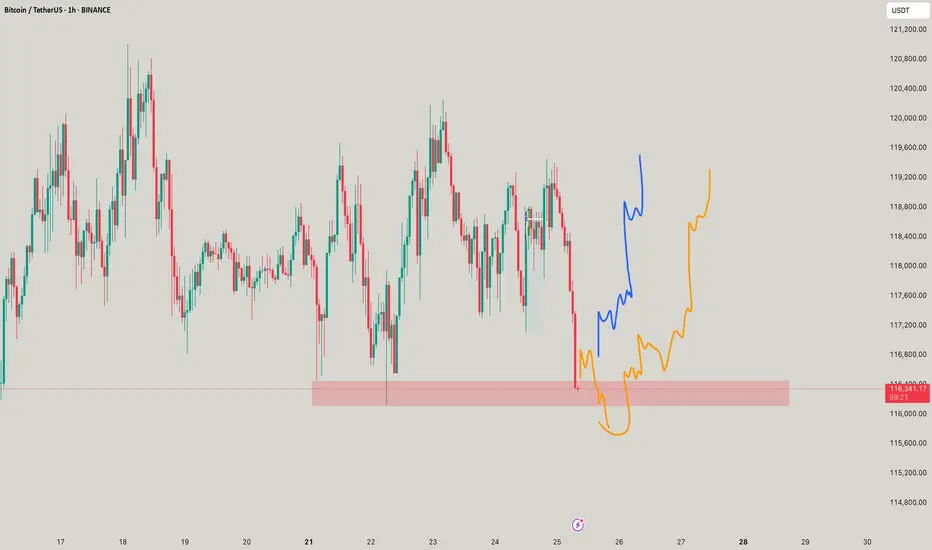
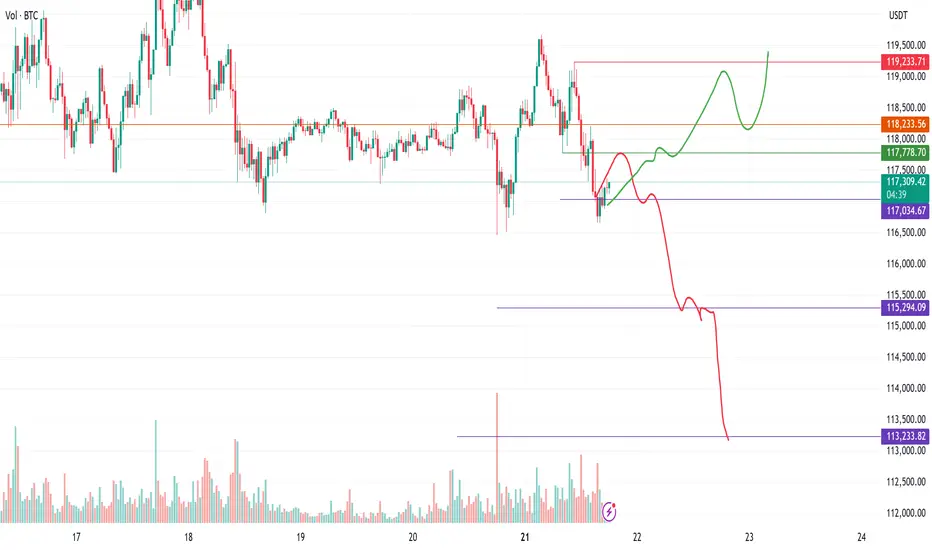
BTC Correction in progress - Can it invalidate? BTC downside pattern triggered on 30 min chart. If it can get back above the green line it will invalidate, though right now the red downside path is looking more likely.
BTC - Long SET-UP BINANCE:BTCUSDT
Bitcoin AMC Pattern Forming?
BTC is showing signs of an AMC-style accumulation after a range-bound consolidation. A clean breakout is possible if price respects the 113k–113.8k support zone — potential entry zone for smart money 📈
Alternatively, deeper liquidity may be tapped at the 110k–112k OB zone, offering another high-probability buy setup🔁
Watch for signs of bullish intent in these key zones — price structure suggests upside potential once liquidity is swept✅

BTC possible failed range breakout - Aggressive Move The BTC ATH rally began post cash close and had very thin volume on the break out before setting this range on the higher time frames. Normally, a range after ATHs are made I would be extremely bullish and I am.
Aside from the failed breakouts at the highs, the attempts paired with nuances such as the crypto week impulses, the day of signing GENIUS and new regulatory acts being drafted now, the attempts to break those ATHs were nudged off.
Sometimes come failed moves come fast moves, and so I have to be prepared that BTC will trade between these thin areas on the volume profile from 111k to 115k. 113k being the most noticeable node in the entire profile.
Similar to my analysis on the break to ATHs, I would expect this move to be aggressive and remind us of a 2020 cycle style flush in Altcoins. Kind of already seeing it with the performance of alts today preempting the failed move up on BTC at range highs.
I will NOT be shorting anything in crypto, these are just areas that I am heavily interested in buying. Currently flat perps and will wait for BTC to make its mind up.