TradeCityPro | Bitcoin Daily Analysis #129👋 Welcome to TradeCity Pro!
Let’s take a look at the Bitcoin analysis and key crypto indices. As usual, in this analysis, I’ll review the futures triggers for the New York session.
⏳ 1-hour timeframe
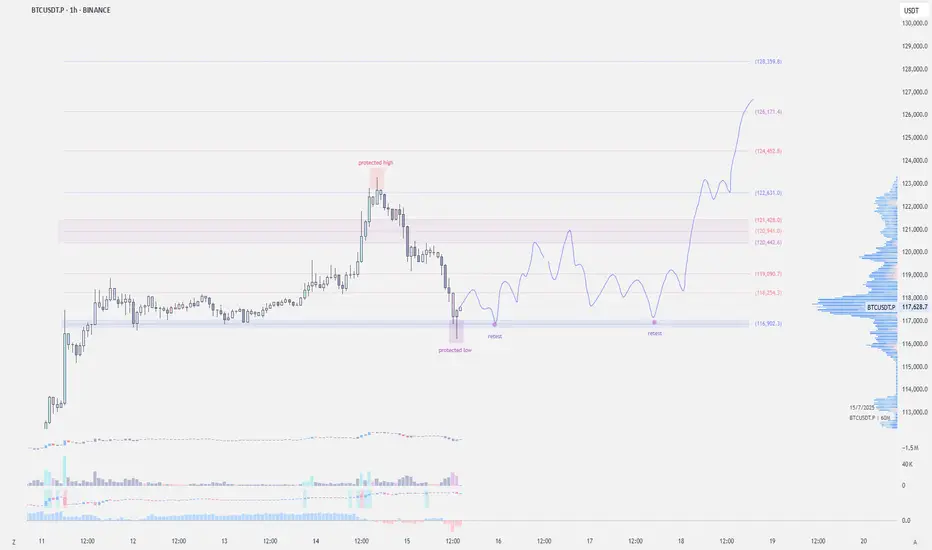
Yesterday, Bitcoin faced a sharp drop after being rejected from the 122733 top and fell down to the 116829 level.
⚡️ Currently, the price has reached an important support area that I’ve marked for you, and at the same time, the RSI has entered the Oversold zone.
✅ Considering the main trend of the market is bullish, this RSI entry into Oversold could be a very good entry point for a long position, as it may indicate the end of the correction.
✨ If the price holds above the 116829 zone, we can enter a long position, and it’s worth opening a position at this level. Further entries can be taken with breakouts of 118494 and 122733.
👑 BTC.D Analysis
Let’s go to Bitcoin dominance. It has continued its downward movement and after breaking 64.44, it’s now moving down toward 64.18.
📊 If this level breaks, we’ll get confirmation of the continuation toward 63.96. In that case, long positions on altcoins would be very suitable.
📅 Total2 Analysis
Total2 is also undergoing a correction like Bitcoin and has settled below the 1.3 level.
⭐ If the correction continues, the next level to watch is 1.26. For long positions, you can enter after breakouts of 1.3 and 1.33.
📅 USDT.D Analysis
Now to Tether Dominance. After bouncing from the 4.22 bottom, it has returned to the box between 4.36 and 4.44.
🔑 If 4.36 breaks, the next bearish leg could start. On the other hand, if 4.44 breaks, we’ll get the first signal of a trend reversal.
BTCUSDT.3S trade ideas

#BTC Update #7 – July 15, 2025#BTC Update #7 – July 15, 2025
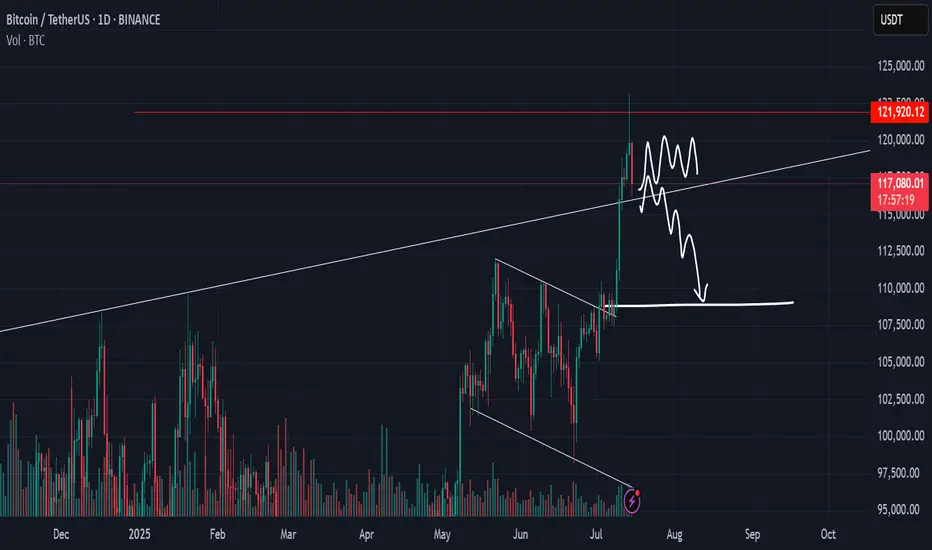
Bitcoin is currently within the consolidation zone where it previously paused during its last upward move. From this zone, it had previously bounced and created a new all-time high. It is now undergoing a correction, and the level it has reached aligns with the 0.382 Fibonacci retracement, which is perfectly normal for a first stop in a correction.
If the correction continues, the second stop could be around $114,795, and the third around $113,012. If it reaches these levels, it will have filled at least half of the imbalance created during the previous rally.
Looking at the volume, I anticipate that Bitcoin might start to bounce from this level. If it manages to break above the $122,666 zone, the next target would be around $127,172.
I do not plan to buy Bitcoin here unless I see a high-volume green candle. However, if Bitcoin breaks above the $118,900 level with strong volume, a long position might be considered, as the target would likely shift toward the $127,000 range.

$BTC FLY TOWARDS 141K$ NEXT?CRYPTOCAP:BTC Bull Flag Target Hit – Eyes on 129K & 134.5K Next! 🔥
Bitcoin has overachieved its bull flag target and is now setting up a textbook Break & Retest of the previous All Time High (~$123K).
📌 Key Levels to Watch:
🔄 Retest Zone: $111K–$113K (previous ATH)
🎯 Next Targets:
$129K (0.12 Fib Extension)
$134.5K (Golden Extension Zone)
📉 Invalidation: Below $104K
Volume remains solid, and structure is bullish — expect a healthy dip & bounce before continuation.
This retest could be the final springboard toward $141K.

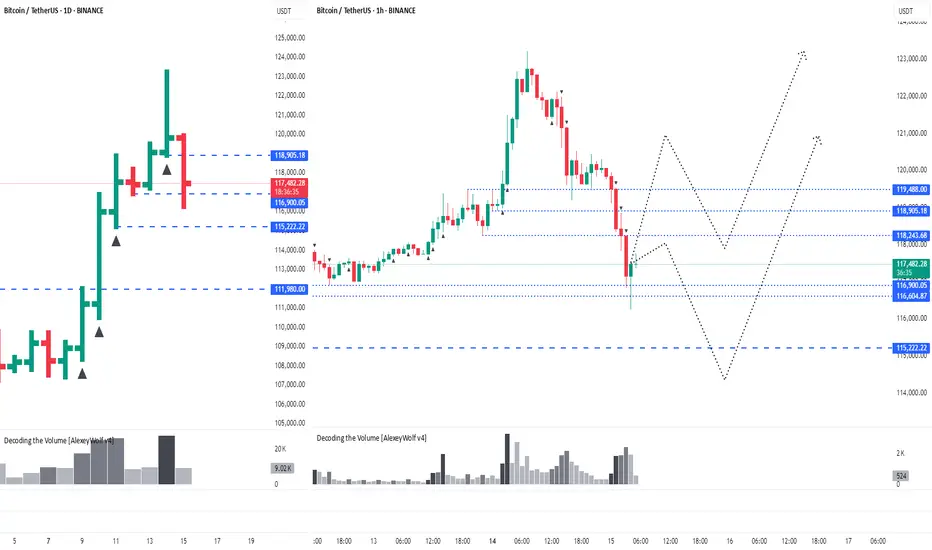
BTCUSDT.P liquidity analysis🟠 CRYPTOCAP:BTC
📄 This analysis is for liquidity and comparing supply and demand ratios
🚨 We start by noting that actual selling pressure began at 121826 and this ratio increased as it dropped below 119723
📄 Any daily close below 117612 will increase this pressure, which is logical after such a rise, specifically in Bitcoin
⭕️ The two closest important levels with liquidity and buying strength are at 114813 and 110623
◀️ The current rebound from 116114 (the lowest point Bitcoin has reached currently at the time of writing this analysis) is insufficient in terms of liquidity and needs more momentum, and attention here should be on the level 117612
📄 The current movement is between 117612 - 114813, the range where Bitcoin stabilized before achieving the historical peak, and thus maintaining this range will provide a boost for a larger rise

Bitcoin’s Wild Ride to New ATHs: What’s Next for Traders?Hello, TradingView warriors! 👋
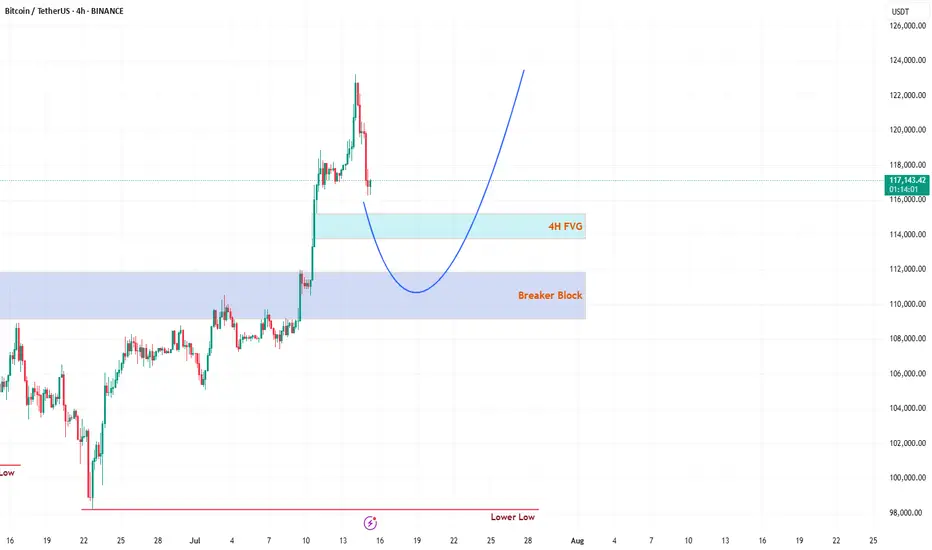
Have you caught Bitcoin (BTC) smashing through a new all-time high (ATH) this Monday? 🎉 If you blinked, you might’ve missed it! But don’t worry, the crypto king isn’t done with its rollercoaster ride just yet. After soaring to new heights, BTC has pulled back for a retracement—not a full-on reversal, so hold your horses! 🐎 Whales are playing their usual games, setting traps for unsuspecting traders. Don’t fall prey to their tricks! 🦈 Let’s break down the key levels to watch and stay one step ahead. 💡
🔍 Key Levels to Watch on the Chart
1️⃣ 4H Fair Value Gap (FVG)
This 4H FVG is a thing of beauty—my personal favorite! 😍 But let’s be real, Bitcoin doesn’t care about aesthetics. This FVG is likely to act as the first resistance level. Here’s the plan:
If respected, expect BTC to use this level as a springboard to catapult back toward the ATH. 🚀
If broken, BTC might slide toward the stronger resistance below. Keep your eyes peeled for how price reacts here! 👀
2️⃣ Daily Breaker Block (PD Array)
This is the big one—a rock-solid resistance zone on the daily timeframe. I’m leaning toward BTC dipping into this Breaker Block to clear out liquidity before making its next big move to retest the ATH. 🏦 This level is a magnet for price action, so don’t sleep on it! 😴
🛠️ Trading Strategy: Stay Sharp!
Patience is your best friend right now, traders. 🙏 Don’t rush into trades without confirmation. Watch how BTC interacts with these two levels:
4H FVG: Look for rejection or a breakout to gauge short-term direction.
Daily Breaker Block: If price dips here, it’s likely hunting liquidity before the next leg up.
Wait for clear price action before jumping in—let the market show its hand! 🃏 Stay disciplined, avoid the whale traps, and let’s ride this BTC wave together. 🌊
📚 Want More? Follow Me!
If you’re hungry for more technical analysis insights and market updates, hit that follow button! 📈 I share tips, tricks, and breakdowns to help you navigate the markets like a pro. Let’s level up your trading game together! 💪
What’s your take on BTC’s next move? Drop your thoughts below, and let’s discuss! 💬 Happy trading, and may the profits be with you! 📈
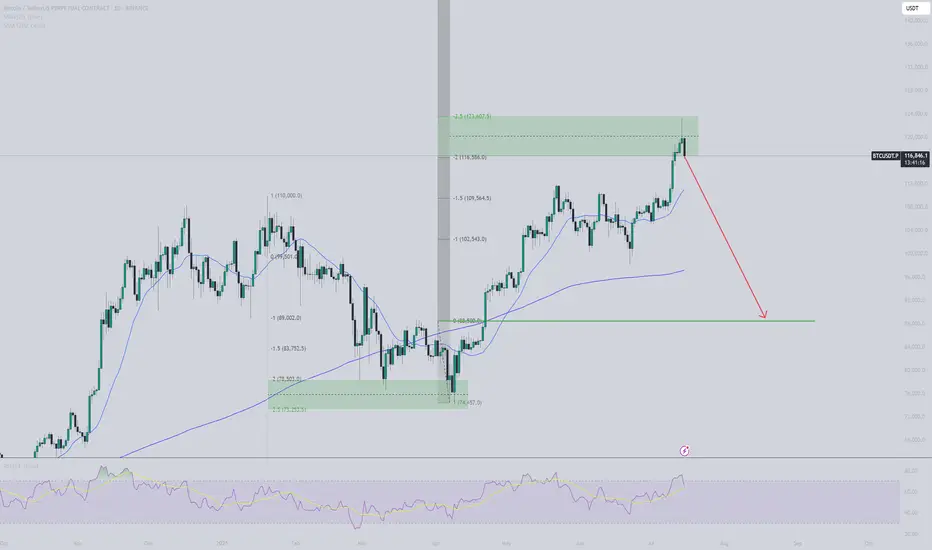
BTC retracement comingBTC seems to follow the 2-2,5 stdv price structure. Based on simply stdv from last manipulation leg down it suggests we are now at reversal zone, and I expect price to retrace down. First reaction seems to support this plan. Aiming at $88,5K.
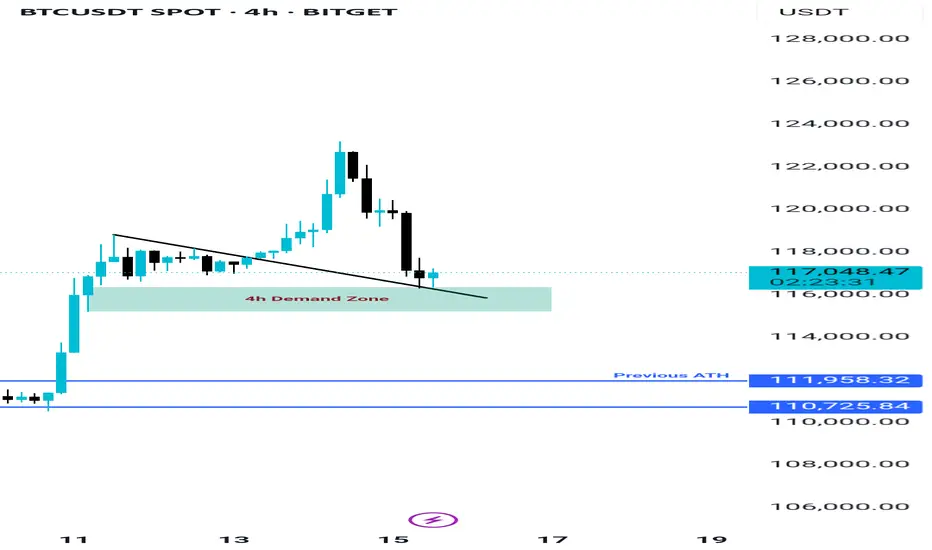
BTC still Holding the Demand Zone, Bitcoin is currently holding the demand zone between $116K and $117K, which also aligns with the retest area of a previously broken trendline—making this zone quite strong. If BTC manages to close above $117.8K on lower timeframes, we could see the beginning of a new uptrend targeting around $130K. However, if this zone fails due to any unexpected news or events, the next key support lies between $111K and $113K.

Bitcoin (BTC): Current Neckline Zone is Crucial | Bounce Coming?After a recent push to a new ATH area, the price has cooled down, which led the price back to the local neckline zone, which is our next important zone.
This correction cooled down the Bollinger Bands Channel and RSI, which would mean we are just one MSB (on smaller timeframes) away from another rally towards the upper zones.
Now if for any reason we fall more, then this might turn into a nasty movement, as our target would be then around $110K, where we would be looking for another buy entry (if we fail to get that MSB we are currently looking for).
Swallow Academy

BTC BIG SHORT!We did a mirror retest, and many other signals also point to a sharp decline, indicating numerological codes 69/96.

$BTC All Eyes on the FVG Zone. CRYPTOCAP:BTC broke out above key resistance and is now retesting the FVG zone near $112K–$115K.
Holding this level could trigger a fresh rally toward $127K–$132K.
DYRO, NFA

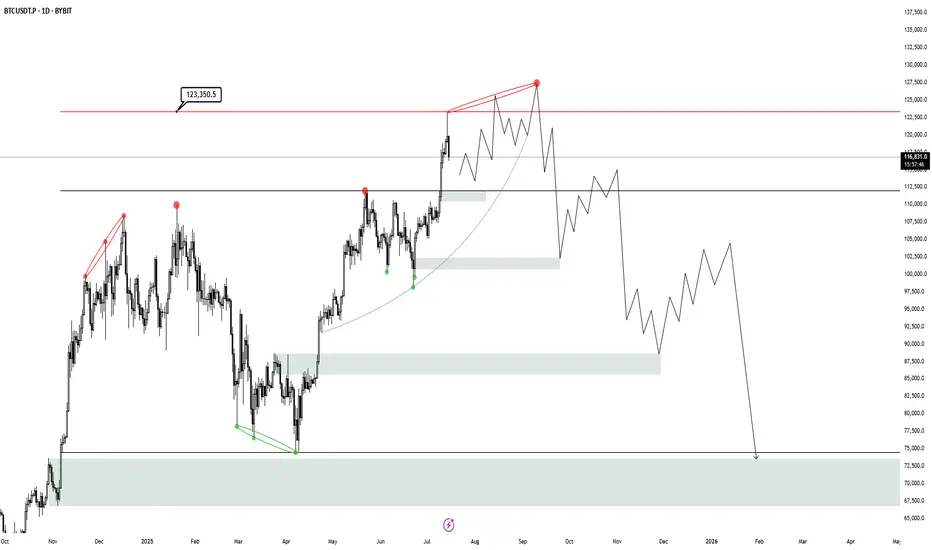
BTC HTF Distribution V3This is my new outlook for BTC if this 250 day old range is intended to be a HTF Distribution Model 1, which has neither been confirmed nor invalidated. A weekly close above 123.350$ will invalidate this model and likely lead to higher prices. Yesterday we had a perfect rejection from the deviation limit, which now probably creates a new range, that then will either reaccumulate or distribute.
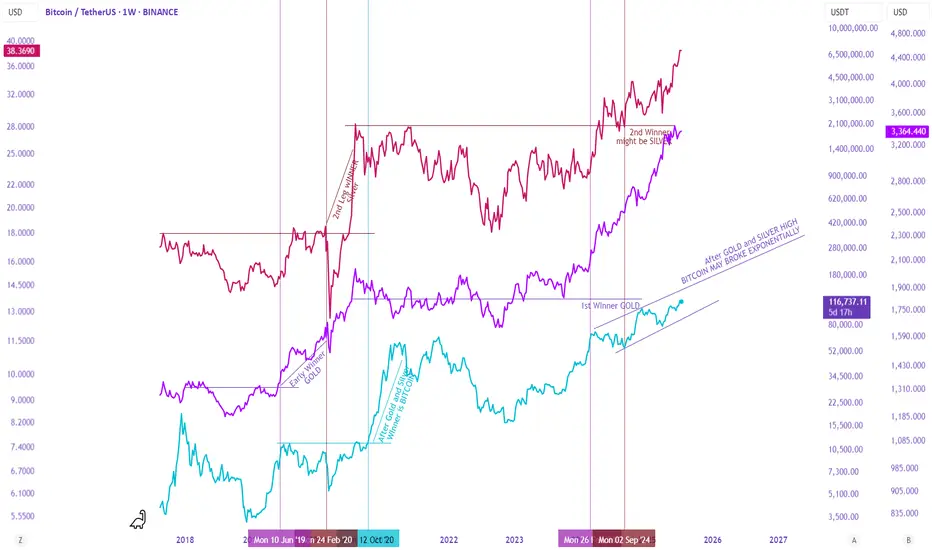
Gold, Silver, and Bitcoin – A Staggered Anti-Currency Rotation?There seems to be a complex yet recurring relationship between Gold, Silver, and Bitcoin during anti-currency phases (when fiat weakens).
First Leg – Gold Leads
Gold typically leads the first leg, breaking out to new highs. Silver follows but lags—trending up without breaking major resistance. During this phase, the Gold/Silver ratio expands.
Second Leg – Silver Takes Over
Eventually, Silver breaks resistance and becomes the second leg leader. As it outperforms Gold, the Gold/Silver ratio contracts back to mean.
Bitcoin, during this time, is usually bottoming or entering Stage 2 (early uptrend). This time, it has already broken resistance but is rising slower than in past cycles.
Third Leg – Bitcoin Dominates
As Gold and Silver peak and begin to correct, Bitcoin accelerates, often making new all-time highs (ATH).
This staggered rotation played out during the 2018–2022 cycle. Let's see if history rhymes in this cycle.
It stopped (resisted) where the AI said it would! Very Exciting!Witness the precision: Price hit resistance exactly as predicted by AI analysis. Thrilling confirmation of my AI tech-driven trading insights!

BITCOIN LONG TRADEBTC had a large flush after its ATH of 123.1k causing most late longs to get wiped out. It seems fear has been overestimated and we should see a reversal soon. We're also near major support on the 4h and have an oversold StochRSI. CPI numbers are coming out today so make sure you're managing risk accordingly and only invest what you can afford to lose.

What i see, still normalBTC has now found resistance at the mid trendline, once this flips support we look for massive uptrend

Bitcoin in New Ascending channel wait for 160K$As we can see Price broke previous ATH & channel resistance together and is holding strong, if it continue soon new channel is path to claim for Price based on chart and targets like 160K is just easy to hit.
So get Ready for new Highs and ATH here also this breakout to upside was mentioned in previous analysis and now that it is happening don't get surprise if you see notifications like Bitcoin new ATH 150K$.
DISCLAIMER: ((trade based on your own decision))
<<press like👍 if you enjoy💚


Bitcoin, its time to short full leverage ?this idea still great
now bitcoin ranging or auto dump ?
short full leverage when retesting on resisten is great
BTCUSDTmy entry on this trade idea is taken from a point of interest below an inducement (X).. I extended my stoploss area to cover for the whole swing as price can target the liquidity there before going as I anticipate.. just a trade idea, not financial advise
Entry; $113312.6
Take Profit; $117985.3
Stop Loss; $112314.0

BTCUSDT. Current scenario range Current scenario range — can shift depending on how the market reacts next.
This analysis is based on the Initiative Analysis concept (IA).
Wishing you profitable trades!
$BTC - LTF OutlookCRYPTOCAP:BTC | 1h
We're establishing a new value area here
Looking at a potential ltf setup:
If 116.5k holds as base support, targeting a move toward 120.5k–121.4k (immediate supply zone)
Similar to past price action, we might see a few pushes before breaking through ltf supply.