BTC/USDT Long Position Plan🔥 BTC/USDT LONG IDEA (4H CHART)
Published by: Ali15349323
Timeframe: 4H
Exchange: Bybit Spot
Date: July 15, 2025
📊 Analysis Summary:
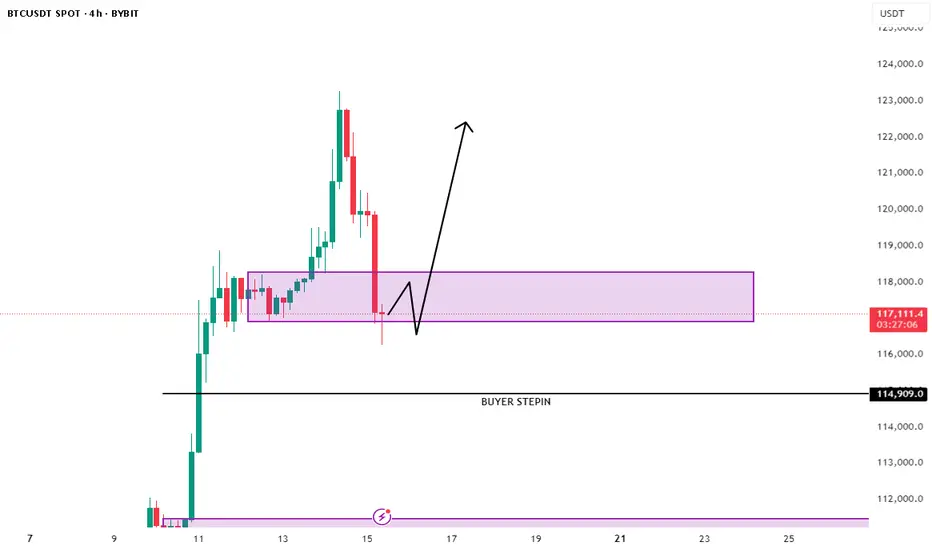
Bitcoin is pulling back after a strong impulsive move upward. Price has now entered a key 4H demand zone between 116,200 – 117,300, which previously acted as a consolidation base before the breakout.
We are now watching for a potential long entry in this zone, with a bounce confirmation and invalidation criteria clearly defined.
📌 Trade Plan (Long Setup)
Entry Zone:
🔹 116,200 – 117,300 USDT
🔹 Price is currently reacting within this support range
Stop Loss (Invalidation):
🔹 Below 114,900 USDT
🔹 A 4H candle close below this level would break structure and invalidate the setup
Take Profit Targets:
🔹 TP1: 121,000 – Local resistance
🔹 TP2: 123,000 – 124,000 – Imbalance fill zone
🔹 TP3 (Optional): 125,500+ – If momentum continues
🧠 Reasoning Behind the Trade:
✅ Strong demand zone with historical reaction
✅ Wick rejection from the lower boundary, showing early buyer interest
✅ Price structure still bullish unless 114.9k breaks
✅ Previous sell-off likely triggered liquidation — now a chance for recovery bounce
⚠️ Invalidation Criteria:
❌ A 4H candle close below 114,900 signals demand has failed
❌ In this case, the setup is no longer valid — next demand sits around 111k – 112k
🧾 Summary:
We’re looking for a bullish continuation if BTC holds above the current demand zone. A sweep-and-reclaim structure could give confirmation. If the zone fails, no trade — we step aside and wait for deeper support.
📣 Don’t forget to:
🔁 Like & Share
🧠 Follow me @Ali15349323 on X for more trades
#BTC #Bitcoin #Crypto #LongSetup #TechnicalAnalysis #TradingView
BTCUSDT.3S trade ideas
Bitcoin Rush: The Carnival and Concerns Behind $120,000Bitcoin Rush: The Carnival and Concerns Behind $120,000
The Bitcoin market is staging an epic rally - the price has broken through the $120,000 mark, setting a new record high. But behind this jubilation, the market has shown signs of overheating.
Market Status: Risks Hidden in the Frenzy
Price Performance: Hit a new high of $123,000 on July 15, up nearly 20% this year, with a total market value of $2.2 trillion (the fifth largest asset in the world)
Market Sentiment: Fear and Greed Index 72 (extreme greed), but more than 100,000 people were liquidated in 24 hours, with a loss of $510 million
Technical Signals: RSI reached 70.9 (overbought zone), and the 30-day unrealized profit and loss ratio reached the 80% percentile
Three major rising engines
Institutional entry
Spot Bitcoin ETF net inflow of $118 million in a single day (BlackRock holds more than 700,000 coins)
MicroStra Tegy's holdings value exceeds $50 billion
Trump Media Group and other listed companies join the "coin hoarding trend"
Regulatory support
The U.S. "Cryptocurrency Week" deliberates on three key bills
Hong Kong passes the "Stablecoin Ordinance" (effective on August 1)
The EU MiCA framework begins to be implemented
Macro support
The probability of the Fed's September rate cut is 72.3%
The weakening of the U.S. dollar + trade protection policies boost risk aversion demand
Bitcoin's positioning shifts from "speculative assets" to "digital gold"
Key technical signals
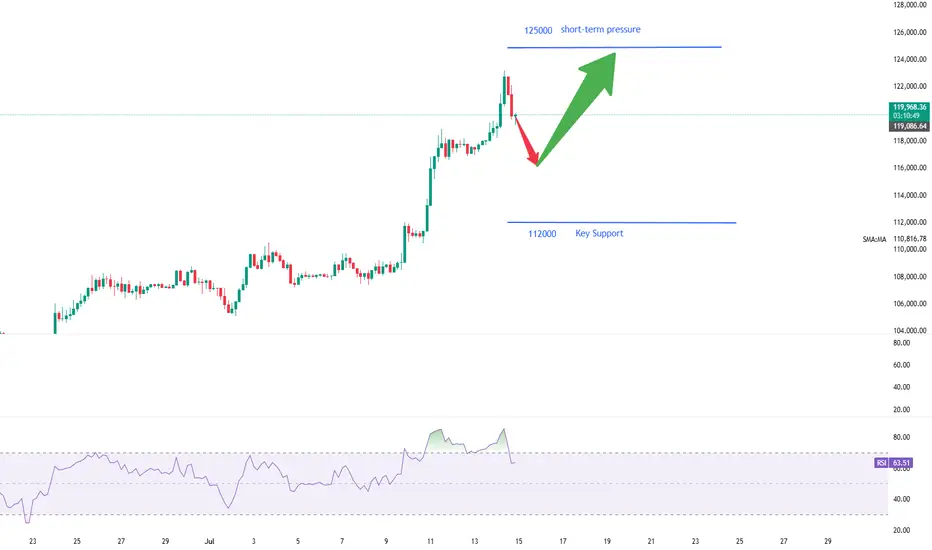
Breakthrough pattern: daily "three white soldiers" candle + ascending triangle breakthrough, target 128,000-132,000 U.S. dollars Yuan
Key position:
Support: $116,800 (near term), $112,000 (key)
Resistance: $121,500 (short term), $140,000 (long term)
Risk signal: H4 chart RSI reaches 77, MACD histogram shrinks
Future outlook
Short term: If the $112,000 support is maintained, it is expected to challenge $140,000
Risk: Falling below $108,500 may trigger a chain of liquidations
Cycle law: Referring to "peaking 550 days after halving", this round of bull market may peak in October
Breakout trading strategy (suitable for aggressive traders )
Entry conditions:
Price stabilizes above $123,000 with increased trading volume (at least 1.5 times the 20-day average volume)
4-hour chart closes above the previous high for three consecutive positive lines
Targets:
First target $128,000 (1.618 Fibonacci extension level)
Second target $135,000 (psychological barrier + upper channel track)
Stop loss setting:
Day trading: Falling below the $120,000 round mark
Swing trading: Falling below the $116,800 support platform
Conclusion: Bitcoin is writing a new chapter in history, but investors need to be wary of "extreme joy leads to sorrow". Remember: when others are fearful, I am greedy, and when others are greedy, I am fearful - this old saying always applies to the crypto market.


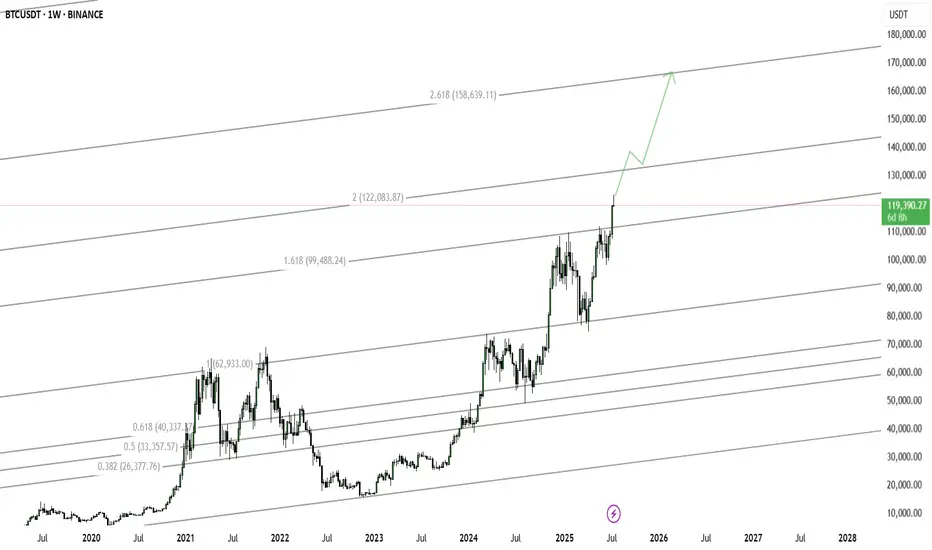
Cycle Top Theory: BTC 2025–2028 : The ₿ Line BreakoutCycle Top Theory: BTC 2025–2028" explores the probabilistic path of Bitcoin through the remainder of the current bull cycle. Combining historical market structure, halving-driven supply shocks, and volatility-based modeling, this thesis outlines potential top scenarios ranging from $xxxK to $xxxK.

BTC bullish sentiment and All time highs?BTC is printing a good structure and characteristics resembling the highs of 2021. 2025 is the only bullish year left before BTC crashes again.
Usually BTC is bullish in the end of the year. This OCT/NOV could print 130K-136k for btc before a fatal crash

BTC Short Bitcoin needs a little correction from here for a healthy pump , I am in short postion now

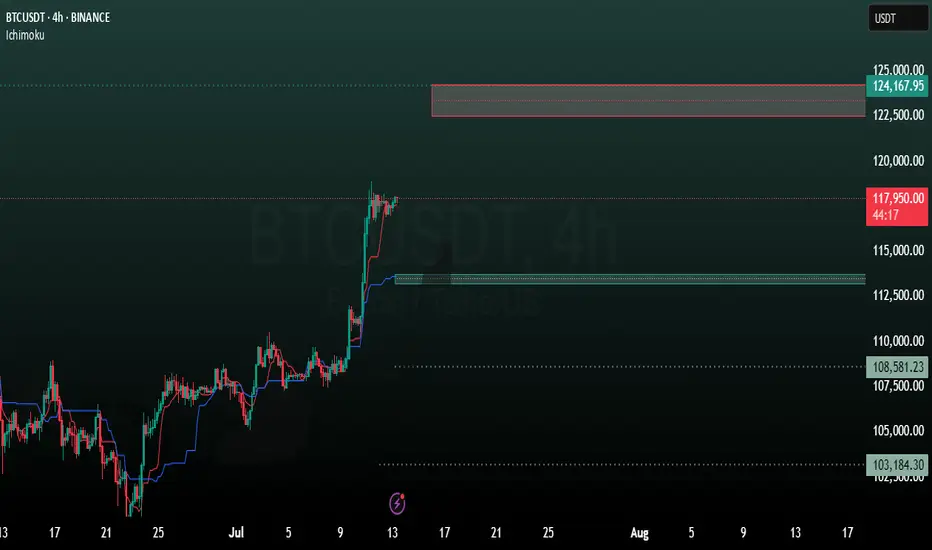
BTC 4H analysisBased on our previous analysis, BTC trend is still bullish. It reacts to our mentioned support level (98699) and moving to new resistance levels.
ICHIMOKU shows these levels as resistance:
122500
124000
137000
And these as support:
113788
113181
108581
BTC — Long from Support Box (#4h) | BULLISH1. Buy: Limit order 115.5k–116.6k
2. Alert: If close < 113k, scenario invalid
3. Target: 125k

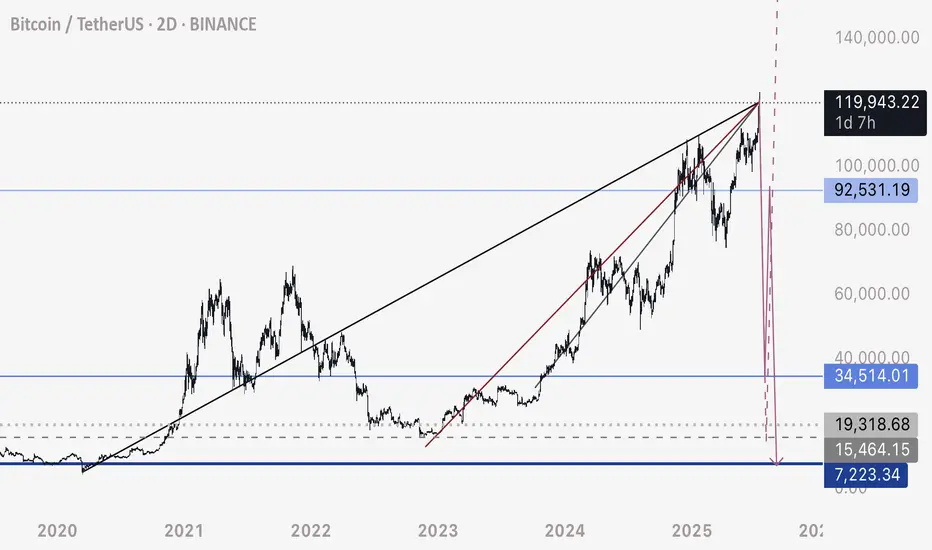
BTC - Last Attempt at Predicting TopThis is my last attempt at predicting the top of this upwards move on the HTF.
Adjusting these trendlines to where BTC pumped to, which was a lot higher than initially anticipated, it does look to me that these trendlines are still respected.
There are 3 bearish ascending lines that price has been interacting with - I assume we are looking at a crossing intersection of them, per the chart here.
If BTC continues higher without a very fast, drastic free fall - I will be looking at other possibilities. If price moves above 122,000 again, I would consider this invalid - as I suspect the resistance level sits around 120,000 to 120,500 area.
I will be looking for a very fast drop to consider this possibility as valid and likely from here on.
BTC-----Buy around 121100, target 121800 areaTechnical analysis of BTC contract on July 14:
Today, the large-cycle daily level closed with a small positive line yesterday, the K-line pattern continued to rise, the price was above the moving average, and the attached indicator was running in a golden cross. The overall trend is still very obvious, and it can be seen from the overall trend that the retracement is very small. After the shock correction in the two trading days over the weekend, it rose strongly again during the day and broke through the previous high position, so we keep the main idea of buying on retracement in trading; the short-cycle hourly chart intraday price broke upward, the starting point was 118880 area, the current price is consolidating at a high level, the K-line pattern continued to rise, and the attached indicator was running in a golden cross. If we look at the continuation of the high closing today, two conditions must be met: the European market price broke through the intraday high; the retracement cannot break the starting point, otherwise it will be difficult to fall.
Today's BTC short-term contract trading strategy:
Trade in the 121100 area when retracement, stop loss in the 120500 area, and the target is the 121800 area;

Analysis of the Latest Bitcoin Market。On July 14, Bitcoin's price surged sharply, with the highest level reaching $123,100. This breakthrough ended its eight-month-long consolidation phase within the $90,000 - $110,000 range.
The U.S. House of Representatives designated the week of July 14 as "Crypto Week" and plans to deliberate on a number of key bills. Among them, the Guiding and Establishing America's Stablecoin National Innovation Act aims to formulate federal regulations for stablecoins and is regarded as a "landmark legislation" in the cryptocurrency sector. The market expects the cryptocurrency industry to usher in policy dividends.
Market analysts are relatively optimistic about Bitcoin's prospects. The $125,000 level is seen as the next key psychological threshold, and a breakthrough above it would open up greater upside potential. Standard Chartered Bank predicts that Bitcoin will challenge $200,000 by the end of the year. Although the Relative Strength Index (RSI) is at a high level, there is no obvious overbought signal. The moving average system is clearly aligned, and the support level has moved up to $112,000. The market consensus holds that "any pullback represents a buying opportunity."
you are currently struggling with losses,or are unsure which of the numerous trading strategies to follow,You have the option to join our VIP program. I will assist you and provide you with accurate trading signals, enabling you to navigate the financial markets with greater confidence and potentially achieve optimal trading results.
How many bag holders will BTC leave behind?We've had our fun and some fake pumping from the short squeeze. No comes the real stuff! What are the fundamentals and what problem is BTC trying to solve? Ok, crickets. It's a speculative asset, that's it. If history repeats itself, which it typically does, we will see a major pull back and anyone who's bought at the top will have a negative performing portfolio. It's too expensive and you still can't buy a banana with BTC and there are plenty of middlemen involved, which goes 100% against it's original purpose (after the financial crisis).
If you're up, this would be a good time to sell IMHO and buy at the next support level, which is way below 100k.

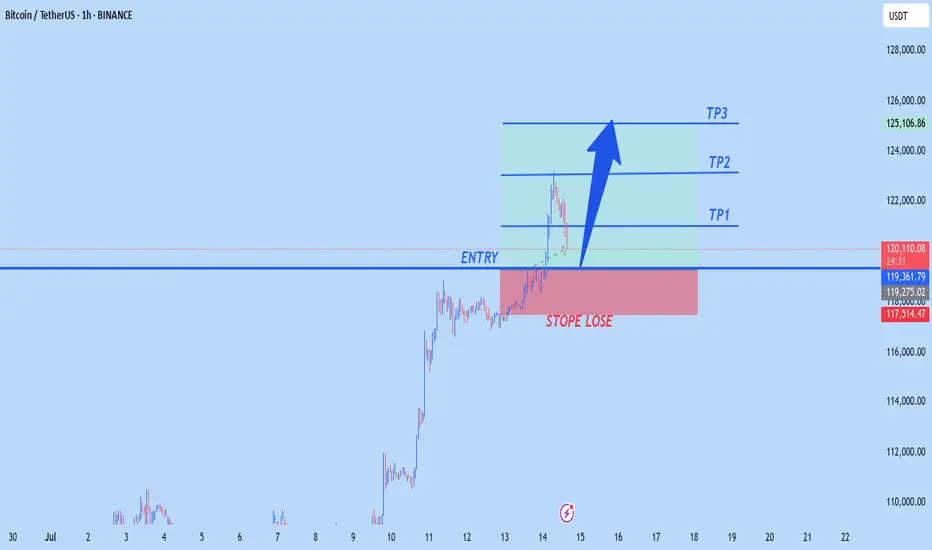
BTCUSD NEW OUTLOOKBtc buy from 119,000
TP1 122,000
Tp2 123,000
Tp3 125,000
STOPE LOSE 117,500
Trade at your own risk
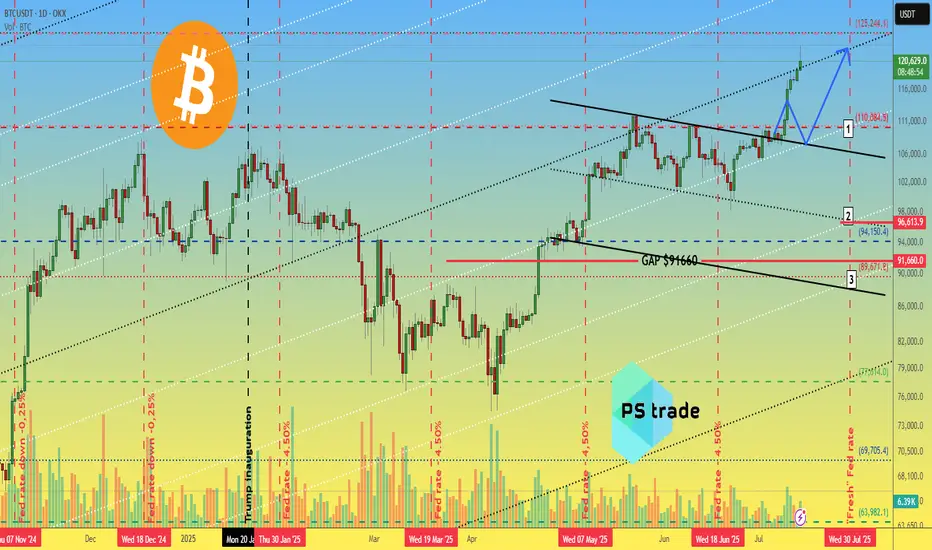
Bitcoin BTC price analysis📈 Two weeks have passed since the previous analysis of the OKX:BTCUSDT chart, and the market has decided to go with the 1️⃣ scenario.
Less than 3% remains to reach $125,000, and the price could easily get there by inertia, but that's a minor detail.
CRYPTOCAP:BTC is updating its ATH, and total liquidations on the crypto market over the past 24 hours are “only” $750 million, of which almost $450 million is accounted for by #Bitcoin.
Weak, very weak... Previously, longs were liquidated for $2+ billion, and it was reported that the actual amount of liquidations was significantly higher due to the fact that the exchanges' data was not fully disclosed. (For the sake of objectivity, at that time, the lion's share of liquidations was accounted for by altcoins, but now this is not the case).
◆ During this time, Trump introduced new tariffs — the market was “on a roll” — it swallowed it and didn't even notice the news.
◆ Tomorrow, July 15, the US CPI will be announced — the forecast is for inflation to rise from 2.4% to 2.6% (although there are rumors that the situation in the US economy is much worse and this may "come to light" tomorrow).
◆ July 16 - PII announcement - these indicators may act as a “cold shower” to bring the market out of its euphoria.
◆ From July 14 to July 18, the US Congress is considering three key crypto laws, including the GENIUS Act. Major players consider this a powerful driver. Perhaps the current growth has already “played out” and priced in expectations for news.
🪐 And this trading week will end on 18.07 with the start of Mercury retrograde, even the US Congress is postponing all important matters, and you still don't believe in it ))
🖐 Long positions are certainly beneficial, appropriate, and in line with the trend at present, but it is advisable to hedge them with stops, because as mentioned above: the price is rising, and there are few liquidations. During the previous decline in the cryptocurrency market, there were significantly more liquidations of long positions, and they may wish to repeat this.
And with the #BTCUSD price correction, there will be a fixation: some will have profits, and some will have losses in stablecoins, which would then be logical to reinvest as capital in altcoins. First in something more voluminous and less risky, and in the last stage, they will pump everything in a row)
But until then, we still need to survive and preserve our deposits.
So, in your opinion: correction to one of the levels:
1️⃣-$110k 2️⃣-$97k 3️⃣-$90k
or
is everything written above complete nonsense, and the market growth has only just begun to “take off”?
Bitcoin Go 130k Now you just have to take a long position and the whole market will be pumped.
Bitcoin 130k __134k

$BTC RISING WEDGE ~ {LONG TERM VIEW}I don't feel like writing, everything is clear. Bitcoin is bullish right now, but keep an eye on this pattern.

Top Altcoins Choice —Your Pick · Bitcoin Hits New All-Time HighBitcoin is once again trading at a new all-time high and as this happens the altcoins go boom.
The first instance circled around the fact that Bitcoin was strong and range trading between $100,000 and $110,000. When Bitcoin goes sideways within a bull market, the altcoins tend to blow up, and blow up they need. Now, when Bitcoin moves to hit a new all-time high and keeps growing; the 2025 Cryptocurrency bull market is fully confirmed.
» Which one is your favorite altcoin trading pair?
» Which project you think will grow the most in 2025 & 2026?
» What is your TOP ALTCOIN CHOICE?
Top Altcoins Choice —Your Pick
Leave a comment with some of your favorite altcoins pairs, the ones you like most and I will do a full analysis for you. I will publish in my profile and also answer directly in the comments section. I will pick and choose.
If you see other commentators that have a pair that you like, make sure to boost their comment and reply. The more boosts a comments gets, higher priority will be given to the project and trading pair.
Boost this publication and leave a comment, let's get started with your TOP ALTCOINS CHOICE!
Namaste.

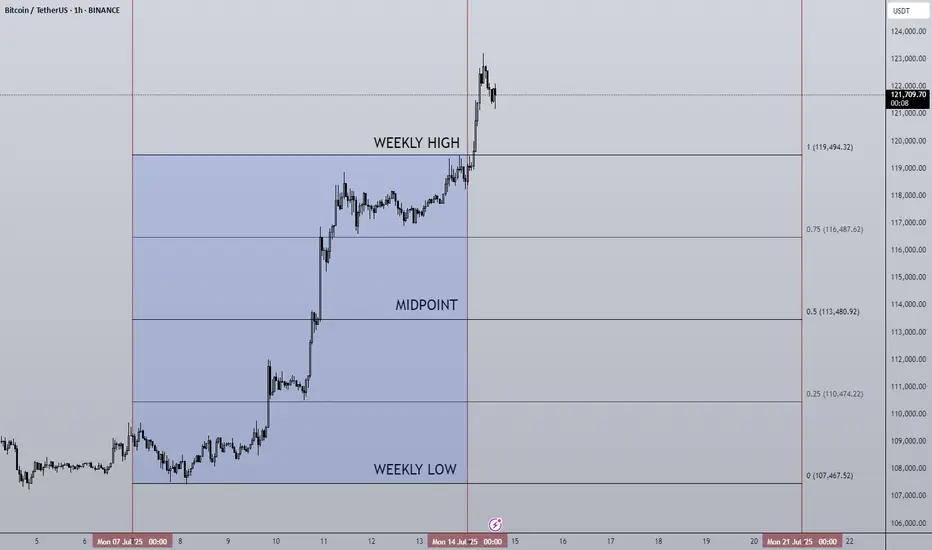
14/07/25 Weekly OutlookLast weeks high: $119,494.32
Last weeks low: $107,467.52
Midpoint: $113,480.92
NEW BTC ATH!
This is what we've all been waiting for, BTC breaks through resistance at $110,000-112,000 to set a the highest weekly close ever ($119,086). Thanks to a further $2.27B net inflows via BTC ETFs, the passing of the "big beautiful bill" flipping from a more deficit reduction stance by the US to an environment perfectly suited to risk on assets. Things are looking good for Bitcoin.
This week already in the Asia session BTC has broken above the weekly high to hit $123,100. Despite this incredible rally BTC.D has been falling since Thursday of last week. To me this signals altcoins have started to play catch up and we've seen that with ETH breaking $3000 (+14% relative to BTC).
I would like to see BTC consolidating here above the weekly high while altcoin majors break their choppy rangebound environments and shift to a trending environment just as BTC had last week.
There are also major data releases this week:
Tuesday CPI
Wednesday PPI
Thursday Euro CPI
Thursday US Initial Jobless Claims
I do not expect these data releases to have a major effect on the markets in their current state due to the risk appetite we've seen in both crypto and equities, such shallow pullbacks prove the demand is there to absorb and sell-side pressure for now.
Now is an excellent time to back strong projects with great fundamentals that are breaking out from downtrends/ranges in both their USD & BTC pairs, as BTC.D drops alts can print some great returns. Beta plays of ETH & SOL can offer higher returns than the majors themselves in these market conditions too.
Good luck this week everybody!
Weekly trading plan for BitcoinBINANCE:BTCUSDT has currently set a new ATH, trading in the 121k-122k range. While no clear reversal signals are present yet, we're seeing early signs of a 4h RSI divergence. Without solid confirmation, short positions remain risky - price could liquidate shorts multiple times before any meaningful reversal. Key local level to watch is 119k
Trade safe and stay adaptive

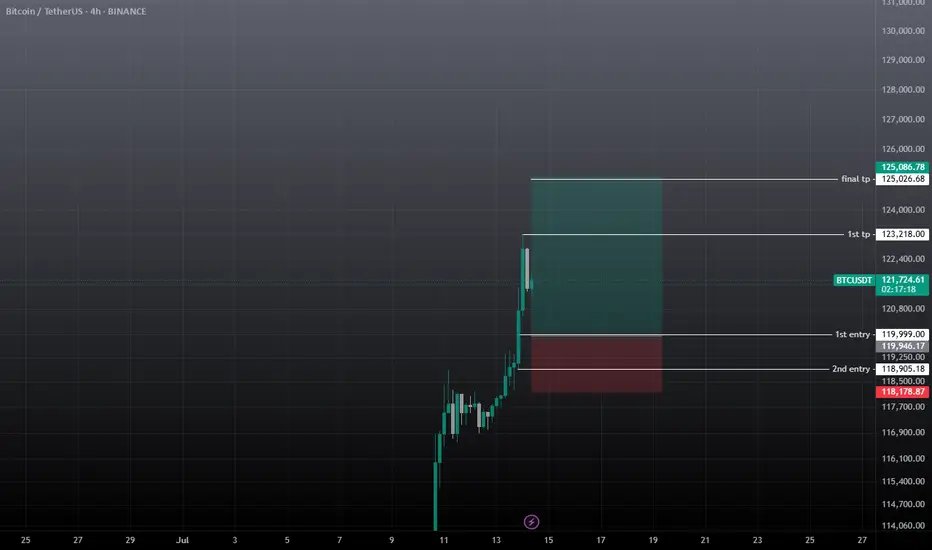
BTC BUY / LONG SCALP TRADEWait for the entry to be filled, must use SL and don't use high margin on any trade. If TPs achieved first then ignore the trade.

btcusdt buy / long scalp setupWait for the entry and must use sl on all trades, if tp achieves first then ignore it.