HOW-TO: Auto Harmonic Screener - UltimateXHello Everyone,
In this video, we have discussed on how to use our new Auto Harmonic Screener - UltimateX. We have covered the following topics.
Difference between Auto Harmonic Screener - UltimateX (Current script) and Auto Harmonic Pattern - UltimateX and how to use both the scripts together
Difference between Auto Harmonic Screener - UltimateX (Current script) and the existing screener Auto Harmonic Pattern - Screener which is built on request.security calls. We have discussed how the limitations of old script and how using the new script with Pine screener utility will help overcome those problems.
We have gone through the indicator settings (which are almost similar to that of Auto Harmonic Pattern UltimateX
Short demo on how to use the script with Pine Screener
Also check our existing video on How to use the new Pine Screener Utility.
BTCUSDT.3S trade ideas

BTCUSDT – Diametric G-Leg Underway?⏱ Timeframe: 4H / 1H
🔍 Method: NeoWave + Smart Money Concepts (SMC)
📍Posted by: CryptoPilot
⸻
🧠 NeoWave Progression Update
As outlined in our previous analysis, we are tracking a potential Contracting Diametric structure (A–G) originating from the March 2025 highs.
🚨 The G-Leg may now be actively unfolding.
Here’s what just happened:
• Price rejected sharply from the supply zone near 119,000–119,500, exactly where Wave F was expected to end.
• After a drop to 115,780 (minor trendline), price bounced, but failed to make a new high, stalling at 118,700, forming a lower high → classic signature of a developing G-Leg.
• This G-wave likely aims to break below Wave E low, seeking imbalance fills and structural resets.
⸻
📊 Smart Money Confluence (SMC / ICT)
• 🟥 Bearish Market Structure confirmed via MSS on 1H: Lower Highs + Internal BOS
• 🟨 Buy-side Liquidity above 120k was already swept
• 🔻 Price failed to reclaim OB block around 119.5k
• 🧩 FVGs remain open between 114.5k–113k, acting as magnet zones
• 📉 Expectation: Price may now break the ascending minor trendline and accelerate toward the major structure low
📌 Primary Scenario:
• Wave G of Diametric in motion
• Potential structure: Zigzag or Complex Combination
• Expectation: Bearish continuation to break below 113k
📌 Alternative Scenario:
• If price closes above 120.5k, diametric structure may be invalidated
• Watch for triangle/flat development instead
⸻
⚠️ Risk Management Note:
Price action near 118.7k–119.5k is crucial. Reclaiming that zone with strength changes the bias. Until then, sellers remain in control.
💬 Final Thought:
We’re tracking the final stages of a multi-month complex correction. The rejection at supply, combined with SMC signals and NeoWave symmetry, suggests sellers may push price into deeper demand zones soon.
⸻
📌 Follow CryptoPilot for advanced wave structure updates, market geometry insights, and ICT-style smart money traps.
💬 Share your views or alternate wave counts in the comments!


Bitcoin Weekly Recap & Gameplan | 27.07.2025📈 Market Context:
Bitcoin maintained its bullish momentum, driven by continued institutional demand and a supportive U.S. policy backdrop.
Last week’s gameplan played out well — solid profits were captured (see linked chart below).
🧾 Weekly Recap:
• Price made a bullish retracement into the Weekly FVG (purple line) exactly as projected in last week's post.
• From here, I expect continuation toward new all-time highs.
📌 Technical Outlook:
→ First, I expect a short retracement and a 4H swing liquidity grab at 117,828$.
→ Then, a strong continuation move toward ATH targets.
🎯 Setup Trigger:
Watch for:
✅ 4H liquidity sweep
✅ 15M–30M bullish break of structure (BOS)
This is the confirmation zone for potential long setups.
📋 Trade Management:
• Stoploss: Below confirmation swing low
• Targets:
– 120,938$
– 123,400$
💬 Like, follow, and drop a comment if this outlook helped — and stay tuned for more setups each week!

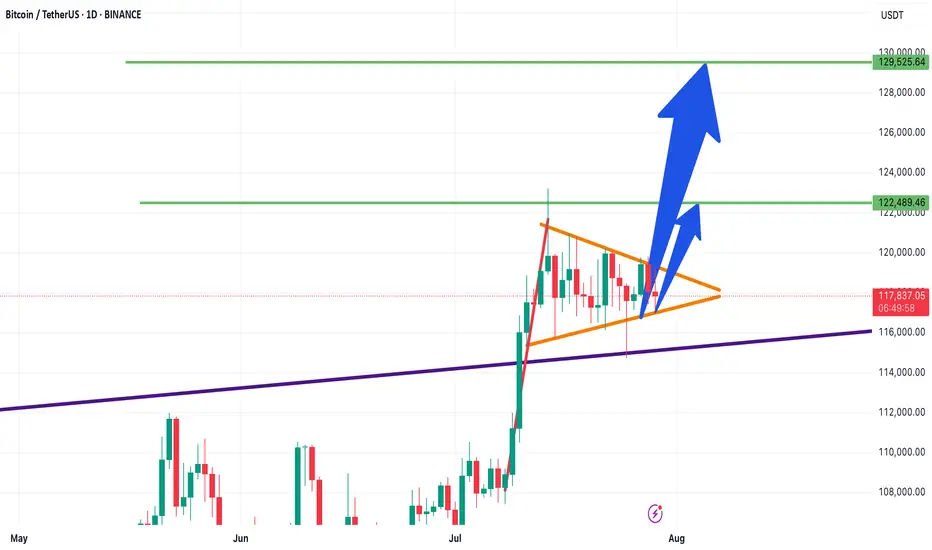
Bitcoin Technical Analysis – Bullish Flag- Symmetrical Triangle📊 Bitcoin Technical Analysis – Bullish Flag or Symmetrical Triangle?
📅 Analysis Date: July 29, 2025
As shown in the chart, Bitcoin appears to be forming a bullish flag or symmetrical triangle pattern—often seen after strong upward moves.
🔹 Bullish Scenario:
If the price breaks above the triangle, the first target is around $122,480, followed by a potential second target near $129,500, based on the length of the flagpole.
🔹 Bearish Scenario:
If the triangle breaks to the downside, the first support to watch is $115,230.
🧭 These key levels act as critical zones of supply and demand, so be sure to keep them on your chart!
🔥 Follow me for real-time setups, clear signals, and expert technical analysis!
BTC 4H – Support Tapped 2x After Breakout, Will Bulls Step In?Bitcoin is retesting a major demand zone that launched the last breakout. After a sharp impulse move, price has ranged tightly and just tapped this support area for the second time.
A clear double bottom attempt is forming, but failure to hold $115K could open the door to deeper downside. Bulls want to see a quick reclaim of $117K to confirm structure still holds.
Clean levels. Clear reaction zones. Let’s see who takes control.

Bitcoin: Expected Cool-Off or Cause for Concern?After rallying more than 25% off the June lows, Bitcoin is finally taking a breather with a much-anticipated pullback. But as expected, the fear meter is spiking, especially across CT.
Was this cool-off really a surprise? Not quite.
The signs were there: price stalling at upper extremes, responsive sellers stepping in at perceived overextensions, and inefficient zones left behind during sharp impulsive moves.
Of course, reading it in real-time is easier said than done. Emotions always complicate execution , but that’s a separate conversation.
In this post, let’s break down the current structure in detail —using volume profile, TPO charts, and market structure analysis, to give you a clearer picture of what’s unfolding. We’ll also explore a few scenarios worth watching as the next move shapes up.
Let’s dive in!
Table of Contents
➺ Volume Profile
➺ TPO
➺ Key Technical Insights
➺ Market Structure
➺ Trade Scenarios and What to Watch
➺ TLDR
⦿ Volume Profile
Currently, we’re seeing two key zones of balance : one broad range that held for over 60 days and a tighter 21-day structure that formed at higher levels. These are classic areas of value where buyers and sellers found temporary agreement, establishing balance.
The sharp move from ~111,000 to ~122,000 was largely impulsive , with little volume built along the way, suggesting initiative buying in early July. As is often the case with such thin zones, they tend to get revisited once momentum fades. That’s exactly what we’re seeing now.
As price dips into this low-volume pocket, the key question is:
Will the market accept this zone and begin building value here, or will it reject and bounce back toward higher ground?
Looking at the Volume Range Visible Profile (VRVP) since June 7th, the nearby Value Area High (VAH) sits around ~111,000 . If current support doesn’t hold, this becomes the next major volume magnet. That said, there’s also a low-volume node (LVN) just above 111,000 , which could act as a demand pocket and trigger a responsive bounce.
In simple terms:
– Acceptance into the LVN could lead to new range formation at lower levels
– A sharp bounce off ~110,000 might reestablish the prior higher balance, or create a fresh range between the two existing areas
The next few sessions will reveal whether the market is hunting for new value or just shaking out weak hands.
⦿ TPO
Zooming into the 4H TPO chart, we can clearly see the evolving monthly profiles from May through August. And as is often the case, the market found resistance right where you’d expect: at the extremes.
The upper end of July’s profile became a battleground. Buyers attempted multiple pushes above that upper balance, but each effort was consistently faded by responsive sellers , signaling growing exhaustion at the top.
Eventually, that pressure gave way to an impulsive breakdown, driven by initiative selling. Notably, price didn’t rotate gently back into the previous range, but it sliced straight into a thin zone of prior low participation.
Now, the market is sitting at the low-volume region , and the next key battle is shaping up. Additionally, The 108,000 to 110,000 area carries weight as it served as the Value Area High (VAH) for both the May and June profiles. If buyers are going to respond, this is one of the more likely places for them to step in.
⦿ Key Technical Insights
▸ Failed Acceptance Above 21-Day Balance
Repeated attempts to hold above the short-term balance were rejected, signaling buyer fatigue and a lack of conviction at higher levels.
▸ Initiative Sellers Took Control
Once demand dried up, sellers stepped in aggressively. The thin participation during the recent rally left little structural support, allowing price to drop quickly.
▸ No Value Built Below Yet
The zone currently being tested saw minimal trading earlier. If bulls want to reclaim control, they’ll need to build value here and establish a new base.
▸ Prior Balance High as Potential Support
Price is now retesting the top of the 60+ day balance area from above, a classic setup where previous resistance can become support. This area also aligns with a known demand shelf.
▸ Deviation Below the 200 MA Cloud
Price has slipped below the 200 MA cloud and is nearing a key flip zone. A test of the 110,000 level next week wouldn’t be surprising. That area could serve as a strong support zone where a new accumulation phase begins.
⦿ Market Structure
The broader market structure points to a transition in progress. After spending over two months in balance , price broke out to the upside —only to form another short-lived range at higher levels. That, too, gave way to a swift breakdown.
This kind of “failed acceptance at higher prices” is often an early signal that the market may revisit prior zones of interest, typically areas where value was last built.
All eyes now shift to the 110,000–111,000 zone , the high of the previous 60-day balance.
We’re in a classic test-retest phase, where the market is probing for conviction . These moments often set the stage for the next significant move, either continued distribution lower, or the beginning of a re-accumulation phase.
⦿ Scenarios & What to Watch
As Bitcoin pulls back into key structural zones, several scenarios are in play. Here's what to monitor in the coming sessions:
Scenario 1: Re-Acceptance into 21-Day Balance
▸ If price reclaims and holds above ~116K, we could see a rotation back toward the upper end of the short-term balance near ~120K.
▸ This would suggest the recent breakdown was a failed auction or bear trap, not the start of a broader trend reversal.
▸ Watch for initiative buying above the demand shelf with follow-through volume.
Scenario 2: Choppy Mid-Balance Activity
▸ Price remains range-bound between ~110K and ~116K, forming a new short-term balance zone.
▸ Expect slower movement and back-and-forth behavior as the market decides its next direction.
▸ Patience is key here. Watch volume and initiative behavior to gauge strength.
Scenario 3: Rejection and Continuation Lower
▸ If price fails to hold above ~110K, there’s potential for a move down to the POC near ~104K, or even deeper toward ~100K (Value Area Low).
▸ These are low-volume zones, which rarely offer strong support unless new value is built.
▸ This would signal a continuation of the current imbalance and potentially mark a structural trend shift.
I’m primarily focused on Scenario 1 and 2 , as we appear to be in a late bull phase. A deeper pullback toward 100K increases the risk of a broader trend change, making it less attractive from a risk/reward standpoint.
⦿ TLDR
▸ Buyers failed to hold the top of the 21-day balance. Clear signs of exhaustion.
▸ Price dropped into a prior low-volume zone, which now acts as potential demand.
▸ This area has never been accepted before - either buyers step in, or we go lower.
▸ Reclaiming ~116K could fuel a move back toward 120K+.
▸ Failure to hold ~110K opens the door to 104K, maybe even 100K.
What happens next week will likely set the tone for the next major move. Watch how the market responds to acceptance vs rejection zones, and let price action confirm your bias before you act.
If you found this analysis helpful, share it with someone who trades Bitcoin. 🥰
What’s your read on the current structure? Let me know in the comments! 📉
⚠️ Disclaimer
As always, this post is purely for educational purposes. I am not a financial advisor, and nothing here should be taken as financial advice. Always consult your financial advisor before making any investment or trading decisions. Or at the very least, consult your cat. 🐱

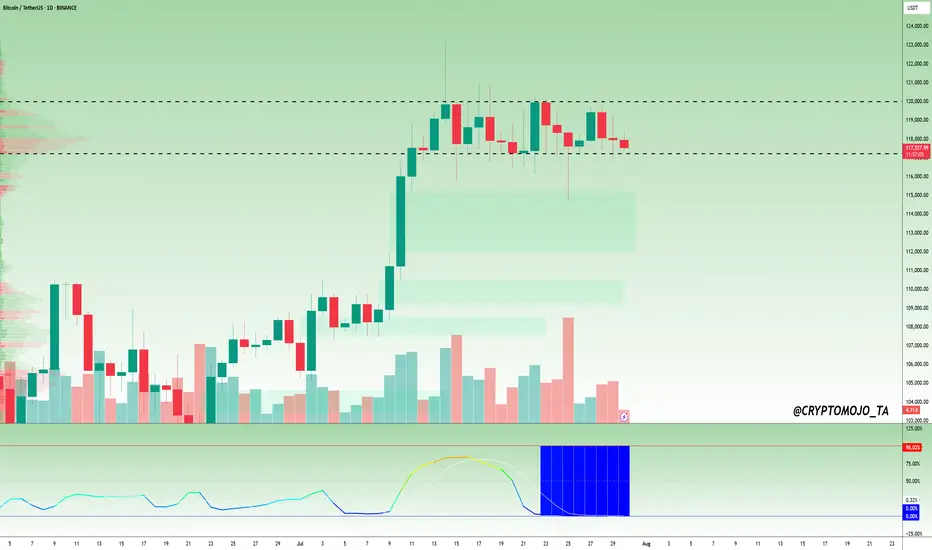
$BTC Daily Timeframe Update! #Bitcoin ( CRYPTOCAP:BTC ) is still moving sideways, consolidating in a tight range between ~$117,400 and $120,100, just below recent local highs. The market is showing clear signs of compression, and the BBWP (Bandwidth Width Percentile) is flashing a deep blue near 0%, which signals extremely low volatility.
Historically, this kind of BBWP reading comes before big price moves. However, the direction is still uncertain as BTC trades between key resistance and minor support.
Key Levels to Watch:
Resistance: ~$120,100
Support: ~$117,400
BBWP: ~0% tight volatility coil
If BTC breaks above $120K, it could lead to strong upside continuation. But if it drops below $117.4K, we might see a deeper correction.
📌 Tip: Wait for volume and BBWP expansion to confirm the next move. The spring is tightly wound, a big breakout is likely coming soon.
DYOR, NFA
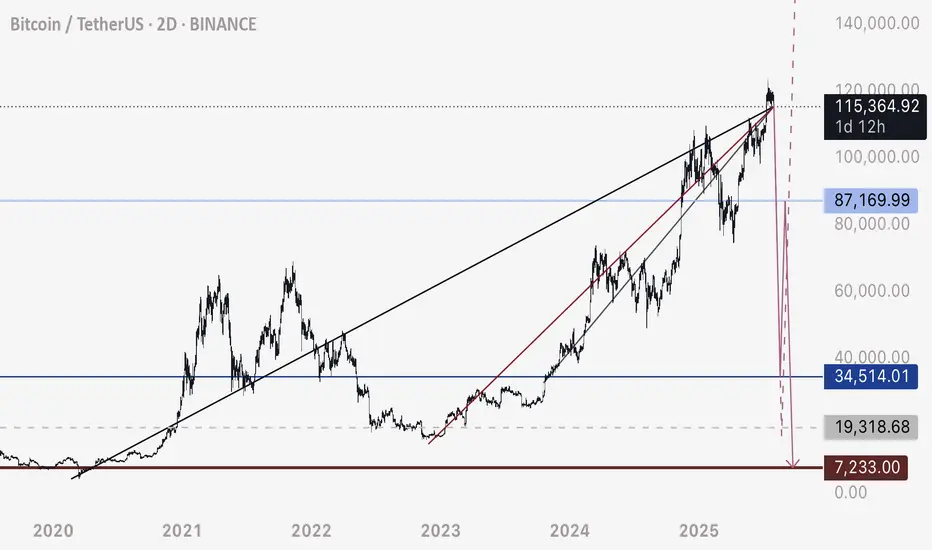
BTC - Not the End of the DropRather the beginning. Bitcoin has fallen below this bearish intersection. Anticipating price to fall rapidly on one of these two pathways to the Uber low liquidity levels.
DXY is retesting a major bearish breakdown - this is the conduit that will justify a flash crash of this magnitude prior to a 3-5 year bull run.
Happy trading.

BTCUSD sell "I had posted it before as well, but it got hiddenAnalyzing market structure and liquidity using Price Action and Smart Money Concepts. Focused on key supply/demand zones and institutional order flow

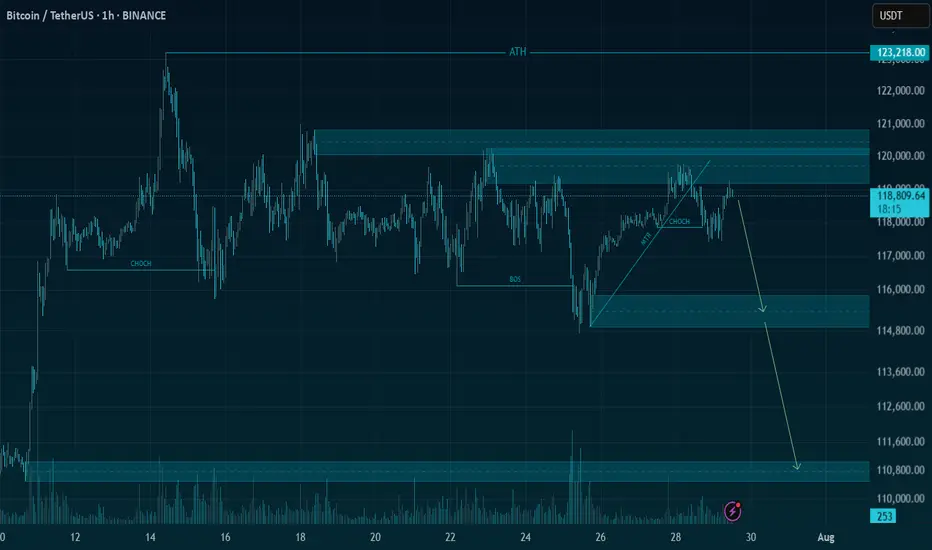
Is the #BTC pullback over?📊 Is the #BTC pullback over?
🧠From a structural perspective, a bearish structure has formed on both the 1-hour and 4-hour charts, so we should be wary of the risk of a further pullback.
➡️Resistance is the area formed by the two necklines (114675-115729).
Support is primarily the overlap between the yellow and green areas (110000-111688). If we can establish a bullish structure on the 1-hour chart here, we still have a chance of continuing the bullish trend.
🤜If you like my analysis, please like 💖 and share 💬 BITGET:BTCUSDT.P

Bitcoin Go 89kBe prepared for a market correction. BIT has a negative divergence on the weekly timeframe.
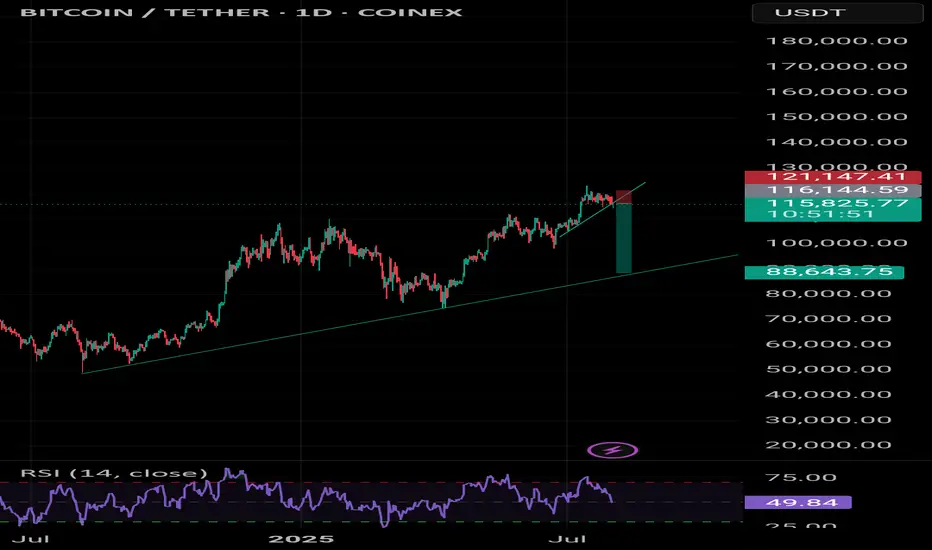
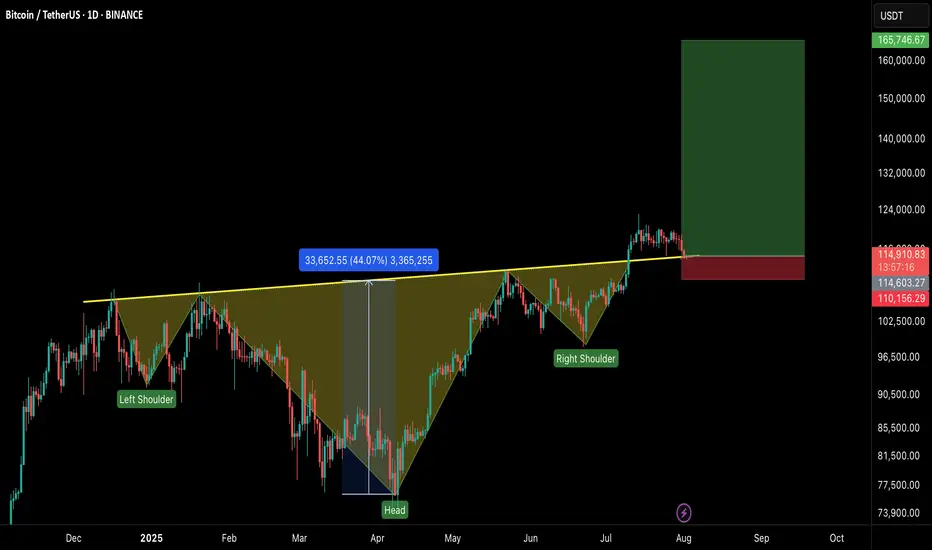
#BTCUSDT – Healthy Correction, Not the End!Bitcoin is currently experiencing a healthy pullback after an impressive run, testing the neckline of the Inverse Head & Shoulders breakout on the 1D timeframe.
🔹 Current Market View:
BTC is retesting the neckline of the IHS pattern, which now acts as a strong support zone.
Price is holding near $113K–$115K, which is crucial for maintaining bullish momentum.
This dip is a healthy correction, flushing out over-leveraged positions and preparing for the next leg up.
🔹 Key Levels:
Support Zone: $113,000 – $115,000
Immediate Resistance: $120,000 – $122,500
Breakout Target: $165,000+ on the next bullish wave
🔹 Market Sentiment:
Holding above the neckline keeps the bullish structure intact.
If the support holds, we can expect continuation to new highs once buying pressure returns.
A daily close below $112K would signal caution and delay the next rally.
💡 Tip: Don’t panic on these red candles. Healthy corrections are part of a sustainable uptrend.
Double Bullish Flag on Bitcoin — Next Rally to $135K?📊 BTCUSDT (12H) In-Depth Analysis: Major Momentum Brewing
Bitcoin (BTC) is currently exhibiting a very promising technical structure — a Double Bullish Flag, a rare yet powerful continuation formation that often precedes strong upside momentum.
This dual-pattern structure reflects market strength and smart accumulation, with bulls maintaining control while allowing for healthy pauses before potential expansion to higher levels.
---
🔍 Technical Breakdown: Double Bullish Flag Structure
🔸 1. Primary Bullish Flag:
Formed after a sharp rally from around $95,000 to $113,000 (flagpole).
Price then consolidated within a clear descending channel, forming a classic Bullish Flag pattern.
Breakout from this pattern occurred in early July, confirming bullish continuation.
🔸 2. Secondary Bullish Flag (Mini Flag):
After the breakout from the main flag, BTC formed a second smaller flag pattern — a narrow descending channel from ~$123K to ~$119K.
This is known as bullish flag stacking — a pattern of "flag on top of flag", signaling trend strength and smart consolidation.
This mini-flag now acts as a launchpad for the next potential breakout.
---
🚀 Bullish Scenario: Preparing for a Breakout
If BTC breaks above the upper resistance of the mini flag (~$123,200), it will signal a fresh bullish continuation.
🎯 Potential Upside Targets:
Conservative target: $126,000 – $128,000
Full measured move target (from flagpole): $132,000 – $135,000
✅ Confirmation criteria:
Strong candle close above $123.2K
Accompanied by rising volume and upward RSI momentum (but not overbought)
---
🧨 Bearish Scenario: Breakdown and Retest
If BTC fails to break above the flag and instead drops below the flag support (~$119,400), we may see a short-term correction.
🔻 Key Support Levels:
$117,000 – minor horizontal support
$113,000 – $115,000 – strong demand zone and previous breakout area
⚠️ As long as price holds above $113K, the broader bullish trend remains intact. A pullback to this zone could offer a prime retest-buying opportunity.
---
📌 Key Price Levels to Watch:
Level Role
$123,200 Mini-flag resistance (breakout trigger)
$121,600 Mid-range resistance
$119,400 Flag support
$117,000 Horizontal retest zone
$113,000 Major support (trend invalidation if lost)
$132K – $135K Projected breakout target
---
💡 Conclusion: BTC in Critical Zone Before Potential Expansion
This Double Bullish Flag formation is one of the most technically constructive setups BTC has shown in weeks. It reflects a strong, patient market — with bulls preparing for another leg higher.
If the breakout from the second flag confirms, Bitcoin could rally toward $135,000, backed by momentum, volume, and clean structure. However, a breakdown would only signal a short-term cooldown unless support at $113K is lost.
🧭 Stay focused on breakout confirmation, volume spikes, and market sentiment. This could be the calm before a bullish storm.
#BTCUSDT #BitcoinBreakout #BullishFlag #TechnicalAnalysis #DoubleBullFlag #BTCMomentum #BitcoinRally #CryptoOutlook #BitcoinTo135K

Bitcoin could go up again nowHi traders,
Last week Bitcoin made a Zigzag (break of previous low into the bullish Daily FVG) as I've predicted in my outlook.
After it came into the Daily FVG, price went up again.
Now if we see a small correction down, we could see the next impulsive wave up to a new ATH.
Let's see what the market does and react.
Trade idea: Wait for a correction down to finish.
Then after an impulse wave up, a small correction down on a lower timeframe and a change in orderflow to bullish you could trade longs.
NOTE: the next three weeks I'm on holiday so I will not post any outlooks publicly.
If you want to learn more about trading FVG's with wave analysis, please make sure to follow me.
This shared post is only my point of view on what could be the next move in this pair based on my analysis.
Don't be emotional, just trade your plan!
Eduwave

Bullish Flag Forming on BTCUSDT – Is the Next Big Move Coming?🧠 Complete and Insightful Technical Analysis:
The 12H BTCUSDT chart is currently showcasing a textbook Bullish Flag pattern, a powerful continuation structure that often precedes major upward moves.
---
🏗️ Pattern Breakdown: Bullish Flag
1. Flagpole:
The sharp breakout from around $107,000 to $123,000 marks the impulsive rally — this is the flagpole, created by strong bullish momentum.
Represents the "lift-off" phase where buyers dominate the market.
2. Flag (Consolidation Phase):
After the strong rally, price consolidates inside a downward-sloping parallel channel, forming the flag.
This pullback is healthy, characterized by declining volume, a key feature of the Bullish Flag.
Indicates temporary profit-taking before continuation.
3. Confirmation:
A breakout above the flag's upper boundary (around $123,000 – $124,000) with strong volume would confirm the pattern.
Breakout traders often use this as a high-probability entry.
---
📈 Bullish Scenario (High Probability):
If BTC breaks above the flag structure:
🎯 Measured Move Target (Based on Flagpole Height):
$123,000 + ($123,000 - $107,000) = $139,000
🚀 Potential for further upside if macro conditions and sentiment support the move, possibly reaching $135,000+ in the medium term.
Confirmation Required: A strong candle close above $123,500 with volume spike.
---
📉 Bearish Scenario (If Breakdown Occurs):
If BTC breaks down below the flag (~$117,000):
Retracement likely toward previous breakout zones at $112,000 – $109,000
Such a breakdown could turn the current structure into a fakeout or bear trap
However, this zone may present a strong re-entry opportunity for long-term bulls.
---
📚 Educational Insight for Traders:
Bullish Flags often appear during strong uptrends, acting as a pause before the next leg up.
A healthy pattern shows shrinking volume during the flag and rising volume at breakout.
Traders should monitor key horizontal resistance and volume behavior for confirmation.
---
🧭 Conclusion:
BTCUSDT is at a critical technical juncture. The formation of a clean Bullish Flag suggests the potential for a major continuation rally. Confirmation through a breakout is key — this is the time to prepare, not react.
#BTCUSDT #Bitcoin #BullishFlag #BTCBreakout #CryptoTechnicalAnalysis #CryptoTrading #PriceAction #BTCAnalysis #BitcoinPattern #CryptoEducation #BTCFlag #ContinuationPattern

BTC:LIVE TRADEHello friends🙌
📉Given the decline we had, we now had a good price rebound in the specified support area, which shows the power of buyers. Now, with capital and risk management, we can buy at the specified points in a stepwise manner and move to the specified targets.
🔥Follow us for more signals🔥
*Trade safely with us*

BITCOIN's Situation (12h) !!!So if you pay attention to the TON chart you can see that the price has formed a Ascending wedge which means it is expected to price move as equal as the measured price movement.( AB=CD )
NOTE: wait for break of the WEDGE .
Best regards CobraVanguard.💚

BTCUSDT | Bitcoin needs liquidity to be able to go up more🚀 Trade Setup Details:
🕯 #BTC/USDT 🔽 Sell | Short 🔽
⌛️ TimeFrame: 1H
--------------------
🛡 Risk Management:
🛡 If Your Account Balance: $1000
🛡 If Your Loss-Limit: 1%
🛡 Then Your Signal Margin: $1204.82
--------------------
☄️ En1: 118829.28 (Amount: $120.48)
☄️ En2: 119162.54 (Amount: $421.69)
☄️ En3: 119400.34 (Amount: $542.17)
☄️ En4: 119638.61 (Amount: $120.48)
--------------------
☄️ If All Entries Are Activated, Then:
☄️ Average.En: 119283.83 ($1204.82)
--------------------
☑️ TP1: 118025.43 (+1.05%) (RR:1.27)
☑️ TP2: 117427.5 (+1.56%) (RR:1.88)
☑️ TP3: 116671.89 (+2.19%) (RR:2.64)
☑️ TP4: 115717.73 (+2.99%) (RR:3.6)
☑️ TP5: 114673.35 (+3.87%) (RR:4.66)
--------------------
❌ SL: 120276.34 (-0.83%) (-$10)
--------------------
💯 Maximum.Lev: 66X
⌛️ Trading Type: Swing Trading
‼️ Signal Risk: ⚠️ High-Risk! ⚠️
🔎 Technical Analysis Breakdown:
This technical analysis is based on Price Action, Elliott waves, SMC (Smart Money Concepts), and ICT (Inner Circle Trader) concepts. All entry points, Target Points, and Stop Losses are calculated using professional mathematical formulas. As a result, you can have an optimal trade setup based on great risk management.
⚠️ Disclaimer:
Trading involves significant risk, and past performance does not guarantee future results. This analysis is for informational purposes only and should not be considered financial advice. Always conduct your research and trade responsibly.
💡 Stay Updated:
Like this technical analysis? Follow me for more in-depth insights, technical setups, and market updates. Let's trade smarter together!
SHORT TERM BEARISH TARGETS ON THE H4 TIMEFRAME on THE BTCUSD, here are the downside target levels (short-term bearish targets) for BTC/USDT:
🎯 Target Levels:
1. Target Point 1:
112,000 USDT
This is a minor support zone where a temporary bounce or consolidation could occur.
It aligns with previous price action support and is near the lower Ichimoku edge.
2. Target Point 2:
106,000 USDT
This is a major support level near the lower boundary of the ascending channel.
If price breaks below Target 1 decisively, this becomes the high-probability target.

BTC Roadmap Ahead: Ideal Entry, TP Zones & What to AvoidAs long as Bitcoin stays above the ~$98,200 zone on the daily timeframe, I believe the bullish trend remains intact.
No need to panic — what we need now is rational decision-making, not emotional reactions.
Since price has reached a key area around $118K–$120K, I’ve already taken partial profits at this level.
If no major fundamental changes occur and conditions remain stable, I see the maximum target for this leg somewhere between $134K and $140K, where I plan to secure additional profits.
Right now, my main objective is to increase my Bitcoin holdings.
The first buy zone I’m watching is around $110K, clearly marked with a red circle on the chart.
When price reaches this zone, I won’t enter immediately — I’ll wait for consolidation and confirmation, as a deeper correction is still possible.
There’s no need to rush — patience is power.
📌 All I’m trying to do is accumulate as much Bitcoin and sats as I can — because I know one day, I’ll be proud of it.
🔁 This analysis will be updated whenever necessary.
Disclaimer: This is not financial advice. Just my personal opinion.

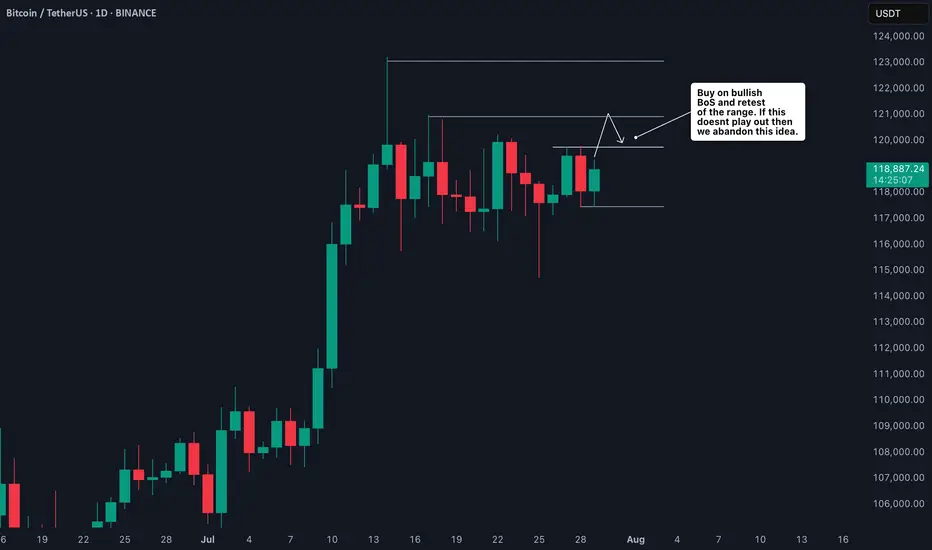
BTC Trade Plan: Watching for Break and Retest Above Daily Range🟠 Bitcoin (BTC) is currently trading range-bound on the daily timeframe ⏳📉📈. I’m monitoring price action for a bullish break and retest 🔓🔁 of the current range to confirm a potential long entry 🎯.
📍 Key levels are already marked on the chart 🗺️—
🛑 Stop-loss would sit just below the previous swing low,
🎯 Target aligns with the higher price zone marked out to the left of the chart 🔼👈.
This is a classic range breakout setup—patience and precision are key.
🧠 As always, this is not financial advice.