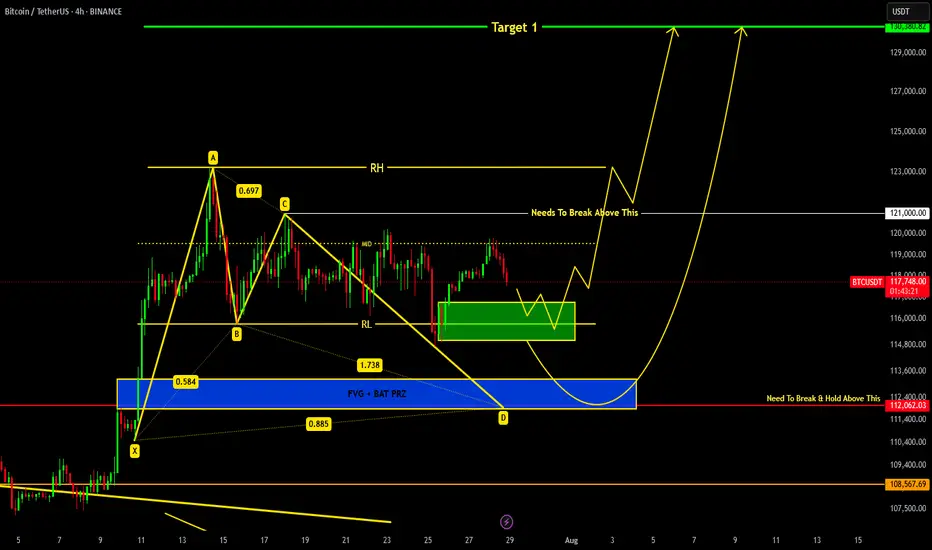
BITCOIN Current Update !!!we are heading towards support region around 116.8k-115k from where we can expect a reversal.
If price breaks down 115k level then a bat harmonic pattern is also forming which indicates it's PRZ at 113-112k region...
Remember 121k is key level which needs to be broken in order to remain bullish !!!
BTCUSDT.3S trade ideas
Bitcoin (BTC): Gameplan Remains The Same | Targeting $140KOur game plan remains the same for Bitcoin; we are bullish and with the new weekly opening, we are seeing that buyers still have the dominance.
No signs of any major weaknesses so as long as we are above the $100K zone, we are aiming to reach that $140K zone within months!
Swallow Academy

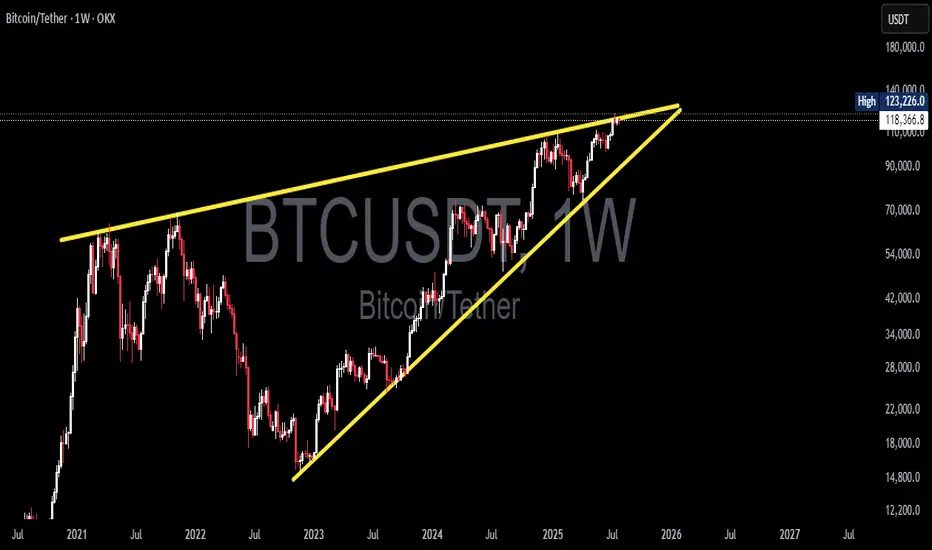
Bitcoin at a Decisive Moment! Rising Wedge Formed — Breakout?🧠 In-Depth Technical Analysis (BTCUSDT – Weekly Timeframe)
Bitcoin is currently trading within a large Rising Wedge pattern, formed over the long term from late 2022 to mid-2025. This structure is typically a bearish reversal formation, although it can also lead to a breakout in strong bull markets.
The wedge is defined by:
Consistently higher lows on the lower trendline
A gradually rising upper resistance line that currently caps price around $123K–$125K
Decreasing volume, indicating consolidation and energy buildup near the apex
This wedge reflects a period of euphoric price action post-2022 bear market accumulation, with price now testing the top of a historically significant resistance zone.
---
📊 Key Price Levels:
🔹 Current Price: ≈ $118,436
🔹 Recent Weekly High: $123,226
🔹 Critical Resistance (Wedge Top): $123,000–$125,000
🔹 Dynamic Support: Rising wedge base (~$90,000–$95,000)
---
🐂 Bullish Scenario: “Historic Breakout Incoming”
If BTC successfully breaks above the wedge’s upper resistance and closes a weekly candle above $125K with strong volume, it would signal a confirmed breakout from the long-term wedge structure.
📈 Upside Targets:
🎯 Target 1: $140,000
🎯 Target 2: $155,000+ (based on Fibonacci extension and macro targets)
🚀 A breakout of this magnitude may trigger a new parabolic rally, especially if accompanied by:
Increased institutional adoption
Spot ETF inflows
Favorable macroeconomic shifts (e.g., rate cuts)
---
🐻 Bearish Scenario: “False Breakout or Breakdown Risk”
If Bitcoin fails to break out and faces strong rejection from the resistance zone (possibly a false breakout), the rising wedge formation may break down — leading to a steep correction.
📉 A breakdown from this structure often leads to sharp drops due to:
Overextension of the current trend
Distribution phase by smart money
🎯 Downside Targets:
Support 1: $95,000–$90,000
Support 2: $76,000
Major Support: $54,000 (historical demand & EMA zones)
---
🔍 Optional Indicators for Chart Confirmation:
Weekly RSI: Watch for bearish divergence
Volume Profile: Can highlight distribution or accumulation zones
EMA 21/50: Ideal for identifying dynamic support levels in retracements
---
📌 Conclusion:
Bitcoin is at a crucial inflection point within this multi-year Rising Wedge. A confirmed breakout could lead to new all-time highs, while a breakdown may trigger a broad correction. Traders should prepare for high volatility, wait for clear confirmation signals, and manage risk wisely in this pivotal zone.
#Bitcoin #BTCUSDT #RisingWedge #BTCBreakout #TechnicalAnalysis #CryptoMarket #PriceAction #BearishReversal #CryptoSignal #ChartPattern #BitcoinAnalysis #Cryptocurrency
Bitcoin ready to fall?!??I think this is the best analysis that can be made of Bitcoin. I don't see any strength in its trend and I feel that it is going to correct to the specified areas, but our trend is completely bullish.

BTCUSDT #056 ( Is it clear Road map ? )Hello dear traders.
Good days . First of all thanks for your comment and support.
-----------------------------------------------------------------------------------------------
On long term Gann Square, BTCUSDT stuck below 0.382 Gann Box price level.
With refer to all Daily bullish Gann Square ( Blue Square) of bitcoin, it is expected to fill up at least 0.75 Daily Gann Square up to 97 percent which will be 135-150 k for this bullish cycle .
Safe trades and good luck.

TradeCityPro | Bitcoin Daily Analysis #136👋 Welcome to TradeCity Pro!
Let’s get into the analysis of Bitcoin and major crypto indices. As usual in this analysis, I’m going to review the futures triggers for the New York session.
⏳ 1-Hour Timeframe
On the 1-hour timeframe, price is still ranging inside the box, and none of its triggers were activated yesterday.
✔️ The support floor is at 117,342, and another key support zone is around 116,000.
✨ If these zones break, Bitcoin may begin a deep correction. In that case, we can open short positions or close long-term long positions that we’re already holding.
⭐ For long positions, we still have the 119,395 and 120,594 triggers. A breakout of either zone could provide a very good entry point for the next bullish leg of Bitcoin.
👑 BTC.D Analysis
Let’s move on to Bitcoin Dominance. Yesterday, dominance stabilized above the 61.20 zone, and as I mentioned before, breaking this zone led to a bullish leg, which continued up to 62.41, and currently, it has more bullish momentum.
💥 If 62.41 breaks, the bullish momentum will intensify. However, I still believe the overall trend is bearish, and if 60.46 breaks to the downside, the decline could continue.
📅 Total2 Analysis
Let’s go over Total2. This index has continued to correct and has now dropped to the 1.41 zone, which corresponds to the 0.5 Fibonacci level. It has now created a trigger around 1.47.
⚡️ If 1.47 breaks, we can open a long position. Our next trigger will be 1.53.
A breakout of 1.53 would signal the start of the next bullish wave.
📅 USDT.D Analysis
Now to Tether Dominance. This index has finally exited its range box and has broken the 4.25 level.
The current resistance stopping price is 4.36.
🔔 If dominance drops back below 4.25, strong bearish momentum could hit, increasing the likelihood of a breakdown of 4.13.
❌ Disclaimer ❌
Trading futures is highly risky and dangerous. If you're not an expert, these triggers may not be suitable for you. You should first learn risk and capital management. You can also use the educational content from this channel.
Finally, these triggers reflect my personal opinions on price action, and the market may move completely against this analysis. So, do your own research before opening any position.

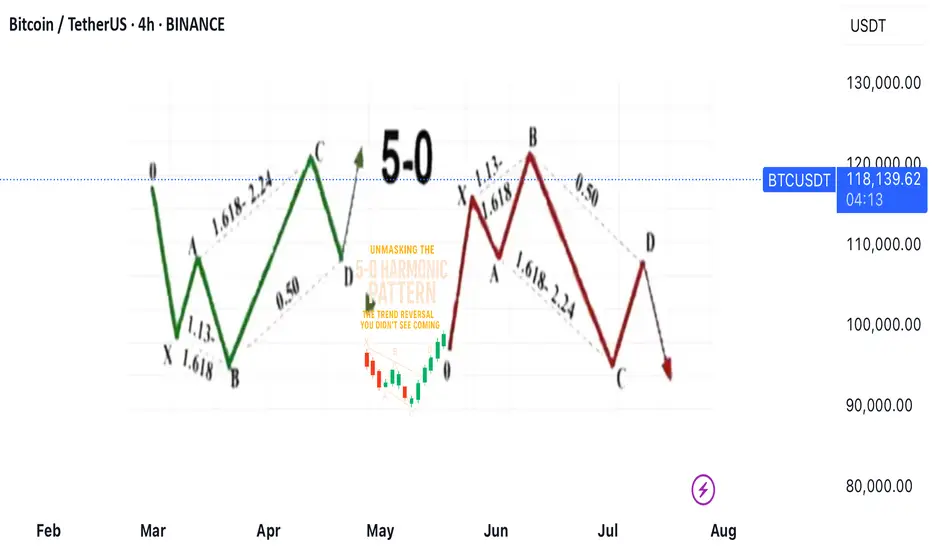
Unmasking the 5-0 Harmonic Pattern
---
🎯 **Unmasking the 5-0 Harmonic Pattern: The Trend Reversal You Didn't See Coming**
Discovered by the visionary Scott Carney and unveiled in _Harmonic Trading, Volume Two_, the **5-0 pattern** isn't just another blip on a trader’s radar—it’s a siren of market reversal.
📈 **Why It Stands Out**
- Unlike the familiar Bat or Gartley structures, the 5-0 pattern is fueled by **precise Fibonacci ratios**, making its reversal zone deadly accurate.
- Centered around the pivotal **Point B**, this model doesn’t just hint at change—it defines it.
🌀 **The Anatomy of a Flip**
- Often marking the **first true pullback in a major trend reversal**, the 5-0 isn’t a lagging indicator—it’s your early warning system.
- The **AB leg?** That’s no ordinary wave—it’s usually the final gasp of a fading trend, setting the stage for powerful new momentum.
💥 **Bottom Line**
This isn’t just technical analysis—it’s strategic foresight. The 5-0 pattern reveals where the market **hesitates... and where you strike**.
---
_"To truly learn, we must see it in action.
So let’s pull back the curtain and share a powerful example from our **past insurance market trades**—a deal that blended precision, timing, and strategy.
In comments
5 Lessons from My First 100 TradesAfter executing and reviewing over 100 real trades in crypto, forex, and gold — I found patterns. Bad patterns. Repeating mistakes. And lessons I wish someone had told me earlier.
So I broke them down into 5 key insights that changed how I trade — and might just save you thousands.
📘 Here’s what’s inside:
1️⃣ Smart Profit-Taking:
How I turned 10 R/R into 32 R/R using a dynamic exit plan.
📘Further resource:
Cycle Mastery (HWC/MWC/LWC)
---
Multi-Timeframe Mastery
2️⃣ The Sleep Edge:
70% of my losing trades happened after bad sleep. Here’s why that matters more than emotions.
3️⃣ No More Blind Stop Orders:
Why I stopped using buy/sell stops without real candle confirmation — and what I do instead.
📘 Further reading:
Breakout Trading Mastery
---
Indecision Candle Strategy
4️⃣ Multi-Layered Setups Win:
How structure, S/R, patterns, and timing stack into high-probability entries.
5️⃣ News Trading? Just Don’t.
The data behind why most of my SLs were hit near news time — and how I avoid the trap.
💡 These aren’t theories. These are real lessons from real trades.
If this video helped you or sparked an “aha” moment, give it a boost, commenting your takeaway, and sharing it with a fellow trader.
lets grow together :)

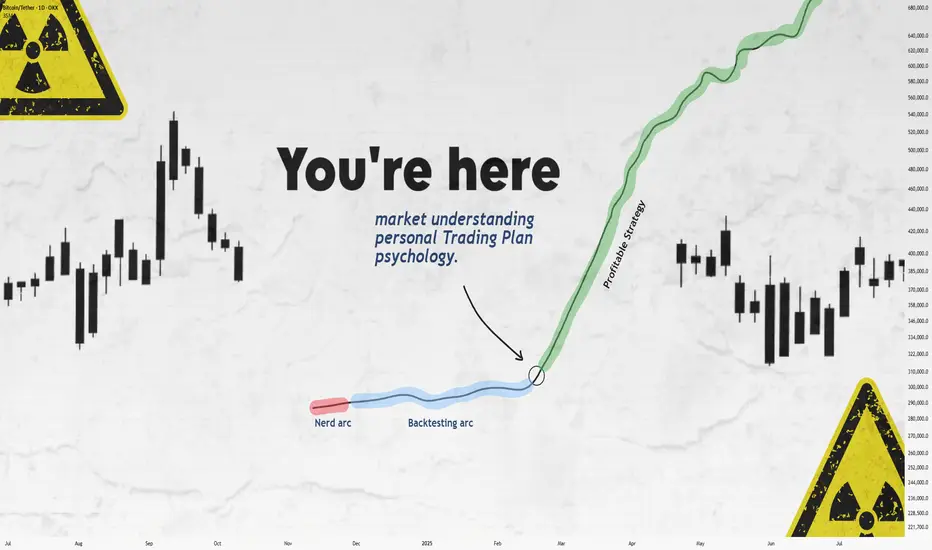
Still Losing After Backtesting? This Fixed It.Let’s get straight to it.
If you’ve gone through the "nerd arc" and the "backtesting arc" but still aren’t profitable...
What’s the fix?
In this short write-up, I’ll walk you through 3 brutal truths that made me finally see green.
Is it hard?
UH—Damn right.
But let’s go 👇
1. Market Understanding
This isn’t something you "learn" from a course.
It’s something that clicks after dozens of stop losses and live trades.
Here are a few ways I got more comfortable with it:
1. Don’t fear opening trades or hitting stop loss.
Each trade gives you data. More trades = more experience = better market feel.
What’s the requirement? Capital and risk management. Without that, you won’t even survive long enough to "get" it.
2. Journaling every single trade.
Write everything: your thoughts, screenshots, feelings — before and after.
Too lazy to do it? Left trading. Simple.
3. Be the detective.
Read the chart like a story. No, seriously.
Think of Bitcoin as a character with real moods.
Every candle tells you something.
That 5% pump? Buyers pushing up. Then bears smacked it down — candle closed red.
Now price is bleeding again.
Why?
🔍 Be the detective.
4. Analyze the market every day — even without trading.
The more you observe, the more you see. Structures. Patterns. Behavior.
Easy? Nah.
It takes discipline — like posting one story text to Insta for 1,000 days straight. Still wanna try?
2. Personal Trading Plan
Remember how I said "don’t fear opening trades"?
Well — after you’ve opened a bunch, you can start tailoring your own trading plan based on you.
This isn’t a PDF you can steal off Google.
Only after seeing how you behave in trades, you’ll know what rules make sense.
Maybe:
"I don’t trade when I’m emotionally off."
"This setup gave me the best results over 100 trades."
Just don’t copy-paste someone else’s rules.
Make a flexible structure, then let the details emerge from the market and your own experience.
Now —
Take a deep breath.
When was the last time you enjoyed your coffee?
More than a day ago?
Go make one now.
Might not get to taste it tomorrow.
Not everything in life is trading :)
3. Psychology
Ah, the final boss.
Still my weakest area, honestly.
But here are a few real things that helped:
Tip 1: WRITE.
Just write whatever you feel.
Telegram saved messages? Notebook?
Or if you're like me (🧠nerd), Notion.
Do it for 60 days straight — then feed that journal to ChatGPT and analyze yourself.
Takes time, but the patterns you'll see are... magical.
Tip 2: Money & Risk Management.
When you know your stop loss means only -0.25% of your capital…
why should you panic?
For me:
I place the SL, set a TP alert, and leave the screen.
No emotions, no fear.
Why? Because when capital is protected, so is my psychology.
Truth is, trading emotions aren’t just during the trade — they live in your head all day.
When your mental energy’s drained?
You’ll miss A+ setups.
Fall for BS ones.
Lose focus.
It’s complicated.
Because humans are complicated.
Our brains are the most tangled system known.
And somehow, out of all that noise, consciousness emerges.
A miracle.
So don’t expect to always feel calm.
Just aim to get better.
That’s it.
Thanks for sticking around.
These are just my thoughts, from one tired trader to another 🧠
I’m no expert—just sharing what’s worked (and what hasn’t).
If it helped, a boost would mean a lot.
🚫 Don’t FOMO
✅ Manage your capital
Until tomorrow —
Peace out. ✌️
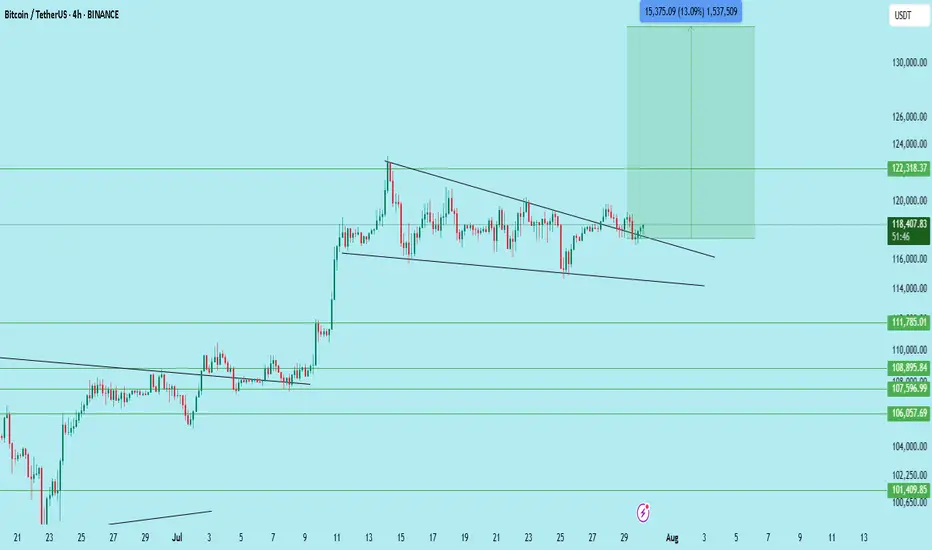
$BTC/USDT – Bull Flag Breakout on 4H | Targeting $133,700Bitcoin has just broken out of a well-defined bull flag structure on the 4H chart, signaling a potential continuation of the previous uptrend.
This breakout comes after a strong impulsive move upward, followed by a textbook flag consolidation with lower highs and lows forming a descending channel. The breakout above the flag resistance suggests a bullish continuation pattern is in play.
Technical Breakdown:
Pattern: Bull Flag (Continuation)
Flagpole base: ~106,700
Breakout zone: ~117,600
Retest Support: 116,000
Immediate Resistance: 122,300
Expected Target: 133,700 (based on flagpole projection)
Invalidation: Breakdown below 115,500
Expected Move:
Measured Move Target: ~13% upside from breakout
Confluence: Target aligns with past supply zone near 133K–135K
Price has also reclaimed the 50 EMA on the 4H chart, and the volume on the breakout shows bullish interest. Watching closely for a clean retest of the breakout zone for confirmation.
Conclusion:
BTC is showing bullish continuation after breaking out of a flag. A successful retest of 117.6K–116K range could offer further upside. Traders should manage risk accordingly.
DYOR | Not Financial Advice
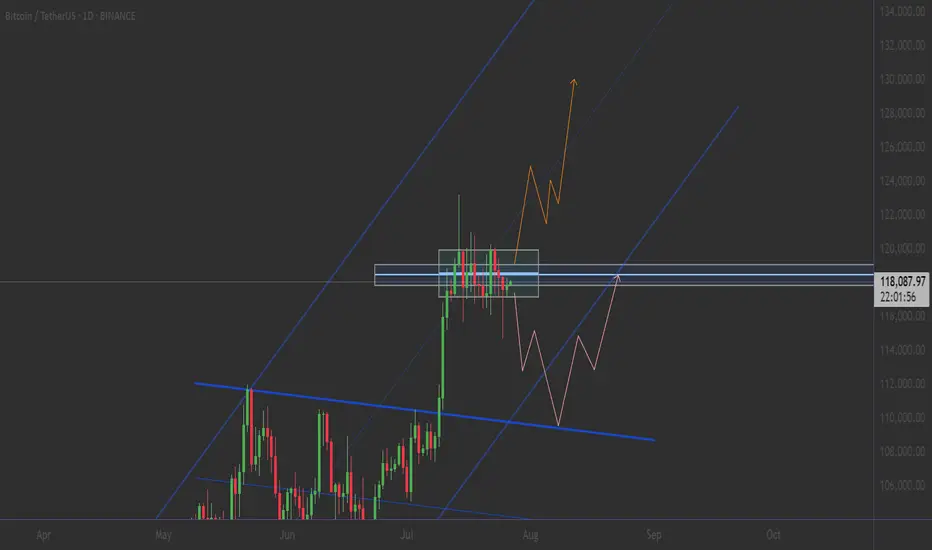
BITCOIN PREDICTION: HUGE BREAKOUT SOON!! (watch this level) Yello Paradisers! I'm sharing with you multi-timeframe analysis on Bitcoin, levels to watch out for, confirmations we are waiting for, and everything needed for successful professional trading that is being profitable in the long run.
I'm sharing with you zig-zag from the Elliot Wave pattern formation. I'm also sharing a possible impulse we are going through, a head and shoulders pattern and its target, and the next major resistance and support levels.
I'm sharing with you a contracting triangle setup and how to trade it, along with an ending diagonal setup and how to trade it. Watch out for confirmations and how the price is developing based on what I have been talking about in this video, then trade it as a professional trader should.
Make sure that you have a great risk management, trading strategy, and tactic for entering the trades. I have explained some tactics that I'm watching for in this video, but make sure that all these tactics are well within your larger trading strategy and that you're approaching the market professionally. Don't try to get rich quick.
Make sure that you are focusing on long-term profitability and survival. This is the only way you can make it in crypto trading!

BITCOIN: THE PERFECT STORM - MULTIPLE BREAKOUT PATTERNS ALIGNED⚠️ CRITICAL SUPPORT LEVELS
🛡️ Support 1: $115,000 (-3%) - Triangle support
🛡️ Support 2: $110,000 (-7%) - Channel support
🔴 DANGER ZONE: $105,000 (-11%) - Multiple pattern failure
So...
Strategy: Quick profits on pattern completion 🎨
Entry: $115k (Triangle breakout confirmation) 📊
Stop Loss: $114k below (Tight risk management) ❌
Target: $125k (+10%) ✅
Time Horizon: 2-3 weeks 📅
Risk/Reward: 1:6 🎯
________________ NOTE _____________
⚠️ This is not financial advice. Bitcoin is highly volatile and risky. Only invest what you can afford to lose completely. Always do your own research and manage risk appropriately 🚨
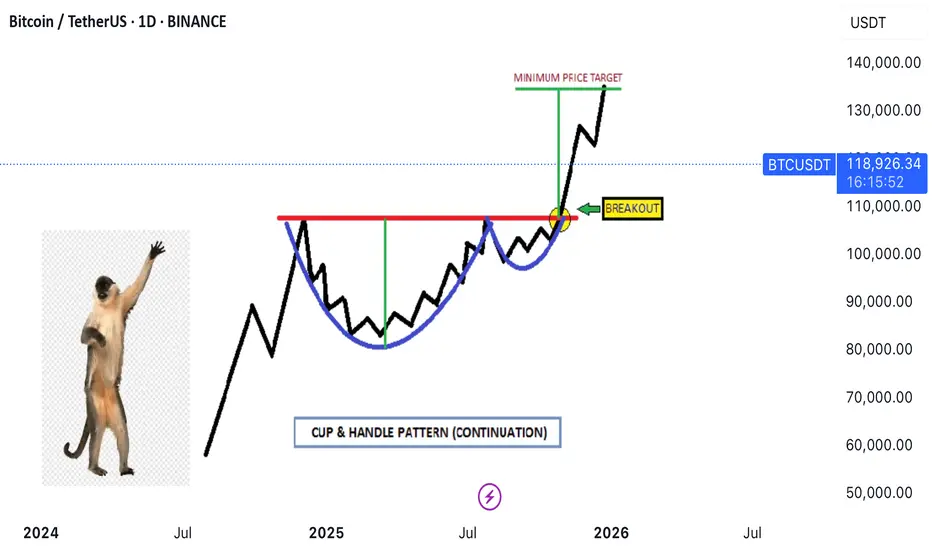
Thea **Cup and Handle** pattern✨ **Imagine the market serving profits in a teacup!**
Thea **Cup and Handle** pattern isn’t just a technical term—it’s the market whispering, *“Get ready for liftoff!”* Let’s break it down in an engaging way:
### ☕ The Cup
- Picture a graceful drop in price that curves back up, forming a U-shape.
- It’s like the market takes a sip, then refills—symbolizing recovery and building strength.
### 🛠️ The Handle
- After the cup fills, the price dips slightly again, forming a small slope downward.
- This is the “handle”—a moment of consolidation, often with lower trading volume.
- It’s the calm before the bullish storm.
### 💡 Bullish Signal
- When the price **breaks above the handle’s resistance**, it’s like the market pulls the trigger.
- This signals a potential buying opportunity as the trend resumes upward.
### 📆 Duration
- The cup can take weeks or even months to form, while the handle is shorter and more subtle.
- Patience pays off, as the breakout often leads to explosive momentum.
---
🏆 *Want proof?* Check the comments—one of our past trades using this exact pattern scored a massive win of **100,000 pips**! 🚀
Technical analysis isn’t just charts and numbers—it’s decoding the market’s rhythm.
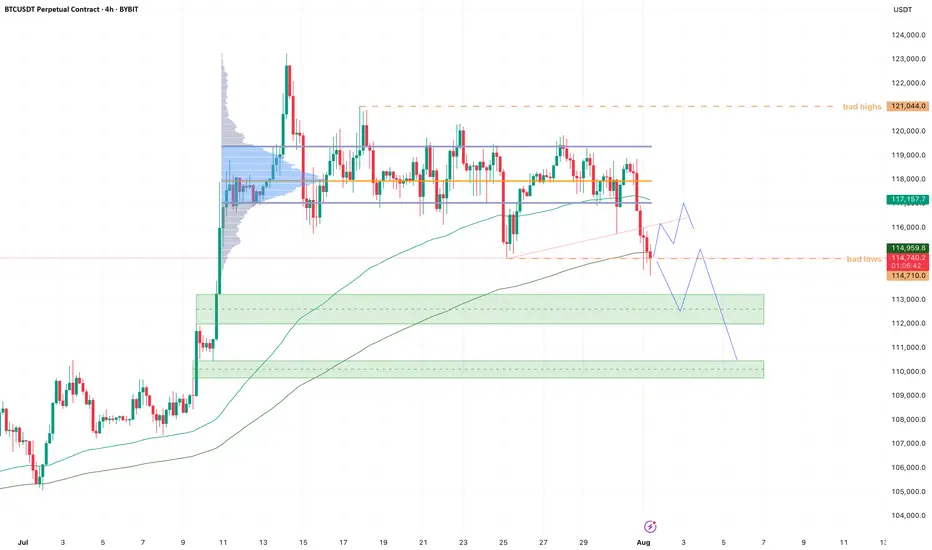
BTC - Cleaned up the lows!Bearish momentum is starting to stall here at the lows.
New month, and we started it by cleaning up the previous month's bad lows.
If we can hold here I'm looking for a trendline retest and VAL retest soon. Maybe we get one more sweep of the low, giving us a three drive pattern.
Reclaim VAL then it's back to VAH, maybe take out all the bad highs.
If we start bleeding into the lower demand zone (green box), I will start paying attention for a potential bearish retest into 110k, which we be our last area of imbalance to fill.
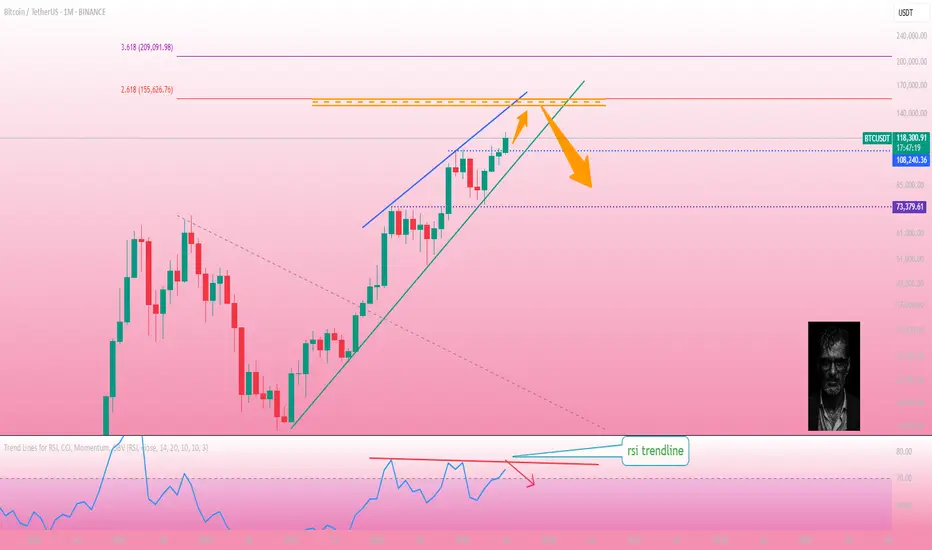
Bitcoin on a monthly time frameBitcoin on the monthly time frame.
If the monthly candle closes in this way, the price is expected to move to the 618 Fibonacci area. According to the trend line in RSI, we will enter a correction phase after the price rises.
BTC Long trade I'm taking a long position on BTC at 117,100, with a stop-loss at 116,800 and a target of 118,900. I'm taking this trade on the basis of technical analysis and price action.

BTCUSDT 4H buy #bitcoinHello friends. You see the Bitcoin chart. The price has done BOS on the 4-hour time frame. The FVG area is marked and is suitable for buying trades. Of course, this is just a theory.

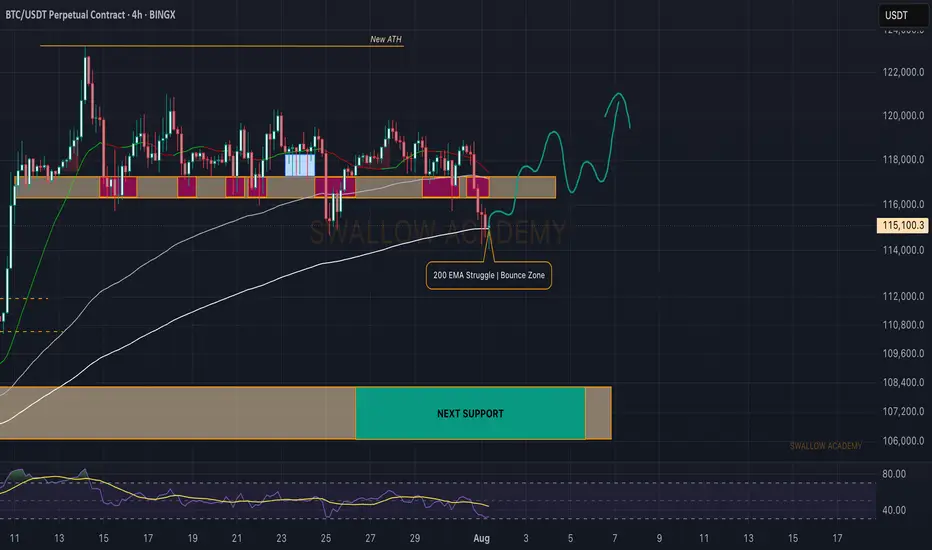
Bitcoin (BTC): 200EMA is Key Are Currently | Red Monthly OpeningBTC had a really sharp start to the month, and we are back near $115K, which was a key zone for us last time (due to huge orders sitting there).
Now, we see a similar struggle like last time but not quite the same, as the 200EMA has aligned with the $115K area. We are now looking for any signs of MSB, as we think we might get a recovery from here.
Now if we do not recover right now (by the end of today), we are going to see a really deep downside movement during the weekend most likely!
Swallow Academy
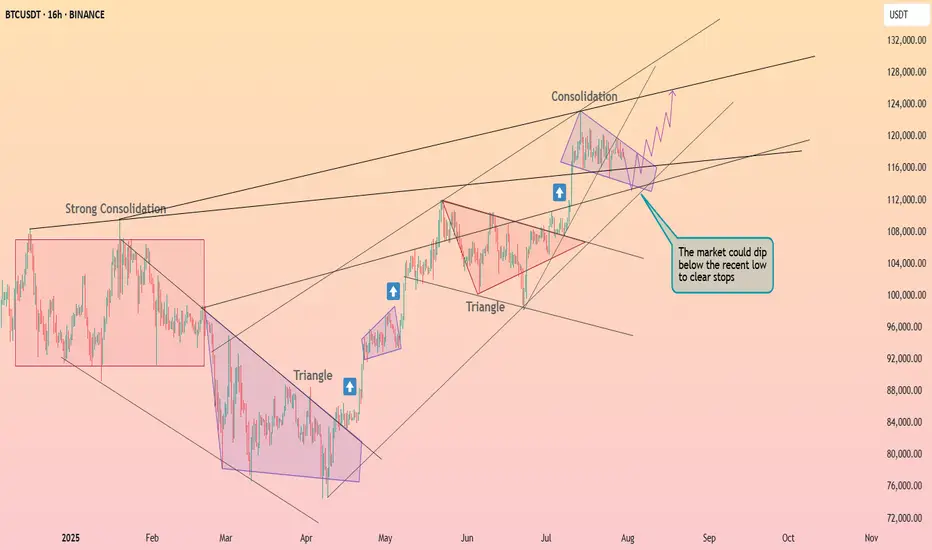
Bitcoin held the $115k level ┆ HolderStatBINANCE:BTCUSDT is currently in a triangle formation just above key support near 112,000. The price recently dipped below short-term support, likely triggering stop-losses, but still holds inside a bullish structure. If momentum builds, a push toward 125,000+ is likely. The trend remains intact above 110,000.
EXPECTATION THAT BTC WILL FALL IS VERY HIGHThe area im looking to sell BINANCE:BTCUSDT.P from is a very strong resistance that would be very difficult for mr BITCOIN to pass through, so therefore, im expecting BTC to reject from there and fall to the down side. Sell BTC

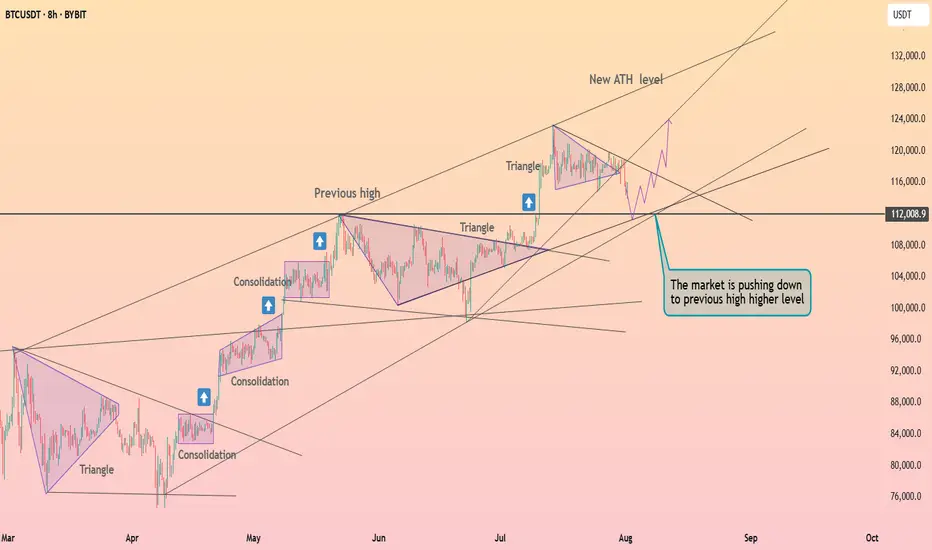
Bitcoin exited from the triangle ┆ HolderStatBINANCE:BTCUSDT is dipping to retest $112,000, the last breakout level. The price remains inside a large ascending triangle and may soon resume its uptrend. If this support holds, targets above $125,000 come back into play.
Bitcoin (BTC): Failed Dump | Buyers Still in Control Bitcoin recently had another wave of selling, where buyers once again showed their dominance near the local $116K zone and pushed the price of BTC back up.
We remain bullish, as we see the buyside dominance above the 116K area, so our target is still the current ATH; let's see.
Swallow Academy

BITCOIN & 134KAfter Bitcoin rallied on July 8 and consolidated for two weeks, this bull flag remains valid, targeting $134,000.
