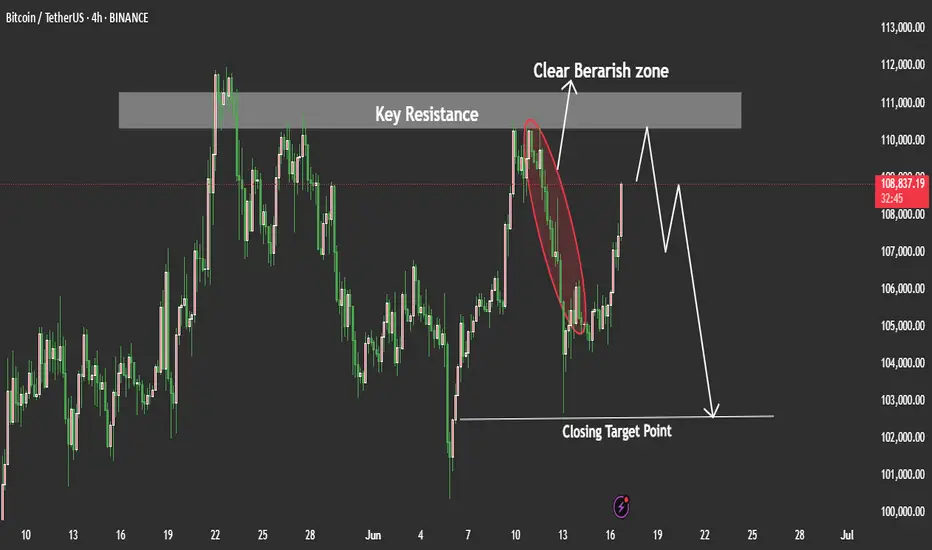
BTCUSDT Price may Test as Short TermBTC/USDT Price Analysis (Interpretation):
BTC/USDT recently tapped into a well-defined rejection zone on the 4H and Daily timeframes. This zone has previously acted as strong resistance.
Given this, we could expect a potential move to the downside unless the price breaks above that rejection zone with strong momentum. However, before the downside move fully plays out, there is a chance the price may retest the 102,500 level again — possibly as a liquidity grab or a false breakout — before resuming a bearish push. My Goal is 102,500 lets we see how how the price will plays out.
if you like tis idea and if you find good thing in this analysis share in comments we need support from you Guys.
BTCUSDT.5L trade ideas
#BTC Update Urgent. CRYPTOCAP:BTC Update:
Bitcoin is making another attempt to test the $102K support level.
Expecting a bounce around the 100k area if we reach there.
This level is holding strong, backed by two key EMAs and high liquidity concentration.
Just be careful with longs.
Monday’s pump faded quickly, a clear sign of weakness.
This is exactly why staying on the sidelines was the right call.
If you're holding stables, you're not losing in this volatility.
I’ll continue monitoring the price action closely.
It’s better to enter higher with solid confirmations than to gamble on local dips.
Altcoins are still struggling; stay cautious.
More updates soon.
Stay tuned.
Do hit the like button if you like it.
Thank you
#PEACE
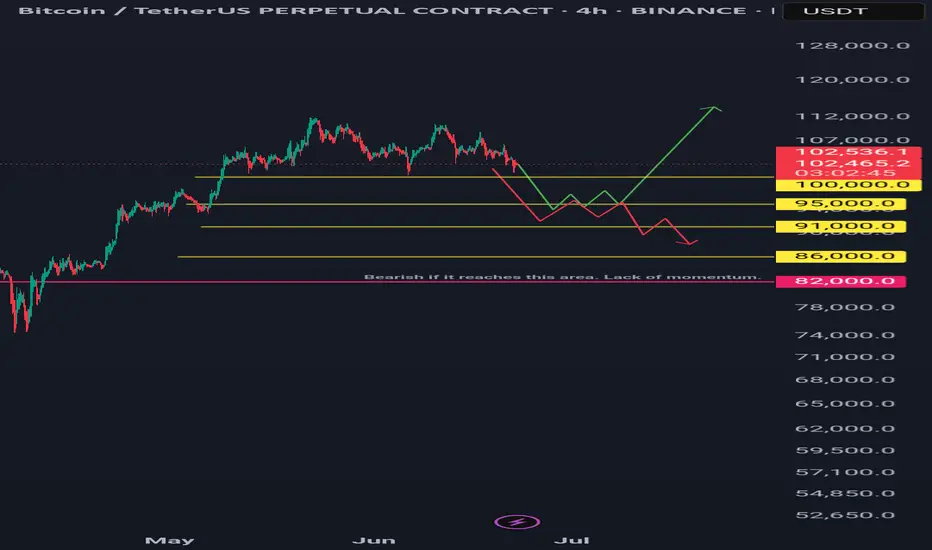
Btcusdt 4hr tf scenarios.Two scenarios: green and red lines.
Green Line: A bounce and sustained recovery above the 100-day and 200-day daily moving averages is bullish.
Red Line: A bounce followed by a lack of momentum and a break below a previous low is bearish.
Long Horizontal Red Line: If the price reaches this area, it could signal the start of a downtrend unless new bullish fundamentals emerge.
My Point of View (POV): I am bearish, primarily due to the ongoing war, similar to the conflict that began between two other countries a year ago.
However, it's important to note that every crisis and recession has historically presented a buying opportunity for institutions and 'whales.' Therefore, be prepared with funds for dollar-cost averaging (DCA), then simply hold and forget. It is recommended to conduct backtesting and research to identify optimal buying areas. DCA is key. Only invest money you can afford to lose.
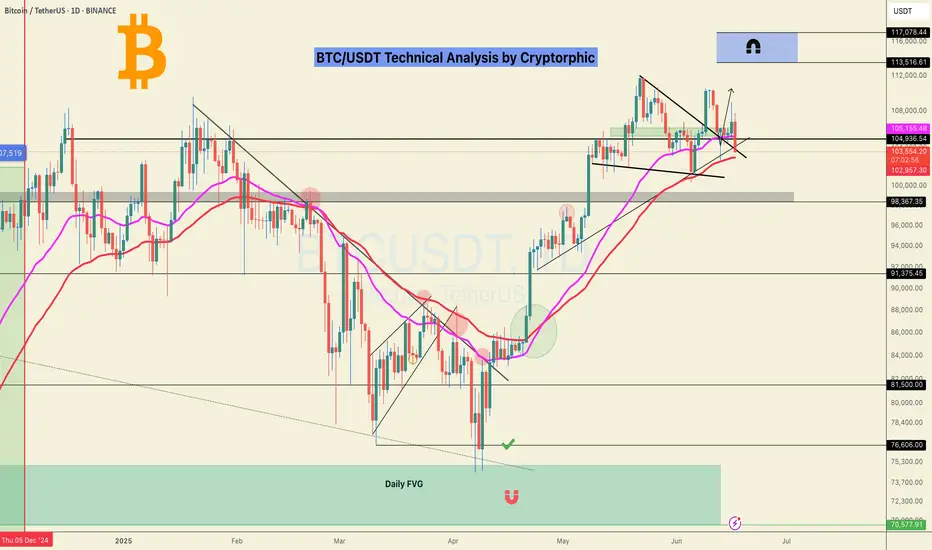
BTC Dips After ATH – $100K Support in Focus Amid TensionsBy analyzing the #Bitcoin chart on the weekly timeframe, we can see that after rallying to $111,980 and printing a new all-time high, price faced a correction down to $100,000.
Currently, Bitcoin is trading around $105,700, and with geopolitical tensions escalating, particularly the risk of war, we could see further downside — potentially taking price as low as $90,000.
However, if BTC manages to hold above the $100,000 level, there’s a strong chance we’ll see a short-term rally toward $120,000.
This analysis will be updated as the situation evolves. Stay tuned!
Please support me with your likes and comments to motivate me to share more analysis with you and share your opinion about the possible trend of this chart with me !
Best Regards , Arman Shaban

BTCUSDT Short Setup after Weak BreakoutThe BTCUSDT perpetual chart displays a bearish setup following a false breakout or weak retest of a descending wedge structure. After a strong bounce from the recent low, price surged but is now showing rejection at the $101,500 resistance level, marked by a key horizontal zone.
This area coincides with:
- The upper boundary of the falling wedge pattern.
- A former support zone now acting as resistance.
- A red candle signaling exhaustion from buyers.
A short position is initiated with:
- Entry: ~$101,500
- Stop Loss: ~$103,271
- Take Profit: ~$95,400
- Risk:Reward Ratio: ~1:3+
Unless price reclaims and holds above $103,271, this setup suggests a short-term bearish reversal is likely to unfold.

Today's BTC trading strategy, I hope it will be helpful to youToday, Bitcoin's price is like a ball caught between two forces, swaying around $103,300. On one side, the Fed just said "let's wait and see" (latest report states the impact of tariffs is uncertain, so no hurry to cut rates), putting a temporary brake on leveraged crypto speculators. On the other side, Middle East tensions are on a rollercoaster—Israel and Iran alternate between clashes and talks, but Iran's move to accept Bitcoin for oil purchases has put a floor under prices. Right now, the market feels like a spring compressed too far: $103,000 acts as a strong support (like a sofa cushion), while $107,000 looms as a ceiling, likely confining short-term moves to this range.
Recent Price Dynamics
The $103,000 level has emerged as a critical support zone, functioning like an "invisible mattress" for prices. During recent volatility, prices repeatedly rebounded when testing this level, indicating many investors view it as a relative low—willing to absorb selling pressure here. For example, on June 13, when Bitcoin fell due to Middle East tensions, it quickly bounced after hitting a low of $102,614, confirming the support at $103,000.
Today's BTC trading strategy, I hope it will be helpful to you
BTCUSDT BUY@102000~103000
SL:101000
TP:105000~106000

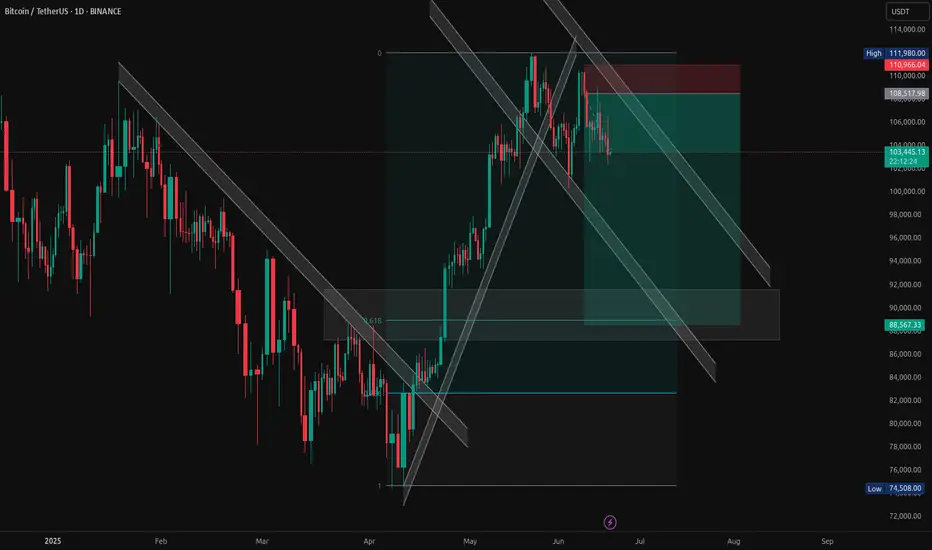
BTC/USDT – Bearish Channel Rejection with Confluence ZonesBitcoin is showing signs of weakness after rejecting the top of the descending parallel channel. This trade idea is based on multiple confluences:
Bearish rejection at key resistance near $110,000–$112,000
Price respecting the descending trendline
0.618 Fibonacci retracement zone acting as potential demand
Risk-reward structure targeting deeper support near $88,500
Previous bullish channel broken – now acting as resistance
📌 Entry near: ~$108517
🎯 Target: ~$88500
🛑 Stop Loss: ~$111980
Looking for further downside continuation if this structure holds. Watch how price reacts at mid-channel and the demand box.
The Pattern That Could Launch BitcoinSpotted a long-term inverted head & shoulders pattern forming over a 7–8 month stretch on Bitcoin — much more reliable than short-term setups. If this bullish structure plays out, we could be looking at a breakout that pushes BTC firmly into price discovery.
I’ve included local Fibonacci levels on the chart, though I couldn’t fit the macro one (going from $4k → $69k → $15k — the 1.618 extension of that larger swing lands at $119,800. That could be a key resistance target if we clear the ATH and continue the uptrend. After that, there's the smaller timeframe, but more recent, fib ext 1.618 sitting at $131k.
I'd be very cautious of a failed pattern if $101k doesn't hold. As a last support, 95k and the red 20EMA might hold.
Let’s see how this plays out 🚀

Checking the trend change after the volatility period
Hello, traders.
If you "Follow", you can always get the latest information quickly.
Have a nice day today.
-------------------------------------
(BTCUSDT 1D chart)
This volatility period is expected to last from June 21st to 23rd.
Therefore, it is necessary to check the trend formed after the volatility period.
The 99705.62 point is the HA-High indicator point of the 1W chart, so it is important to see if there is support near this point.
If it falls without support, it may fall to around 89294.25.
The 89294.25 point is the HA-Low indicator point of the 1D chart.
Since the M-Signal indicator of the 1W chart is rising to around 99705.62, the area around 99705.62 is likely to play an important role as support and resistance.
Even if it turns upward, it must rise above the HA-High indicator point of 108316.90 of the 1D chart to maintain the price.
If not, it is likely to fall again.
-
The fact that the HA-High indicator was created means that it fell from the high point range.
In other words, if it falls below the HA-HIgh indicator point, it is likely to start a downtrend.
However, since the HA-High indicator is an intermediate value, if it is supported near the HA-High indicator, it is possible to show a stepwise upward trend.
The end point of the high point is the DOM (60) indicator.
Therefore, it should be interpreted that it has risen above the high point section only if it rises above the 111696.21 point.
Therefore, depending on how the 108316.90-111696.21 section is broken upward, an upward trend can be predicted.
----------------------------------------------------------------------
There are auxiliary indicators OBV indicators made of Low Line ~ High Line channels and PVT-MACD oscillator indicators.
The OBV indicator made of Low Line ~ High Line channels is an indicator that can see how the channel is structured, and whether OBV falls below the Low Line of the channel or rises above the High Line.
Therefore, you can predict the future trend based on the channel pattern.
-
The PVT-MACD oscillator indicator is an indicator created by adding the Close value dash PVT value to the MACD formula.
Therefore, it shows a similar appearance to the MACD oscillator indicator.
The reason for looking at the PVT-MACD oscillator indicator is to find out how the trading volume flows.
There are many trading volume indicators, but I think this PVT-MACD oscillator indicator reflects the trading volume flow well.
-
However, you should look at the support and resistance points where the changes in the movement of the PVT-MACD oscillator indicator, the OBV indicator created by the Low Line ~ High Line channel, and the StochRSI indicator occur.
If the changes in these indicators occur near the DOM(-60), HA-Low, HA-High, and DOM(60) indicator points, it can be of great help in creating a trading strategy.
The DOM(-60) indicator indicates the end point of the low point.
That is, falling below the DOM(-60) indicator means that it has entered the low point range, and there is a high possibility that it will show a full-scale downtrend.
The fact that the HA-Low indicator was created means that it has left the low point range.
That is, if it rises above the HA-Low indicator, it means that there is a high possibility that an uptrend will begin.
However, since the HA-Low indicator is an intermediate value, if it encounters resistance and falls, it is possible that it will show a stepwise downtrend.
Therefore, whether there is support in the DOM(-60) ~ HA-Low range is important.
-
Currently, the OBV indicator created as the Low Line ~ High Line channel has fallen below the Low Line.
Therefore, we need to look at whether the Low Line ~ High Line channel will change to a downtrend channel in the future.
We need to look at whether an 'M'-shaped pattern indicating a trend change occurs.
Since the PVT-MACD oscillator indicator is still below the 0 point, it can be seen that the selling force is dominant.
However, since the oscillator is maintaining an upward trend, you can see that the overall selling pressure is decreasing.
Even so, since it is located near the HA-High indicator, the resistance in the HA-High ~ DOM(60) section is expected to be considerable.
-
Support and resistance points should be drawn on the 1M, 1W, and 1D charts.
This will increase accuracy.
However, since the standard time frame chart for all indicators is a 1D chart, it is most important to check the flow of the 1D chart.
-
You may think it is difficult because you have to look at multiple indicators at once.
The most important thing is to look at the movement when approaching the HA-Low or HA-High indicator.
The reason is that the basic trading strategy is to buy near the HA-Low indicator and sell near the HA-High indicator.
-
Thank you for reading to the end.
I hope you have a successful transaction.
--------------------------------------------------
- Here is a description of the big picture.
(3-year bull market, 1-year bear market pattern)
I will explain more details when the bear market starts.
------------------------------------------------------

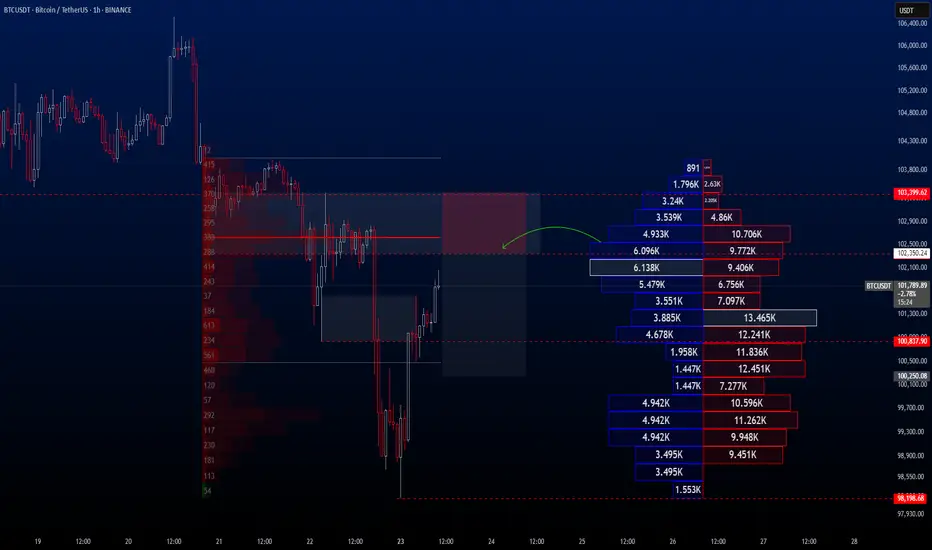
BTCUSDT Hello traders.
The BTCUSDT trade I shared the other day played out just as expected, with BTC experiencing a significant drop in value shortly after. The price fell all the way down to the 98K level.
Following this decline, I anticipate a short-term rebound toward the 102K–103K range, after which I expect the downtrend to resume. Therefore, I’ve placed a Sell Limit order at 102,350, and I’m currently waiting for the price to reach that level.
If you'd like, you can consider this opportunity in the same way.
🔍 Trade Details
✔️ Timeframe: 1-Hour
✔️ Risk-to-Reward Ratio: 1:2
✔️ Trade Direction: Sell Limit
✔️ Entry Price: 102,350.24
✔️ Take Profit: 100,250.08
✔️ Stop Loss: 103,399.62
🕒 If the trade doesn’t gain strong momentum, I will keep the position open only until 23:00 (UTC+4) today. Otherwise, I will manually close the trade—either in profit or at a loss—depending on price action.
🔔 Disclaimer: This is not financial advice. I’m simply sharing a trade I’ve taken based on my personal trading system, strictly for educational and illustrative purposes.
📌 Interested in a systematic, data-driven trading approach?
💡 Follow the page and turn on notifications to stay updated on future trade setups and advanced market insights.
BTC pressure, price under a lot of selling pressure💎 Update Plan BTC weekend (June 22)
Notable news about BTC:
Market overview: Bitcoin's consolidation lasts in the context of increasing macro instability
US President Donald Trump expressed his caution on Thursday when he delayed the decision involving a potential direct attack on Iran for a maximum of two weeks. The global market, including cryptocurrencies, has reacted, slightly increased in Asian and European sessions when investors absorb the impact of crude oil prices in the context of interrupted transport routes.
However, traders are very cautious, reflecting the tough stance of Fed President Jerome Powell on the economy, with the reason for the expectation of inflation in the short term due to tariffs.
Bitcoin -large holders continue to accumulate despite the cautious attitudes of traders on the spot and derivative markets.
Technical analysis angle
Bitcoin price fluctuates around $ 104.057 after cutting up the day from the peak of $ 106,457 of Friday. Main technical indicators, such as relative power index (RSI), strengthen the trend of discounts when the price slip down the average line 50.
Money Flow Index (MFI) indicator, monitoring the amount of money poured into BTC, shortening the trend of increasing, stable around the middle line. This reflects the limited interest in Bitcoin on both spot markets and derivative markets.
If the weakness of the Organizing Committee overshadows the demand on the chain and network activity, supporting the exponent dynamic line (EMA) 50 days at $ 103,169 can be helpful, temporarily absorbing the pressure of selling. Overcoming this level, high fluctuations can accelerate the decline, bringing the main levels, such as EMA 100 days at $ 99,085 and EMA 200 days at $ 93,404, in.
==> Comments for trend reference. Wishing investors successfully trading

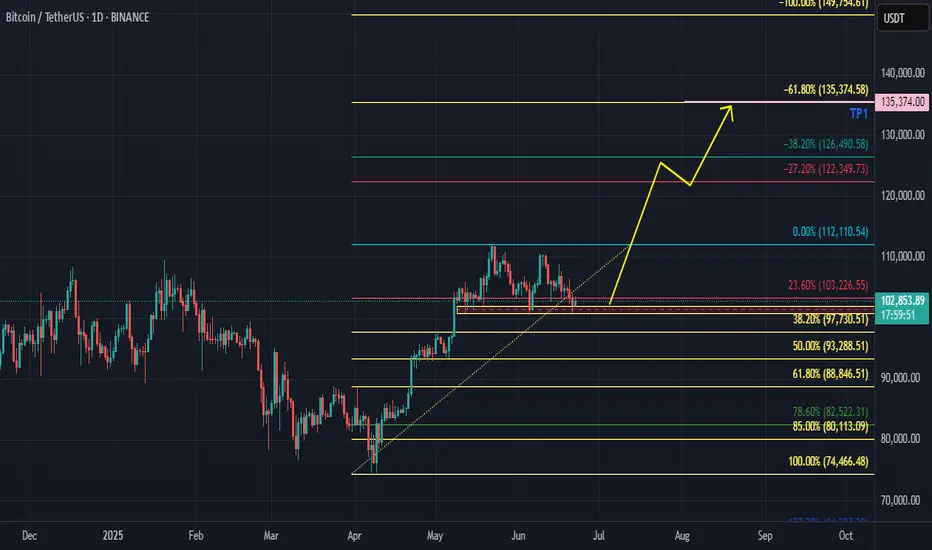
BTCUSDT Daily 22th JunI have drawn Fibonacci Retracement and specified TP 135k$. I think BTC would may bullish.
Bitcoin Under PressureBitcoin remains mired in a bearish trend as price action struggles below key moving averages—the 50-day, 100-day, and 200-day—all of which point to sustained downside pressure. On the higher timeframes, a clear descending trendline from the April–May highs remains firmly intact, reinforcing the macro downtrend.
The Relative Strength Index (RSI) continues to hover in the neutral-to-lower zones, with recent bounces still failing to cross bullish thresholds. A short-term relief rally emerged post-news volatility, with price attempting to retest the supply zone between $103.9K and $104K—a region of confluence with bearish Fibonacci levels and previous order blocks.
However, rejection at this level could set the stage for a further breakdown, targeting the $96.3K–$95.5K range. In the 1-hour and 4-hour timeframes, Fibonacci retracements and a climbing RSI suggest short-term relief is plausible, but a lower high formation would confirm continued bearish control.
BTC remains technically vulnerable despite short-term bounces, while geopolitical events and U.S. policy narratives shape market sentiment. Yet behind the volatility, continued ETF inflows, stablecoin stability, and altcoin resilience signal a market that, while cautious, remains fundamentally engaged.
Traders and investors alike should stay focused on key resistance levels for BTC, monitor developments in Middle Eastern tensions and U.S. crypto policy, and watch ETF and stablecoin flows as barometers of broader market conviction.

bitcoin btc shortshort entry :107.300 , STOP LOSS: 108.400 , PROFIT TARGET 101.000
RR 1:5 BINANCE:BTCUSDT.P

BTC MTF AccumulationThis is the current accumulation model i am watching to bring BTC back to ATH's and form the second deviation of the HTF distribution model. I would prefer if we could go lower and form a range from there, but at the moment thats all i got.

BTC black swan event is over, war fud ending, 220k-240k+ nextbuy spot , im betting more on Solana since i think SOL will outperform

We PREDICTED correction, and here is the NEXT step⚡️ Hello, everyone! As I said in my previous ideas, the correction is just beginning. Some people link this to the hostilities in the Middle East.
But, in reality, this is just a way to find a reason. In fact, the charts have long predicted a correction, which I have been actively talking about for the last month.
📊 Let's take a look at what lies ahead:
Having gathered liquidity below 100k, we are now seeing a short-term rebound. For me, the maximum target for this rebound is 106,000-107,000.
We have started to close the GAP at levels of 102,760 - 97,400. I expect it to close completely, after which we can move into a range. The next GAP is at levels of 93,280 - 85,230. So the further direction of movement is also obvious. After all, in 99% of cases, gaps close sooner or later.
⚙️ Metrics and indicators:
Money Flow - liquidity has been declining for more than half a year. This updated ATH was accompanied by a significantly smaller inflow of capital and formed a divergence. This means that there is still no new liquidity in Bitcoin, and for it to move higher, a new catalyst and cheaper prices are needed.
Liquidity Depth - as we know, the price tends to move from one liquidity zone to another. And now, there is significantly more liquidity at the bottom than at the top.
Dynamic Support/Resistance - Currently, 99,890 is a strong support level. However, each time we move lower below it. So I am confident that this level will be broken in the near future. The next major support level is 91,460.
Volume - is another indicator of the lack of new liquidity in Bitcoin. Since November 2024, purchase volumes have continued to decline!
📌 Conclusion:
I don't expect us to see Bitcoin at 60,000 before the fall. But 80,000 by September is quite possible. The fact that we will probably test the 90,000 level is not even up for discussion. Unless, of course, a new bullish catalyst appears. Altcoin ETFs are not even close to being one.
So, for now, I advise everyone to be patient and not try to predict the bottom. Prepare your bags for spot purchases, sit back in your chair, and enjoy the show!
🔥 Have a great week, everyone! 🔥

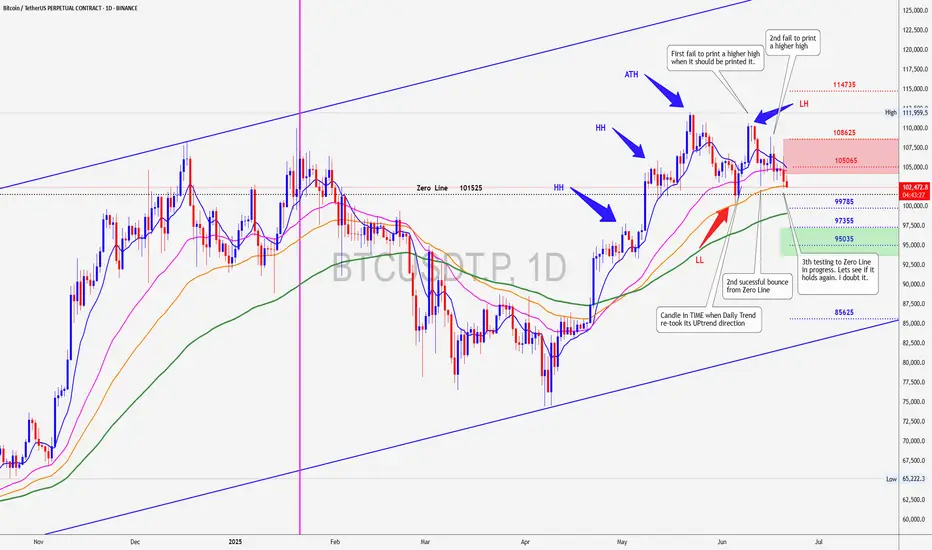
BITCOIN near a danger PointBitcoin has tested its Zero Line twice and bounce, it is said that third TIME is the charm but I think this TIME will be different so prepare for impact.
Perspective -- all basic indicators point DOWNI feel it's easy to get lost in what is happening NOW and forget what has happened OVERALL.
Zooming out to a weekly chart and using basic trading indicators, we can see where this is going.
Trading Volume: Low
Double Top: Confirmed
Elliot Pattern: Concluded
SMA50 & SMA100: Same setup as Dec 2021
Stochastic RSI: Turning bearish
First target: 92 - 93k range
Second target: 77 - 78k range
Third target: 33 - 34k range
I suspect a slight uptick at 93k, but not surprised if it breezes past this onto 78k.
Strange that anyone views this as a bulllish movement. This is a clear signal of a bearish market, and if altcoins follow then it'll be a full on crypto winter.

Short BTC. Next price to touch is 87 to 89KHi,
Market has broken down the structure. When market breaks its structure it continue to fall till the next structure shows its presence which comes under area of 89K.
DIY its for educational purpose.
Happy trading.

BTC MACRO PLAY - SHORT TRADE SETUP📉 BTC/USDT SHORT TRADE SETUP – WEEKLY TIMEFRAME
🔍 Trade Idea Overview:
We are seeing a bearish divergence between price and volume on the weekly chart — while price makes higher highs, volume is decreasing, signaling a potential reversal or weakening trend.
Further confluence is seen with the VMC Cipher indicator. If a red dot prints, it will confirm the short entry. If not, the trade idea should be abandoned.
📊 Trade Plan:
Entry Zone: Around $106,300–$107,000 (wait for confirmation)
TP 1 🎯: $102,000
TP 2 🎯: $97,500
TP 3 🎯: $93,000
🛑 Risk Management:
Stop-Loss: Above recent highs at $111,800 (or adjusted based on your entry)
⚠️ Disclaimer:
Once TP 1 is reached, move stop-loss to breakeven to protect capital and eliminate risk.
TP 3 may never be reached, but it remains part of the plan to capture extended downside if momentum continues.
If no red dot prints, there is no confirmation — be ready to abandon the trade.

DeGRAM | BTCUSD rebound from the demand zone📊 Technical Analysis
● The BTCUSDT 4-hour chart on KUCOIN highlights a pronounced descending channel, with price action recently rebounding from a well-defined demand zone between 98,000 and 100,000. This green-shaded area has repeatedly acted as a springboard for bullish reversals, as evidenced by the strong wick and immediate recovery after the latest test. The chart also marks a series of lower highs and lower lows, but the most recent price action shows a break in bearish momentum, with a projected zigzag path indicating a potential move toward the 104,970 resistance. The confluence of the lower channel boundary and the demand zone suggests that buyers are stepping in aggressively at these levels, aiming for a retest of the upper resistance band.
● The technical setup is further reinforced by the presence of a major resistance level at 111,977, which has capped previous rallies. The chart’s structure, with its clear trendlines and highlighted resistance and support zones, points to a tactical opportunity for bulls to capitalize on the oversold conditions. The anticipated path, as drawn on the chart, suggests a gradual recovery with intermittent pullbacks, targeting the 104,970 area as the next significant hurdle. The overall pattern indicates that while the broader trend remains bearish, the immediate outlook favors a corrective rally from the current demand zone.
💡 Fundamental Analysis
● Recent fundamentals support the technical case for a short-term recovery. Over the past two days, Bitcoin has experienced heightened volatility due to escalating geopolitical tensions, notably US military action in the Middle East, which triggered a sharp sell-off and flushed out leveraged positions. Despite this, institutional accumulation remains robust, with over $1.2 billion in Bitcoin added to corporate treasuries in the last week, and Texas officially establishing a state-managed Bitcoin reserve. On-chain data shows sustained negative netflows from exchanges, indicating that large holders are moving coins to cold storage, a historically bullish signal. Meanwhile, derivatives data reveals a cautious market, with open interest skewed toward protective puts, but spot ETF inflows and long-term adoption trends continue to underpin the market.
✨ Summary
● BTCUSDT is rebounding from a key demand zone, with technicals pointing to a corrective move toward 104,970. The bullish scenario is supported by strong institutional accumulation and strategic adoption, even as short-term volatility persists. A sustained close above 104,970 would open the path to the 111,977 resistance, while a drop below 98,000 would invalidate the recovery thesis.
-------------------
Share your opinion in the comments and support the idea with a like. Thanks for your support!

Bitcoin (BTC): Buyers Are Accumulating | Breakout Incoming?Buyers have finally shown dominance near the 200EMA, where now we are heading for for the resistance zone, which will be tested.
As we are entering the friday with that kind of buyside volume we might be seeing strong pump during the weekends so that's what we are looking for now.
Swallow Academy
