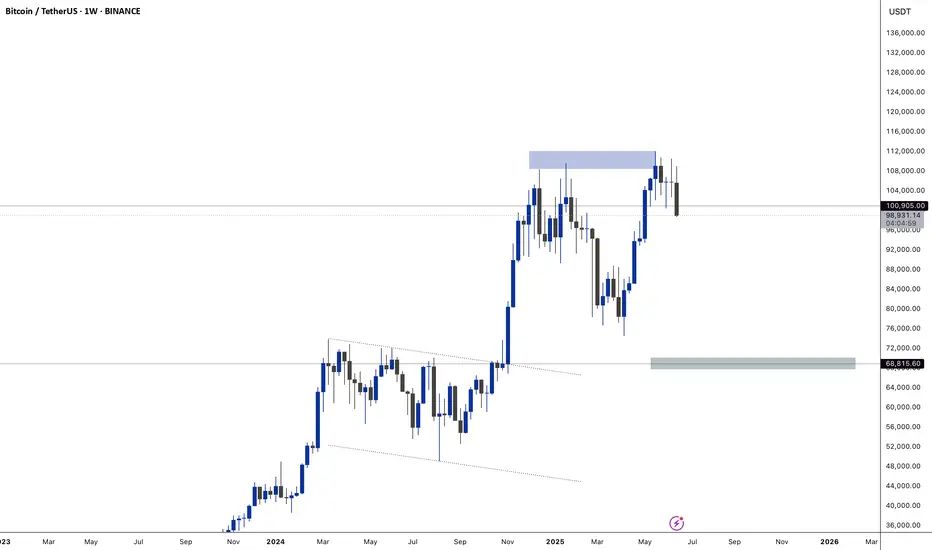
BTC Dips After ATH – $100K Support in Focus Amid TensionsBy analyzing the #Bitcoin chart on the weekly timeframe, we can see that after rallying to $111,980 and printing a new all-time high, price faced a correction down to $100,000.
Currently, Bitcoin is trading around $105,700, and with geopolitical tensions escalating, particularly the risk of war, we could see further downside — potentially taking price as low as $90,000.
However, if BTC manages to hold above the $100,000 level, there’s a strong chance we’ll see a short-term rally toward $120,000.
This analysis will be updated as the situation evolves. Stay tuned!
Please support me with your likes and comments to motivate me to share more analysis with you and share your opinion about the possible trend of this chart with me !
Best Regards , Arman Shaban
BTCUSDT.5L trade ideas

Little market update on btc 23/07/25. hope you enjoycheers just a quick one yo update people on my current thoughts on btc

Bitcoin (BTC): Buyers Are Accumulating | Breakout Incoming?Buyers have finally shown dominance near the 200EMA, where now we are heading for for the resistance zone, which will be tested.
As we are entering the friday with that kind of buyside volume we might be seeing strong pump during the weekends so that's what we are looking for now.
Swallow Academy

BTCUSDTHello traders. Wishing each of you a great weekend ahead!
Even though it's the weekend, I’ve spotted a sell opportunity on the BTCUSDT pair and decided to share it with you. However, we should also keep in mind that weekend markets tend to have lower volume. That said, I will still proceed with this trade based on my own risk parameters and trading strategy.
🔍 Trade Details
✔️ Timeframe: 30-Minute
✔️ Risk-to-Reward Ratio: 1:2
✔️ Trade Direction: Sell
✔️ Entry Price: 103815.32
✔️ Take Profit: 102640.12
✔️ Stop Loss: 104402.06
🕒 If the trade does not continue with strong momentum, I will keep the position open only until 23:00 today. Otherwise, I will close it either in profit or at a loss depending on the price action.
🔔 Disclaimer: This is not financial advice. I’m simply sharing a trade I’ve taken based on my personal trading system, strictly for educational and illustrative purposes.
📌 Interested in a systematic, data-driven trading approach?
💡 Follow the page and turn on notifications to stay updated on future trade setups and advanced market insights.

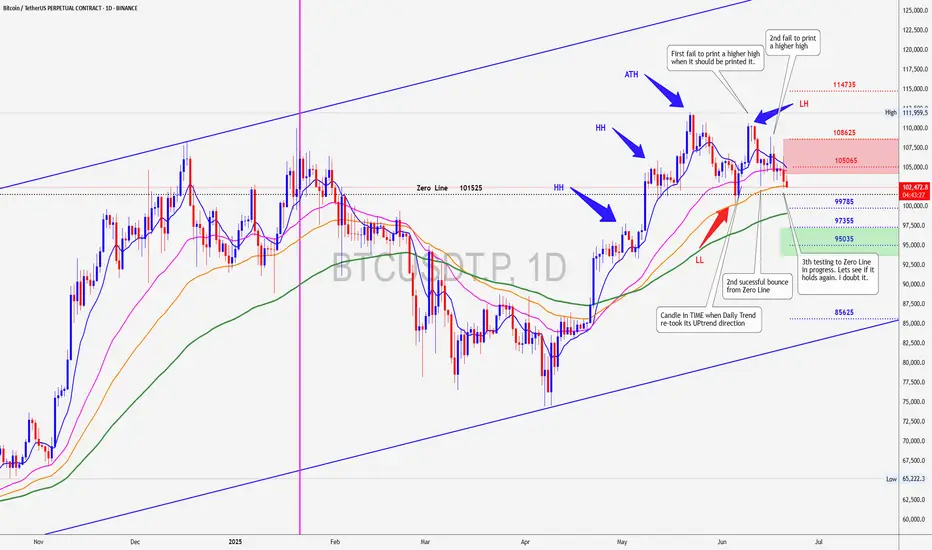
BITCOIN near a danger PointBitcoin has tested its Zero Line twice and bounce, it is said that third TIME is the charm but I think this TIME will be different so prepare for impact.
#Bitcoin is approaching a strong demand zone!#Bitcoin is approaching a strong demand zone!
This level has acted as solid support several times in the past.
According to the Fibonacci levels, we’re currently at the 0.5 level, which makes this area even more significant.
In my opinion, we’re likely to see a bounce from here.
However, if the price fails to hold this level, there’s a good chance we’ll retest the $92K zone.
But for that to happen, we need a daily close below $100K.
Until then, we’re still in a safe zone.
I’ll keep you updated as things develop.
If you find my updates helpful, don’t forget to like and follow for more!
DYOR, NFA

Pullback Correction after a Sharp DeclineTechnical Analysis of BTC Contracts: As of today, on the daily timeframe (major cycle), yesterday closed with a small bearish candle, showing consecutive bearish declines. The price remains below moving averages, and attached indicators are in a death cross, clearly indicating a downward trend. With the trend being evident, two key points should be noted: First, guard against significant pullback corrections; Second, risk control must be prioritized under any circumstances, which is of utmost importance.
On the hourly timeframe (short cycle), the price fell under pressure during the US session yesterday, breaking below the 100,000 level. It rebounded after hitting the intraday low in the morning. The breakdown level is near the 102,700 area. Currently, the K-line shows a large bullish rebound, and attached indicators form a golden cross, suggesting that corrective movements will prevail today. However, the breakdown level (102,700) must not be breached; otherwise, the corrective trend may fail to sustain, which aligns with typical price movement patterns.
you are currently struggling with losses,or are unsure which of the numerous trading strategies to follow,You have the option to join our VIP program. I will assist you and provide you with accurate trading signals, enabling you to navigate the financial markets with greater confidence and potentially achieve optimal trading results.
Trading Strategy:
sell@102300-102800
TP:100000-100500

$BTC - Short-term OutlookCRYPTOCAP:BTC | 4h
We got a solid bounce off 98k
Next key level is 103.5k–104k. A clean reclaim flips short-term bias bullish.
If price gets rejected again, this likely confirms a bearish retest, and likely leading back down to the 94k–92k value area
Price could range for awhile at this level as we challenge the 104k — prior value acting as resistance.

Your Edge Isn’t Just Technical, It’s PersonalMost traders obsess over their strategy: Which indicator? What session? What entry signal?
But very few stop to ask the question that could change everything: “Does this style actually fit who I am?”
The Truth Most Don’t Talk About
Trading success is not about copying someone else’s edge. It’s about discovering your own edge, and that begins with self-awareness .
And it hit deep because this is the part of trading psychology we often skip.
Some Real Talk
If you’re naturally calm and risk-averse, trying to scalp news spikes will drain you.
If you’re fast-thinking, decisive, and love volatility, swing trading might feel like watching paint dry.
If you thrive on rules and structure, discretionary trading might feel chaotic.
If you're intuitive and adaptive, being forced into mechanical rules may kill your edge.
You’re not underperforming because you lack discipline, you’re likely just misaligned.
What Changed for Me
I stopped trying to “be the trader” everyone said I should be. And I started trading like me.
I built a system that fits my mental rhythm.
I gave myself permission to simplify.
I became consistent not because of a new setup, but because I removed internal friction.
Final Thought:
Your best trades don’t just come from the chart. They come from a place of alignment, when your mindset, risk tolerance, and system flow together. So before chasing another strategy, ask yourself: “Is my trading style in tune with my personality?”

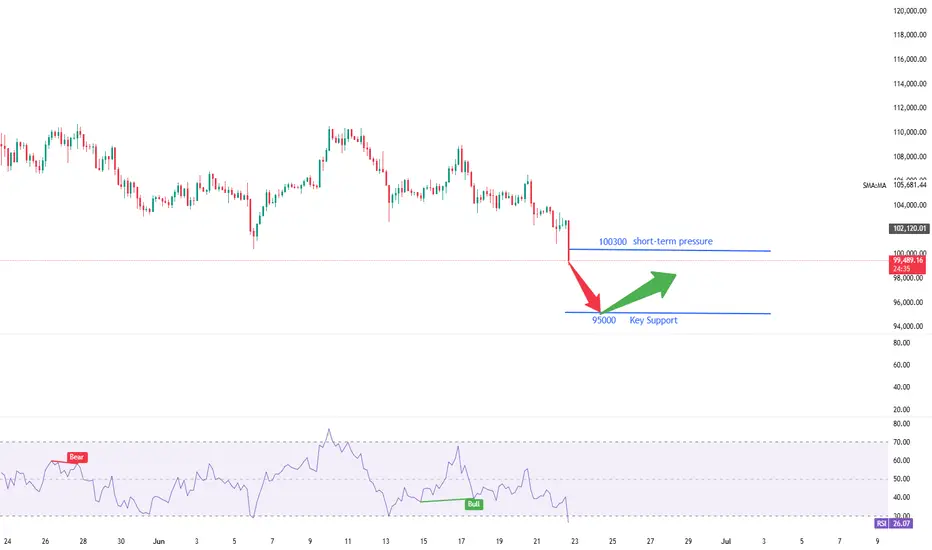
Need to wait for the key turning point.The Bitcoin market has currently broken below the key support level of 100,300, confirming a downward trend reversal. A daily-level recovery rally is now underway, and the 4-hour wave structure has not yet concluded. First, the downside target is seen at 95,000 to 98,000. Next week, the key turning point at 92,000 will likely determine the low of a rebound. Although this rebound low is not the ultimate bottom, it will trigger a relatively strong rebound after formation.
you are currently struggling with losses,or are unsure which of the numerous trading strategies to follow,You have the option to join our VIP program. I will assist you and provide you with accurate trading signals, enabling you to navigate the financial markets with greater confidence and potentially achieve optimal trading results.
Trading Strategy:
buy@95000-95500
TP:97500-98000
Squeeze Building in BTC – Targeting 100,500 ShortPrice is coiling between interest zones above and a heap of liquidity below. Expecting an impulsive break—looking to short down to ~100,500.

#BTC bearish cup-handle structure, beware of a pullback!📊#BTC bearish cup-handle structure, beware of a pullback!
🧠From a structural perspective, we broke below the neckline, which means a bearish structure is established, so we need to be wary of further declines.
➡️Yesterday's decline was rapid, so we can wait for a rebound to appear and look for shorting opportunities near the blue resistance area or the downward trend line.
➡️Since it is the weekend, the trading volume may be less. If there is no rebound, then we need to wait patiently for a period of sideways consolidation before looking for shorting opportunities.
⚠️Note that the area around 106500 is a support-resistance conversion zone. If it breaks through here and stabilizes, we can remain optimistic.
🤜If you like my analysis, please like 💖 and share 💬 BITGET:BTCUSDT.P

BITCOIN BEARISH SETUPBitcoin (BTC/USDT) – Breakdown from Double Top Confirms Bearish Trend Continuation
The 4-hour chart of BTC/USDT (Binance Perpetual Contracts) presents a textbook double top formation followed by a confirmed breakdown below structural support levels. The bearish trend has already met its first target, and technicals suggest the move could extend lower toward the key demand zone around $96,000.
🔍 Key Technical Highlights:
Double Top Pattern: Clear double top structure formed between $109,000–$110,000, followed by a strong rejection.
Support Break: Price broke down below key support at ~$105,000, triggering a sell-off and validating the bearish reversal.
Bearish Retest: After the breakdown, price retested the broken trendline (highlighted with a red zone) and failed to reclaim the range.
First Target Hit: Price achieved the first projected support zone at around $101,000.
Next Target: Based on measured move projection and previous structure, the next downside target lies near the $96,000 mark.
📉 Outlook:
The structure remains bearish as long as BTC trades below the broken support-turned-resistance zone (~$105,000). Momentum favors continued downside toward the next key zone unless a significant bullish reversal signal emerges.

BTC - Cup & Handle?BTC forming a cup and handle on the 1D chart which seems to be the main timeframe/narrative of play..

BTC is stuck in a tightening triangle — compression phaseVolatility building up into June 18–19.
Expect a big breakout.
Main scenario: breakout to the upside with a “God Candle” and new momentum for altcoins after prolonged BTC dominance.
Alts have been suppressed, but that’s part of the setup — don’t get tricked by the fake moves.
Stay patient, don’t lose focus, and be ready for a sharp move!

$btc/usdt short swing sh set upth:
sh htf liq + htf sh fib (1.136/1.272) + anti cypher harmonic pattern

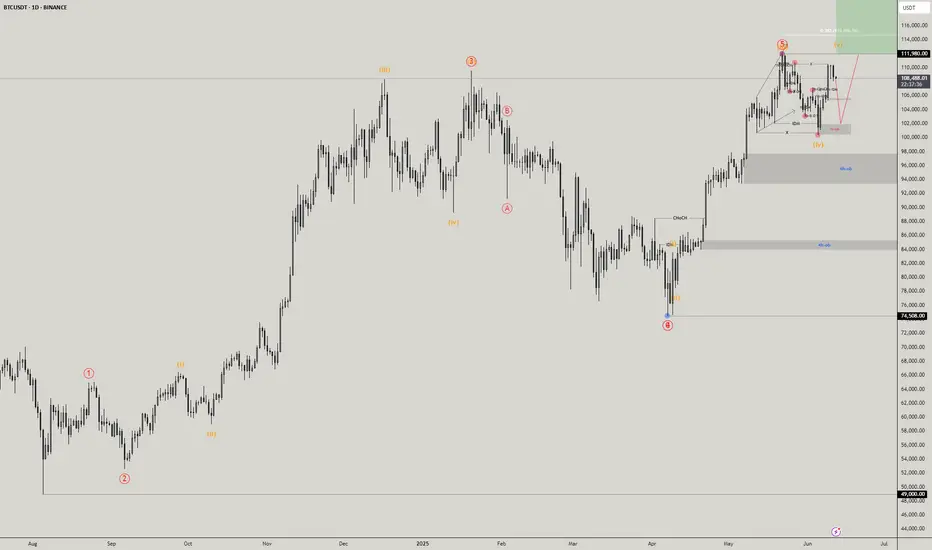
BTCUSDT Possible Sell BTCUSDT completed wave 4 of 5 and currently in wave 5 of 5 . wave 5 targets are on green and a possible sell is in place to finish wave 2 of 5 .
Good LUck
Is Bitcoin Signaling Risk-Off? Structure Breakdown Explained💥 BTC/USD Outlook – Is Bitcoin Losing Steam? 🧠📉
I'm keeping a close watch on Bitcoin (BTC/USD) this week, and the current price action is flashing some key signals.
🔍 Over the past several sessions, BTC has struggled to hold momentum, and we’re now seeing a shift in tone. On the 4-hour timeframe, the market structure is tilting bearish, with a pattern of lower highs and lower lows developing — a classic sign of weakness ⚠️📉.
📐 The most recent downside leg has caused a clear break in structure, and BTC is now retracing back into a potential supply zone, hovering around equilibrium of the recent move. This zone will be critical to watch for signs of seller re-entry.
⏳ On the 30-minute chart, I’m waiting for a decisive shift in structure — a break of local support or a failed rally that confirms bearish continuation. Should that play out, it could signal a high-probability short setup.
🪙 A breakdown in BTC often has broader implications — especially in the risk asset space. If we see weakness here, JPY pairs may strengthen as capital rotates into safer assets 💴🌐.
⚠️ Disclaimer:
This is not financial advice. The information provided is for educational purposes only. Please conduct your own analysis and consult a licensed professional before making any investment decisions. 📚💼

BTC is Bearish again?BTC 1W Overview
BTC is still trading above 100k despite the macro situation and ww3 situation in the Middle East , which is fine for the BTC maxis and institutions.
Weekly structure starting to shift in a bearish direction considering the weekly close below the structure and daily range is just a chop fest around the 104k area and so does the other assets getting chopped.
BTC.D is now over 1000 days uptrending and this is wild and not at all what many were expecting this point in the cycle.
Big concern on my mind is that what if BTC pulls back to the 90k area as I think may happen which I marked in the chart then altcoins will leg down another 20-30%.
Obviously everything is not about technical and the fundamental side is simply that there is an ongoing conflict in the middle East and the whole crypto market is waiting for a resolution one way or the other and crypto market lacks patience and even we do get the uncertainty then it still doesn't address the deeper market issues of altcoin weakness and continued dominance of BTC (BTC outperformed every single alt except MKR).
My best bet for LONG maxis will be around the 92k area Weekly FVG and Yearly Open, if we get more bad news from the middle East or Russia-ukraine or Sir powell comes with a bad news then this zone will be fast forwarded
And for short maxis or Beras my best bet will be S\R of 104k or monthly open is area to look for
All this planning will go down the drain if TRUMP comes with a good news regarding Tarrifs with china or other countries or any other news from the TRUMP because he's unpredictable
On the short time frame Scalps are possible on both sides and 100k is a psychological level to long but in bearish scenerio or war news will just wreck it
Final bias shifting Bearish
For alts instead of trying to long every dead cat bounce or predict the bottom we have to wait for it to happen and then react accordingly because reaction and execution is better than drawing predictions and getting chopped

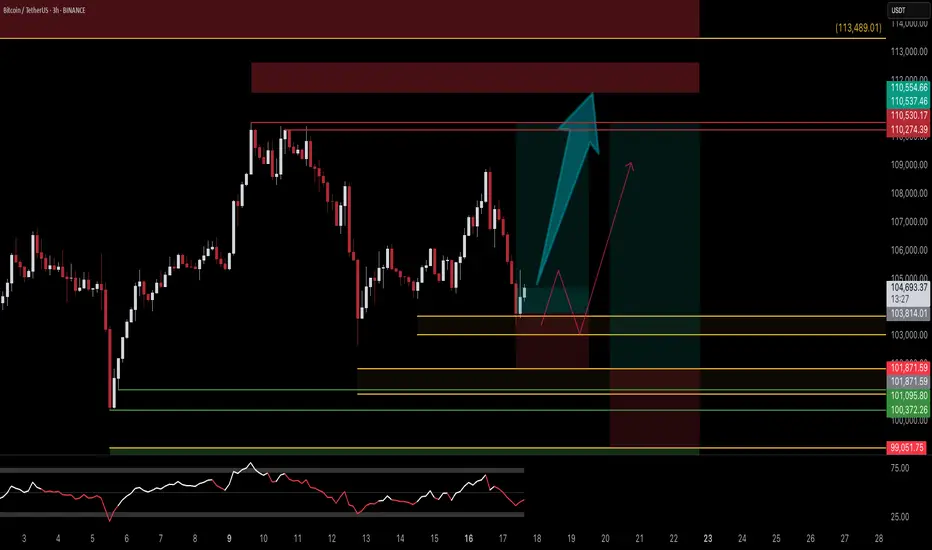
BTCUSDTBULLISH TREND
Major Zone = Yellow area
Can take entry on break of HH/
instant buy/
or any fib level 0.5 or 0.618
Sl is mentioned on the chart, you can adjust your tp's according to ur sl and entry.

Bitcoin | Long | 3hrsThis technical analysis is for informational and educational purposes only. It does not constitute financial advice. Remember to always research and consult with a professional before making investment decisions. Good luck! 📈💼🚀
Measured move target madePrice bounced near the target and has been confirmed by the 4 hour SAR.
The 4 hour SAR is currently on a bearish retrace relative to the daily SAR.
As long as the Daily SAR is above price, the bearish Wolfewave is still in play.
Price is anticipated to go lower than what the 4 hour SAR has established as support.
To see more details and for faster movement, we look to the shorter intervals.
Shorter interval price action could invalidate longer interval patterns.
