Today's BTC trading strategy, I hope it will be helpful to youBitcoin prices hovered around $103,300, retreating from the $104,000 threshold seen in previous days and showing an overall volatile adjustment trend. The market has experienced a notable correction recently, with prices dropping significantly from earlier highs, but currently stabilizing around $103,000. Such fluctuations have left many investors confused about the price trend ahead.
Support and Resistance Levels
Technically, Bitcoin is facing key support and resistance levels. The lower support at $102,300 is critical: if prices hold above this level, the short-term decline may halt or even rebound. However, a break below this support could lead to further declines to test lower levels.
The upper resistance lies in the $107,000–$108,000 range, acting as a "wall" where prices have repeatedly stalled due to trapped positions and profit-taking pressure. For prices to continue rising, a successful breakout of this resistance zone is essential.
Technical Indicator Performance
Multiple technical indicators show bearish dominance in the market. Both MACD and RSI indicators signal bearish sentiment, implying short-term weakness may persist. Notably, prices are approaching oversold territory—similar to a spring compressed too far, Bitcoin may experience a technical rebound if the decline continues.
Today's BTC trading strategy, I hope it will be helpful to you
BTCUSDT BUY@102000~103000
SL:101000
TP:105000~106000
BTCUSDT.5L trade ideas

Trade Plan Update #12: Navigating BTC’s Critical Levels
*Conflicting timeframes (bullish 1H/Daily vs. bearish 4H/Weekly) are causing choppy price action. Here’s my 2-step game plan: *
📈 Scenario 1: Bullish 1H Play
Key Support Zone: $100,314 - $102,000 (last line of defense for 1H bullish structure).
Trigger: A strong rejection + bullish reversal signal in this zone.
Action: INSTANT LONG ENTRY. No waiting—aggressively capitalize on momentum.
📉 Scenario 2: Daily Structure Fallback
If $100,314 fails:
1- First Demand Zone: $93,300 - $98,000
Watch for a strong bounce → Go long if momentum confirms.
Weak reaction? Hold and monitor lower.
Second Demand Zone: $84,000 - $88,000
Ideal reversal zone for resuming the bull run.
LONG on confirmed strength.
Bull Run Lifeline: $74,600
Non-negotiable: A daily close below this invalidates the bull trend.
✅ Key Reminders:
Patience is strategy: Only act when price confirms your thesis (no guessing!).
Risk first: Define stops for every entry.
Watch price action—NOT hopes.
👇 What’s your take?
Which scenario seems more likely?
Are you adding any key levels?
Let’s discuss below! 👀

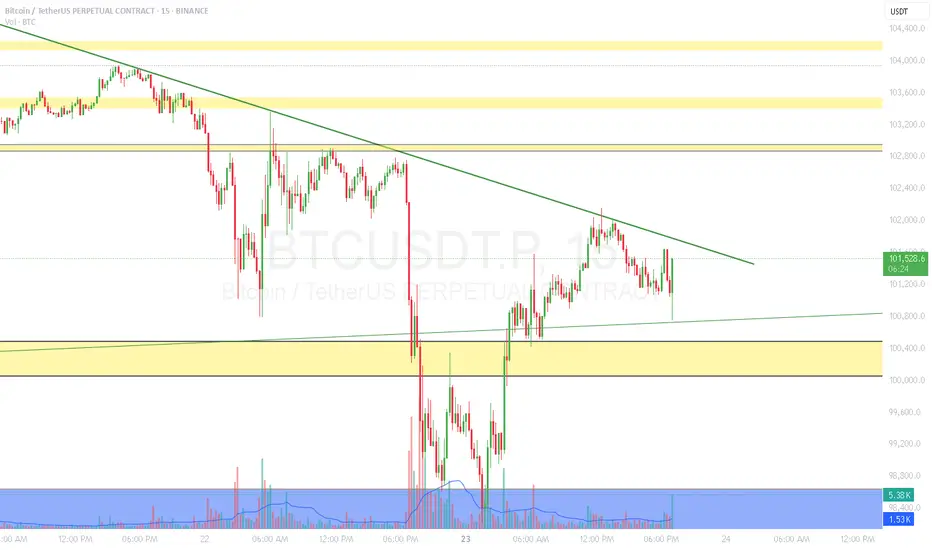
Bitcoin Short-Term 1H Timeframe, Next Target ConfirmedWe have two drops on this chart. The one of the left is more extended and long lasting compared to the one on the right. When a move is sudden with major force, it tends to end suddenly as well.
The recent drop was very steep and the force needed to keep pushing prices lower cannot be maintained, it requires too much energy; for this reason, a higher low is in place and the bulls win the game.
The action is happening above the blue line and space on the chart, this is the 0.618 Fib. retracement support. This is the most important level and so far it holds. Prices went below just to recover. Can be called a failed signal or a bear-trap, whichever you choose, the action is bullish above this level and bearish below.
Bitcoin's main support stands around $102,663, this level was not challenged. Since bears failed to push prices lower, the next logical move is a challenge of higher resistance. And the same pattern repeats, up and down, up and down... This is the short-term noise. When all is set and done, Bitcoin will resolve going up.
Patience is key.
Thank you for reading.
Thanks a lot for your continued support.
Namaste.

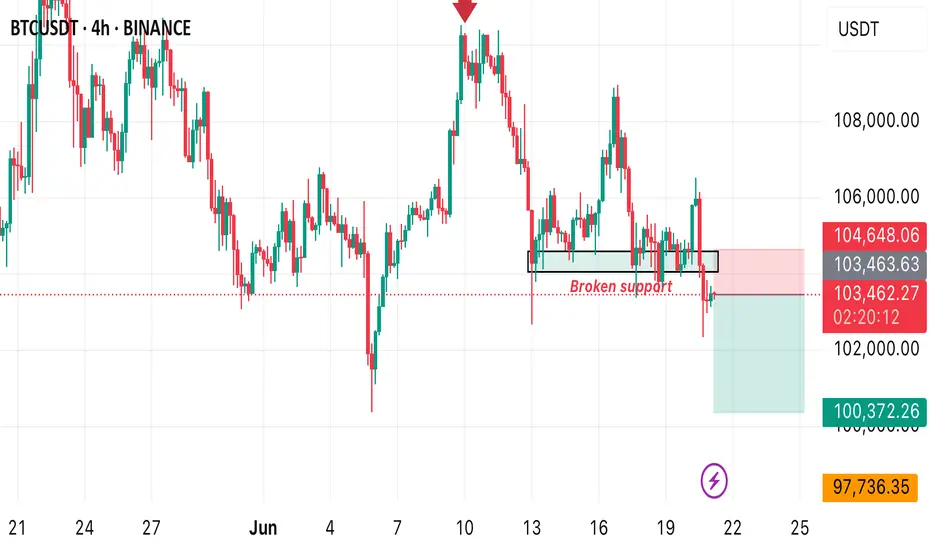
BTCUSD TO FALLBACK TO $100kFrom the technical perspective, btcusd seems quite bearish from the H4 perspective. We recently saw a continuous printing of lower highs therefore we expect a formation of new low around the $100,400 price level. A sell opportunity is envisaged.
Bitcoin Crash To $93k Incoming?!!!!I am discussing the bearish signs i am seeing right now on Bitcoin, and talking about the confirmations I want to see, that will confirm that Bitcoin is about to crash down to 93k!!!

Bitcoin– bearish momentum builds after rejection at $109KIntroduction
Bitcoin (BTC) is currently showing weakness after forming a lower high at $109,000. This level acted as a significant point of rejection, and since then, BTC has been moving lower. The price has broken through key support areas, indicating a possible shift in market structure. In this analysis, we’ll break down the recent price action, explain the technical signals behind the move, and discuss what could be expected in the short term.
Rejection from the 0.786 Fibonacci Level
The rejection at the $109,000 level aligns perfectly with the 0.786 Fibonacci retracement on the 4-hour timeframe. This level is often seen as a strong resistance point during corrective moves, and in this case, it held firmly. The precision of this rejection gives it more weight, and since hitting that point, BTC has been steadily declining. This move down suggests that buyers were unable to push through the resistance, leading to increased selling pressure.
Break of the 4H Bullish FVG
As BTC started its decline from $109,000, it broke through the bullish Fair Value Gap (FVG) that had formed earlier on the 4-hour chart. This gap previously served as a support zone but has now been decisively broken with strong volume. The loss of this level is significant, as it marks a breakdown of the bullish structure and opens the door for further downside movement. In the process of this move lower, BTC has created a new bearish FVG on the 4-hour timeframe. This gap remains open and could potentially act as a magnet for price to revisit, offering a possible short entry if price retraces into that zone. However, the clear break below the previous bullish FVG indicates a shift in momentum and supports a more bearish bias for now.
Downside Target at $102.7K
Given the recent breakdown, the next key level to watch is around $102,700. This area marks the wick low on the 4-hour timeframe and stands out due to the size and sharpness of the wick. Such large wicks often leave behind unfilled orders, which markets tend to revisit over time. The presence of these resting orders makes this level a likely target for the ongoing move down. It also acts as a strong area of potential support, where buyers might step back in if the price reaches that point.
Conclusion
With the rejection from the 0.786 Fibonacci level and the failure to hold the bullish 4H FVG, BTC has shown clear signs of weakness. The breakdown in structure suggests a continuation to the downside is likely, with $102.7k being the most immediate target. This level could serve as a strong support zone due to the unfilled orders left behind by the previous wick. Until BTC reclaims key support levels or shows a shift in momentum, the bias remains bearish in the short term, and traders should remain cautious while expecting further downside.
Thanks for your support.
- Make sure to follow me so you don't miss out on the next analysis!
- Drop a like and leave a comment!

bitcoin update btc struggling to hold the 100k position market is choppy in lower tf but on higher tf its clearly shows sign of tapping below. with a double top on 3d tf, and breaking down of it will push long term holder book profits and with increasing tension in iran and usa 90k looks good support and as i mentioned previously about the cme gap in that area which works asa magnet for btc.
thanks
BTC H4 Range Play: Patience Until One Side Breaks✅ Price contracting within well-defined H4 range
✅ Clear lower highs and higher lows — coiled, ready to break either side
⚠️ FOMC incoming — possible volatility/surprise rate cut rumors
🎯 Trading Plan:
Short Setup:
If price spikes RH ($105,500) and H4 FVG (~$106,000), then re-accepts back inside the range
Entry on confirmation back below RH/FVG
Target: RL ($103,300) and $102,600
Stop: Above $106,300
Long Setup:
If RL ($103,300) or $102,600 gets swept then reclaimed (M15/H1 SFP or strong reclaim)
Entry on confirmation reclaim of RL/W
Target: RH ($105,500) and beyond
Stop: Below $102,200
🔔 Triggers & Confirmations:
Only enter trades on confirmed sweeps/reclaims or acceptance back inside after spike
No trade if price stays in chop between levels
📝 Order Placement & Management:
Sell Limit: $105,500–$106,000
🛡️ Stop: $106,300
🎯 Target: $103,300 / $102,600
Buy Limit (on sweep/reclaim): $102,600
🛡️ Stop: $102,200
🎯 Target: $105,500 / $106,000
🚨 Risk Warning:
Market coiled — can rinse either side
FOMC could be a catalyst; manage risk, don’t overtrade

Next Volatility Period: Around June 22
Hello, traders.
If you "Follow", you can always get new information quickly.
Have a nice day today.
-------------------------------------
(BTCUSDT 1M chart)
The morning star candle that we often heard about when studying candles appeared.
However, since the candle has not closed yet, the shape of the candle may change.
In stock charts, there were cases where the movement could be predicted with the shape of these candles, but in the coin market, it is impossible to predict.
The reason is that trading is possible 24 hours a day.
Most candle shapes occur with gaps, allowing for a comprehensive interpretation, but in the coin market, gaps are not likely to occur, so I think there is nothing that can be known from the shape of the candles.
Therefore, it is recommended not to try to analyze the chart with the actual shape or pattern of the candles.
However, you need to study to be able to read the arrangement of the candles in order to set support and resistance points.
Even this is not difficult to indicate support and resistance points because there are indicators that indicate support and resistance points.
-
(1W chart)
The 104463.99 point is the DOM (60) indicator point, which corresponds to the end of the high point.
Also, the 99705.62 point is the HA-High indicator point, which corresponds to the middle of the high points.
Therefore, the 99705.62-104463.99 section can be interpreted as the high point boundary section.
The actual trend is likely to occur while falling from 99705.62.
The importance of the 99705.62 point is increasing because the M-Signal indicator on the 1W chart is rising near the HA-High indicator point.
If it falls below the M-Signal indicator on the 1W chart, it is possible that the trend will be determined again when it meets the M-Signal indicator on the 1M chart.
Also, if it falls from the HA-High indicator, it can meet the HA-Low indicator.
Therefore, if the price starts to fall, you should check whether the HA-Low indicator is generated.
The fact that the HA-Low indicator was created means that it rose from the low range.
That is, just as the HA-High indicator corresponds to the midpoint of the highs, the HA-Low indicator corresponds to the midpoint of the lows.
The end point of the lows corresponds to the DOM(-60) indicator point.
-
(1D chart)
For this reason, it is important to see support around 104463.99-106133.74.
The trend is likely to appear after the next volatility period, around June 22nd (June 21st-23rd).
Therefore, we should consider the 104463.99-106133.74 range as the middle range,
- and see if it falls below 99705.62,
- or rises above 108316.90.
Accordingly, we should create a response strategy and be prepared not to panic when a trend appears.
-
The OBV is currently below the Low Line.
Therefore, if it does not receive support at the 104463.99 point, it is likely to fall again.
Since the OBV oscillator is still below the 0 point, we can see that the selling pressure is strong.
However, looking at the overall movement of the oscillator, we can see that the selling pressure is decreasing.
Therefore, if there is another decline, the key issue is whether there is support near 99705.62.
-
In summary, the area around 104463.99 is playing an important role as support and resistance.
Therefore, after the next volatility period, around June 22, we need to check and respond to the direction in which it deviates from the 99705.62-108316.90 range.
-
Thank you for reading to the end.
I hope you have a successful trade.
--------------------------------------------------
- This is an explanation of the big picture.
(3-year bull market, 1-year bear market pattern)
I will explain more details when the bear market starts.
------------------------------------------------------

Perspective -- all basic indicators point DOWNI feel it's easy to get lost in what is happening NOW and forget what has happened OVERALL.
Zooming out to a weekly chart and using basic trading indicators, we can see where this is going.
Trading Volume: Low
Double Top: Confirmed
Elliot Pattern: Concluded
SMA50 & SMA100: Same setup as Dec 2021
Stochastic RSI: Turning bearish
First target: 92 - 93k range
Second target: 77 - 78k range
Third target: 33 - 34k range
I suspect a slight uptick at 93k, but not surprised if it breezes past this onto 78k.
Strange that anyone views this as a bulllish movement. This is a clear signal of a bearish market, and if altcoins follow then it'll be a full on crypto winter.

Bitcoin Still Bullish Above $93K — Don’t Trade with Emotion🟢 Bitcoin Still Bullish Above $93K — Don’t Trade with Emotion
I still believe Bitcoin is in a bullish trend as long as it holds above $93,000. The recent drop seems mostly driven by external factors and geopolitical uncertainty. If Iran responds to the U.S. or closes the Strait of Hormuz, there’s a strong chance this short-term downtrend could continue.
But here’s the key: don’t trade emotionally. If you’ve bought spot positions and your stop-loss was hit, it’s okay to exit. You can always re-enter later when conditions improve. The most important part is to trust your analysis and the stop you originally set.
As for futures, I’m personally not trading right now — the market is too reactive to headlines. However, I’ve noticed BTC outflows from exchanges have increased, which is often a bullish long-term sign. This means the price can recover just as fast once fear subsides.
📉 In uncertain times, patience is a strategy too — sometimes watching is better than chasing trades.
---
💬 What’s your take on Bitcoin during this geopolitical mess? Let me know in the comments — I’d love to hear your thoughts. 👇

USA bombs IRAN - Bitcoin Falling!Operation Midnight Hammer was a major U.S. military strike carried out on June 21, 2025, targeting three of Iran’s key nuclear facilities: Fordow, Natanz, and Isfahan.
The operation involved seven B-2 Spirit bombers, each flying an 18-hour mission from Missouri, supported by over 125 aircraft, including refueling planes, fighter escorts, and surveillance assets.
To maintain the element of surprise, the U.S. used deception tactics, such as sending decoy aircraft westward over the Pacific while the actual strike force flew east toward Iran with minimal communications.
The bombers dropped Massive Ordnance Penetrators (MOPs)—30,000-pound bunker-busting bombs—on the fortified nuclear sites. Cruise missiles launched from a U.S. submarine struck additional infrastructure targets.
The Pentagon described the mission as the largest B-2 operational strike in U.S. history and the first known combat use of the MOP. Officials emphasized that the operation was aimed solely at nuclear infrastructure and not at Iranian civilians or military personnel

BTC/USDT Technical Analysis, 2025-06-20 19:45 UTCBTC/USDT Technical Analysis, 2025-06-20 19:45 UTC
💡 Trade Setup Summary
Pattern Detected: Bullish Hammer at local bottom
Confirmed by bullish candle close above pattern high
Volume Confirmation:
Volume Flow Analysis → Increasing OBV
Current Volume = 5.17, which although lower than the short-term mean, is paired with a positive trend
Order Book & Whale Confirmation:
Whale Bids > 2 BTC detected: 1 order, 3.54 BTC
Order Book Imbalance: 36.84% favoring buyers
Technical Indicators :
✅ Oversold region confirmed (likely RSI < 30, inferred by engine)
✅ Bullish pattern with volume trend confirmation
✅ Order book imbalance > 2%
✅ Whale bid presence
✅ Market pressure shows buyer dominance
✅ OBV increasing
Entry Price: 103146.58
Target (TP): 105646.58
Stop Loss (SL): 102146.58
Risk:Reward Ratio: ~2.5:1

BITCOIN BEARISH SETUPTechnical Analysis Summary:
Pattern Formation: The chart shows a descending triangle pattern with double tops, indicating bearish pressure at resistance levels.
Breakdown Confirmation: Price has broken below a key ascending trendline (shown in dashed line) and retested the breakdown area, forming a bearish rejection (highlighted red zone).
Key Zone: The price is currently trading around $105,075, just under the previous support-turned-resistance zone (~$106,000). This confirms a failed bullish structure and strengthens the bearish outlook.
Targets:
First Target: Around $101,000–102,000, aligning with the next visible support zone.
Second Target: Around $97,000–98,000, which is a major support / key zone based on prior structure.
Bias: Bearish in the short term, as long as price remains below the $106,000 resistance zone.
Trade Setup Outlook:
A short position is implied by the arrows.
Best entries are around retests near $105,500–106,000 with stops above the recent highs (~$107,000).
Conservative profit-taking at the first target, with extended TP near the key support zone.

bitcoin update as reacted market is now at a key support level of 101k.
market will now might give a dead cat bounce till 104-105k max, a scalp long can be taken with cautious, one bad news and that ded cat bounce will die with the market.
stay safe everyone.

Bitcoin StructureBTCUSDT — day
Now we clearly respect the supply zones . The price has already beaten off the zone twice, and there is no desire to go higher yet.
Also by structure:
There was an explicit Break of Structure, then Market Structure Shift (MSS) - impulse change
Below in the region of 93k - the discount zone, where there is a large liquidity (according to calculations - stops by about 17 billion)
→ Continuation of the rollback down
→ Liquidity collection from 93k
→ And only after that a possible turn up
❗️So far, I'm only looking for shorts from the offer zones - on junior TF, with confirmation on 4H.

Today's BTC trading strategy, I hope it will be helpful to you Analysis of Market Dynamics Under Geopolitical Conflicts
The current conflict between Iran and Israel has entered a critical phase of "reciprocal retaliation". In the early morning of June 22, Iran launched missile strikes on Israel, targeting military command centers and nuclear R&D facilities in Tel Aviv, while Israel carried out multiple rounds of airstrikes on missile bases in western Iran. This high-intensity mutual bombardment has broken the "limited retaliation" pattern of previous regional conflicts. Iranian Supreme Leader Ayatollah Ali Khamenei explicitly stated the intention to "completely destroy the Israeli regime", indicating a real risk of further escalation.
The U.S. stance in this conflict has become a key variable. While President Trump said it "may take two weeks to decide whether to join the war", he also emphasized that "it's hard to ask Israel to stop attacks", an ambiguous stance that has intensified market uncertainty. Notably, Iran has ruled out the possibility of nuclear talks during the conflict, and the breakdown of diplomatic channels has made military confrontation the only option—this could lead to geopolitical risk premiums persisting in asset pricing.
Historical experience shows that Bitcoin's performance in geopolitical conflicts features "short-term volatility, medium-term divergence". During the Iran-Israel conflict in April 2024, Bitcoin plunged 7% within an hour, but it rose 5% against the trend after the U.S. airstrike on Iran in 2020. The current market's uniqueness lies in that Trump signaled "possible military action" before the conflict, giving the market a digestion period—thus, Bitcoin only fell 4.5% after the conflict broke out on June 13, showing stronger resilience than in 2024. However, if the U.S. officially enters the war, it may trigger panic selling similar to the early stage of the 2022 Russia-Ukraine conflict, which requires high vigilance.
Bitcoin's current price of $102,500 is facing a dual test of geopolitical conflict and technical resistance. The reciprocal retaliation between Iran and Israel has not ended, and whether the U.S.参战 (enters the war) will determine the direction of market sentiment. Technically, whether the $103,000 resistance level is broken will guide short-term trends. Investors need to distinguish between short-term emotional shocks and long-term trend forces—geopolitical conflicts may cause short-term volatility, but the de-dollarization trend and the stability of institutional holdings provide long-term support for Bitcoin.
In terms of operations, it is recommended to adopt a strategy of "light-position trial + flexible hedging": do not blindly chase breakouts, nor ignore pullback buying opportunities. Remember: in the fog of geopolitics, real opportunities often lie at the intersection of market panic and rationality, and risk control is always the first principle of investment.
Today's BTC trading strategy, I hope it will be helpful to you
BTCUSDT BUY@101000~102000
SL:99500
TP:103000~104000

btc 150/160 kSeveral key factors contributed to Bitcoin’s dramatic rise to $150,000:
Institutional Adoption: Major financial institutions, hedge funds, and even governments have started to invest in Bitcoin, seeing it as a hedge against inflation and economic instability.
Limited Supply: With only 21 million bitcoins that will ever exist, scarcity plays a major role in driving up demand and price.
Geopolitical Instability: As traditional currencies face pressure from inflation and political uncertainty, investors turn to decentralized alternatives like Bitcoin.
Public Trust and Awareness: Widespread education and acceptance of cryptocurrencies have led to more retail investors entering the market.

BTC HTF TA- Going as planned.
- Nothing changed
- Prepare for the worst liquidation event where every retail traders are net long in crypto based on their fantasies, hopes and dreams. X has been toxicating them with the ideas of US gov. or US iBank will make them rich.

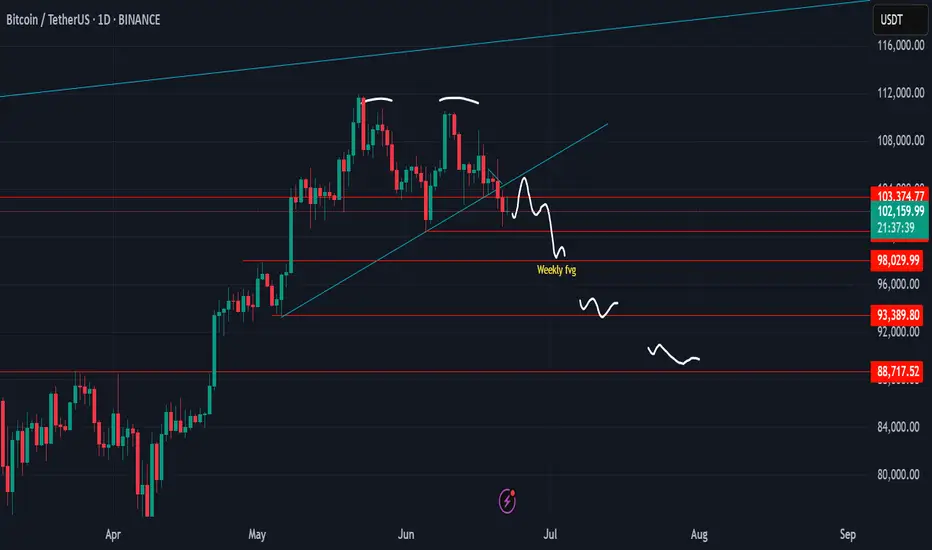
Bitcoin, everyday dump dayNow, we can see everyday is dump day till several days
After success breakout trendling and support, then can't back above the lines
Reasonable target is mini pump to retest then dump to 98k, 98k level is support and weekly open fvg
But if 98k break we will see 93k, and if 93k break we will see final of double top target around 88k and altcoin will rug hard again
But if Bitcoin can go back above 108k, maybe this scenario will be invalid
$BTC Breaks Key Support – Bearish Signal Bitcoin has lost the CRYPTOCAP:BTC Breaks Key Support – Bearish Signal
Bitcoin has lost the critical 50 EMA on the daily chart, which has historically acted as a strong support level. This breakdown mirrors the 2021 double top structure and is now hinting at a deeper correction.
🔸 Key Support Zone at $100,000:
Losing this zone increases downside risk. If $100K fails to hold, next visible supports are at $96K and $91K, aligning with past consolidation zones.
🔸 Risk Level at $104,500:
A daily close back above $104.5K would invalidate this bearish view and indicate strength recovery.
🔸 Outlook:
Wait for further confirmation below $100K for potential short setups. Avoid long entries until clear reversal signs appear.

Today's BTC trading strategy, I hope it will be helpful to youWhen Bitcoin prices dip to $101,900—despite the prevailing bearish sentiment—a rational long-position strategy can still be formulated by weighing long-term investment value against potential short-term rebound opportunities. The analysis below covers entry timing, position management, and risk control.
I. Entry Timing Judgment
(1) Technical Signals
Monitor price performance around $101,900. Potential long entry signals include:
1. **Confirmation of bottom patterns**: When prices consolidate near this level to form double bottoms, triple bottoms, or other base structures, and the trading volume during the second/third retest is notably lower than previous attempts—indicating weakening selling pressure. For example, if a double bottom forms near $101,900 with 30% less volume in the second retest than the first, this signals a preliminary entry point.
2. **Technical indicator crossovers**: Track metrics like the Relative Strength Index (RSI) and Moving Averages (MA). A long signal strengthens when:
- RSI breaks above 50 from oversold territory (below 30).
- The 5-day MA crosses above the 10-day MA (golden cross).
- Price breaks through short-term resistance (e.g., $102,500) alongside moderate volume expansion.
(2) News Catalysts
Macro events and industry trends are critical for timing:
1. **Fed dovish signals**: Clues of earlier rate cuts or reduced hiking expectations—boosting market liquidity and benefiting Bitcoin. Align such news with technical signals to enhance long-position reliability.
2. **Cryptocurrency sector tailwinds**: Developments like progress on U.S. stablecoin legislation, relaxed global regulatory policies, or breakthroughs in real-world adoption (e.g., more enterprises accepting Bitcoin payments, higher settlement ratios) can reignite value reassessment. If prices stabilize near $101,900 amid such news, consider entering long positions.
Today's BTC trading strategy, I hope it will be helpful to you
BTCUSDT BUY@102000~103000
SL:101000
TP:105000~106000

BTC
BTC is currently in local consolidation. After a liquidity grab on either side, potential entry setups may form via the AMD pattern — but only if key conditions are met.
No setup — no trade. Wait for confirmation.
