TradeCityPro | Bitcoin Daily Analysis #119👋 Welcome to TradeCity Pro!
Let’s go over the analysis of Bitcoin and the key crypto indexes. As usual, in this analysis I’m going to review the futures triggers for the New York session.
⏳ 1-Hour Timeframe
Yesterday, the price broke out of the range box between 108619 and 110256 that I had marked for you, and with the heavy selling volume that entered the market, this bearish move took place.
✔️ This move continued to the 107448 zone, and as you can see, we are now in a consolidation and rest phase, and once again the volume has dropped significantly.
✨ As I mentioned in yesterday’s analysis, I believe this low volume will persist through the weekend, and for a solid move to happen, we’ll need to wait for the new week to begin.
💥 For now, the price has room to move up to 108619 and perform a retracement. A break above the 50 zone on the RSI greatly increases the likelihood of this move.
📊 If selling volume re-enters the market and the price moves downward, the short trigger we have is the 107448 level, and breaking it could start the next bearish leg.
📈 For a long position, the price must first stabilize above 108619, and then, if we see that buying volume continues and increases, we can enter a long position. The main trigger will be 110256.
⭐ I myself won’t be opening any positions for now and will wait until the market shows some proper volume and trend before entering. If you plan to open a position based on these triggers, I suggest you take on very little risk so that in case your stop-loss is hit, you don’t lose much money.
👑 BTC.D Analysis
Let’s look at Bitcoin dominance. Yesterday, dominance touched the trendline I had marked and is still dealing with this dynamic resistance.
💫 A bottom has formed at 65.38. If this bottom is broken, we’ll get confirmation of rejection from the trendline, and dominance could have a bearish move down to 65.04.
⚡️ If the trendline is broken instead, we’ll have a new trigger at 65.52, and breaking it would confirm a bullish reversal in dominance. The main trigger will still be a break of 65.64.
📅 Total2 Analysis
Now let’s move on to Total2. This index dropped to the 1.13 zone and has now pulled back to 1.14. It seems like it’s getting ready for another downward move.
☘️ If Bitcoin dominance gets rejected from the trendline and moves down, and if Bitcoin moves upward, Total2 could make a very sharp move.
🔑 Even if Bitcoin drops, Total2 might range or even move up. For now, our short trigger is 1.13, and aside from 1.14, we don’t have any specific long trigger.
📅 USDT.D Analysis
Finally, let’s look at Tether dominance. This index made a bullish move to 4.85 after breaking 4.78 and is now in a corrective phase.
📊 If 4.85 is broken, the next bullish leg could continue up to 4.93. If a correction happens, dominance might pull back to 4.78.
❌ Disclaimer ❌
Trading futures is highly risky and dangerous. If you're not an expert, these triggers may not be suitable for you. You should first learn risk and capital management. You can also use the educational content from this channel.
Finally, these triggers reflect my personal opinions on price action, and the market may move completely against this analysis. So, do your own research before opening any position.
BTCUSDT.5L trade ideas

Final move by the bears? Bulls lining up for ATHHi traders and investors!
Buyers have reached the first target at 108,952.
On Binance spot, BTC missed the second target (110,530.17) by just 99 cents.
Is this a setup for a breakout and a run toward a new ATH?
So far, the price action looks like a level manipulation around 108,952: volume in all 3 bars interacting with this level is concentrated above it.
Just below lies a buyer zone (107,500 – 105,100).
I am watching for buyer reaction once the price reaches this area.
This analysis is based on the Initiative Analysis concept (IA).
Wishing you profitable trades!

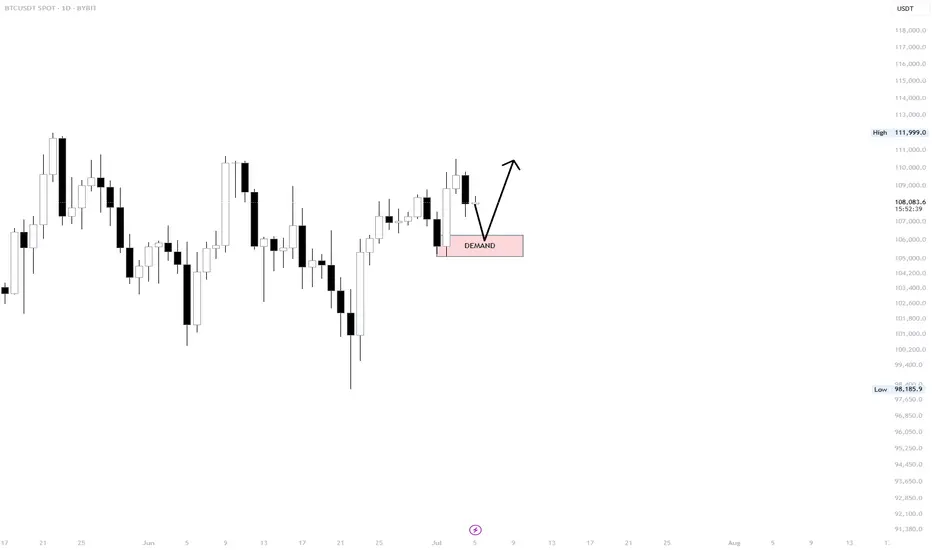
BTC/USDT BYBIT IDEA #1 – Daily Demand Zone Setup
We have an bullish OB with imbalance on Daily, 6 HOUR REFIMNET with some stoplosses underneath 107 200. If we do not hold local LTF -15M- 1H range I would be favoring this setup.
Otherwise I am already in position and already took two TPs.
Setup Thesis:
If price tags the demand zone (highlighted in pink) and holds, we could see a continuation toward recent highs. The setup favors a reactive long entry from this zone, as long as buyers defend the area with conviction.
Key Factors:
Demand zone: High probability support area
Clean structure: HL-HH continuation in play
Market strength remains intact above this zone
Plan:
Wait for reaction at demand
Long on confirmation (rejection candle, reclaim, or strong 4H close)
Invalidation below the zone lows
Can #BTC reach a new high?📊Can #BTC reach a new high?
🧠We cannot be too optimistic before we break through ATH, because the daily adjustment expectation still exists.
➡️We are currently in a heavy resistance area near 110,000. This is our third test. Regardless of whether we can successfully break through, don’t chase the rise here, because the cost-effectiveness is not high. If you want to go long, you should also wait patiently for the callback to occur before considering it. Or wait for the callback after breaking through ATH before considering it.
➡️If you want to participate in short trading, you can only participate in a small amount with ATH as a defensive point. Or wait for the rebound after breaking through the upward trend support line before participating.
🤜If you like my analysis, please like 💖 and share 💬
BITGET:BTCUSDT.P

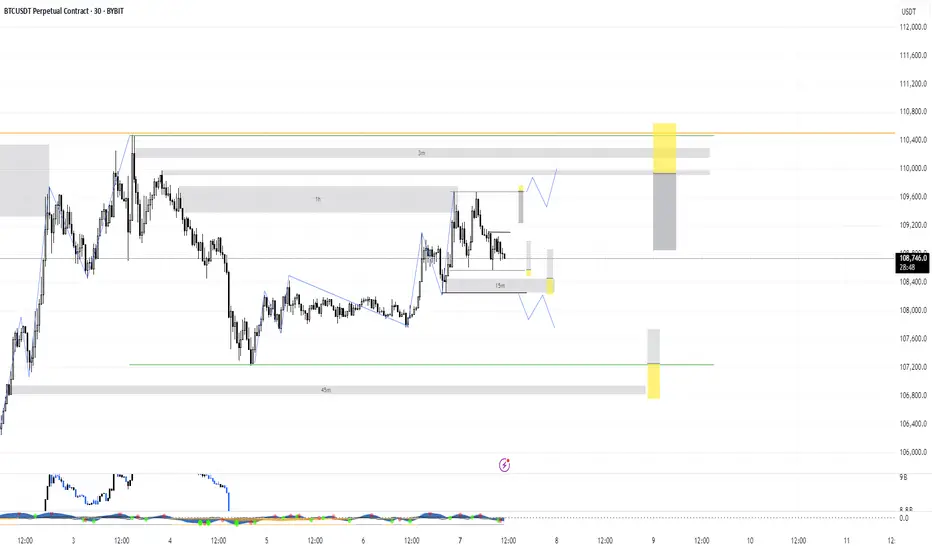
BTCUSDT | 30-min & 4H Outlook🔍 Structure & Price Action
BTC is trading within a rising wedge (blue lines) nearing apex — typical bearish setup.
Price is repeatedly getting rejected near macro trendline (~108.8K–109K).
30-min shows clean breakdown from lower wedge support, retesting the zone now.
On 4H, BTC is still under key resistance zone between 109.6K–110.4K, previously rejected twice.
🔻 Bearish Signals
Multiple Sell signals on both timeframes.
Bearish divergence visible in RSI and MACD on 4H.
Volume spike on the breakdown → confirming sellers in control.
🔑 Key Levels
Support: 107.7K (current zone) → loss opens path to 106.6K, then 104.4K.
Resistance: 108.9K–109.4K = confluence of EMA cluster + macro TL + Fib zone.
📊 Indicators (4H)
RSI dropping from mid-zone (~48), no bullish momentum
DMI shows increasing ADX with -DI over +DI → trend strengthening bearish
TSI & Wave Trend both curling down
Stochastic in overbought, starting to reverse
🎯 Summary
Bias: Bearish below 108.6K
Invalidation: Bullish breakout above 109.6K + volume close
Setup: Watch for retest and rejection at ~108.4K–108.6K = clean short trigger
Next Targets: 107.2K → 106.6K → 104.5K

Monday - Trade of the day Hello I took a week off from trading — life got a bit hectic 🌀. Looking back, I actually needed that break from the charts 🧠💆♂️.
But we’re back this week! Let’s see how many X’s we can cream off the market 💸🔥
Here are the immediate levels I’m watching 👀 — mainly some range deviations from both internal and external ranges.
If we break either side of the range, I’ll be looking to enter from the last supply or demand zone for a continuation 🚀📉📈
That said, I’ll stay mindful of any supply and demand zones that could get in the way ⚠️📊
Let’s get it 💪📅
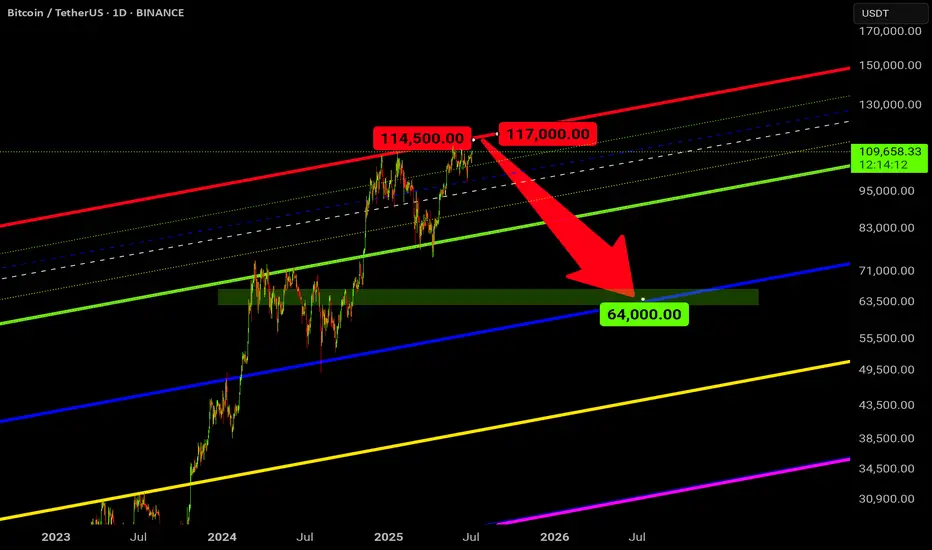
BTC Sell ShortThis is how I see Bitcoin in a year's time : the beginning of a bear market and the end of a bull market .
"BTC Pumps from $108,850 to $109,900 – What's Next?"Bitcoin has shown strong bullish momentum, rising from $108,850 to $109,900 in a short time. This move signals renewed buying interest in the market and suggests that Bitcoin may be preparing for a breakout above the $110,000 level.
Analysts believe this move is driven by whale accumulation, positive global sentiment around crypto regulations, and technical indicators pointing to a breakout. If BTC holds above $109,900, the next targets could be $110K and $112K.
Stay alert — the bulls might be back!

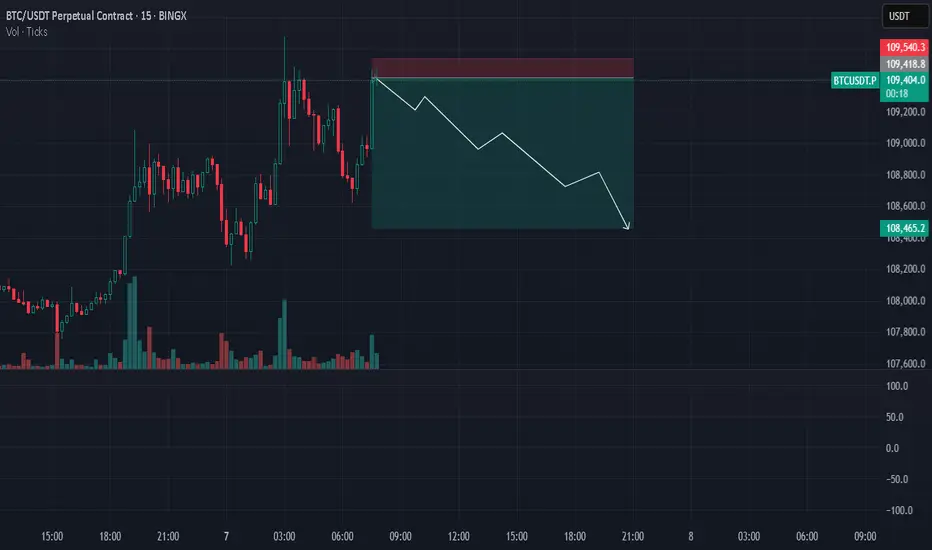
BTC - Fly High or Just Nuke down?As depicted earlier in the earlier drawing, 109,850 and now little bit more push to fall it down!

BTC - 4H chart - $105k KEY ZONE, up or we try again7/4
1. As long as price finds support above 105k, the structure remains to go up, breaking the bull flag to ATH.
2. Below 105k, bottom bull flag for support

BITCOINBITCOIN , continues to see in flow of liquidity ,investors confidence is high ,institutional adoption could change the layer of demand and supply and set a new bench mark for trading highs and low trading on intraday.
feels good to see that my correction video came 100% correct, now the confirmation will be if 108.03-107.89k will hold support. This is a classic retest to broken 4hr descending trendline ,if we adopt it ,then we buying into 111k-113k-116k watch it critically.
On a second thought if price adopt the new structure we are selling in 100k-90k and below.
trading is logical probability ,keep that in mind that every key level can be broken, manage your risk, back test on your strategy and make sure you are winning.
there are many ways to win this market without big grammar.
have a blessed new week.

Long IdeaI'm seeing a possible bullish cypher pattern forming for the mini blow off top for btc. This mimics the SPX500 and currently in lagging state. Ater that, it will go back around 50k - 60k area, probably to eliminate saylor out before going to the 240k - 280k region..

BITCOINBITCOIN , continues to see in flow of liquidity ,investors confidence is high ,institutional adoption could change the layer of demand and supply and set a new bench mark for trading highs and low trading on intraday.
feels good to see that my correction video came 100% correct, now the confirmation will be if 108.03-107.89k will hold support. This is a classic retest to broken 4hr descending trendline ,if we adopt it ,then 111k-113k-116k will be watched.
on a second thought if price adopt the new structure we are selling in 100k-90k and below.
trading is logical probability ,keep that in mind that every key level can be broken, manage your risk, back test on your strategy and make sure you are winning.
there are many ways to win this market without big grammar.
have a blessed new week.

$BTC/USDT daily chart $121K next.CRYPTOCAP:BTC just broke out of a descending wedge on the daily chart, a strong bullish signal.
It’s now holding well above key support and the 50-day moving average, showing buyers are in control.
If BTC stays above $106,400, we could see a move toward $121K next.
DYRO, NFA

BTC — Major Resistance & Long TP Zone1. TP longs in red resistance zone (110k–111k)
2. Watch for rejection: possible short setup on bearish reaction
3. Key support at 105k — monitor for bounce
4. If price holds above red zone, scenario invalid — look for breakout

BITCOINBITCOIN ,we are seeing some liquidity and a break of our 4hr supply roof ,if we return to retest in the same zone 108k-107.99k , we might take long position .first target 111k 113k and 116k.
take profit is key, trading is logical probability. If you dont take profit and secure it, the market will turn back and take both your capital and profit because its probability.

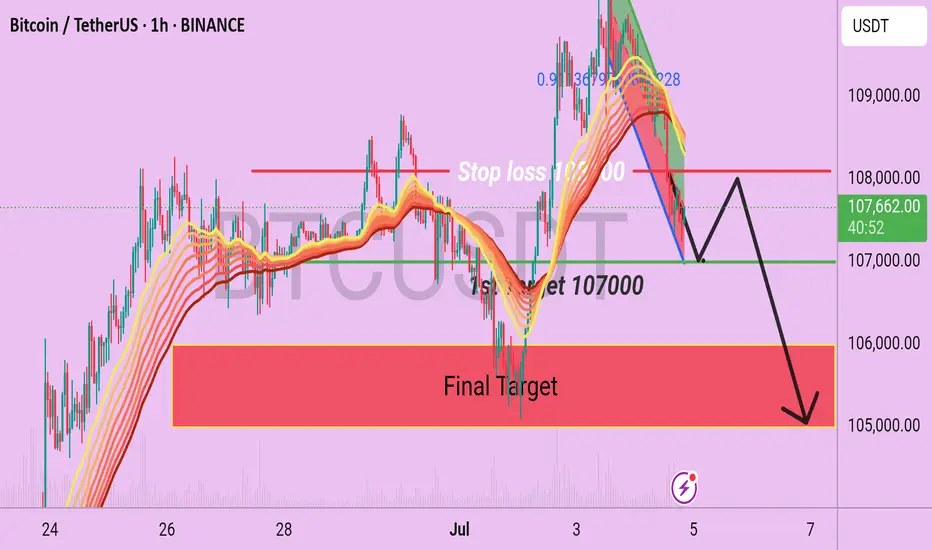
BTC/USDT H1 Chart Out look Bitcoin is Now running at near the 107500 and following a short term Bearish pattern on EMA 50 and 200 by using that we can consider on sell side with the given Targets like 107000 which is near the Bitcoin is consolidating and the Final target support is 106000/105000.
Bearish Scenario
1st Target is 107000 ( from here it may make some retest)
2nd Target is 106000( main target).
3rd Target is 105000.
Use stop loss at 108100.
BITCOINBITCOIN ,the structure broke back out of the descending trendline on 4hr ,be patient if it comes for retest go long and hope that 110-111k is broken and target 116k-118k.

TradeCityPro | Bitcoin Daily Analysis #120👋 Welcome to TradeCity Pro!
Let’s dive into the Bitcoin analysis and key crypto indices. As usual, in this analysis I want to review the futures triggers for the New York session.
⏳ 1-Hour Timeframe
In the 1-hour timeframe, as you can see, Bitcoin has finally broken out of the range it formed yesterday and is now moving upward.
✔️ If this upward move continues, we can open a long position in these zones by getting confirmation in the lower timeframes. The main long trigger is still activated after breaking 110256.
💥 The RSI oscillator entered the Overbuy zone in the previous candle. We need to see how the price reacts to this move and what impact this oscillator will have on the price.
⚡️ In my opinion, this RSI move won't have much impact. Although the price is moving upward, the main trend has not yet formed, so there's no real momentum in the market, and RSI is basically useless for now.
✨ If this upward move turns out to be fake, we can enter a short position with the 107853 trigger.
👑 BTC.D Analysis
Let’s look at Bitcoin Dominance. Yesterday, dominance had an upward move and broke its ascending trendline but failed to stabilize above 65.52, resulting in a fake breakout and a move downward.
☘️ The fake breakout trigger for the trendline was the 65.38 zone, which was activated, and now the price is heading downward. If this move continues, the next target will be 65.04.
📅 Total2 Analysis
Alongside Bitcoin’s upward move, this index also activated the 1.14 trigger and is moving up, now reaching 1.15.
💫 If the move continues, the next entry trigger is at 1.17, which is still quite far from the current price.
📅 USDT.D Analysis
Looking at Tether Dominance, the 4.82 trigger was activated, and dominance is now moving down, having reached 4.78.
📈 If it stabilizes below 4.78, we can confirm the continuation of the downtrend in dominance, which could push it down to 4.72.
❌ Disclaimer ❌
Trading futures is highly risky and dangerous. If you're not an expert, these triggers may not be suitable for you. You should first learn risk and capital management. You can also use the educational content from this channel.
Finally, these triggers reflect my personal opinions on price action, and the market may move completely against this analysis. So, do your own research before opening any position.

BTC - LONG UPDATEI'm taking profit on the long here, nice weekend pump.
For me low 109s is the inflection point, I rather take profit here and start the week fresh.
See previous BTC post for a more zoomed out version and higher timeframe levels, nothing has changed.

Bitcoin (BTC) 4H Chart – May see new ATH SOON !!Bitcoin is currently moving tightly within a broad symmetrical wedge structure. Despite multiple fakeouts and low-conviction moves, the price has managed to stay range-bound and is holding above key support, a sign of underlying strength.
Chart Structure:
Price has broken out of the downtrend resistance but is yet to confirm momentum.
The structure suggests a larger move is imminent, with bulls gradually gaining control.
Key Levels:
Immediate Resistance: $108,700
Major Resistances Ahead: $111,862 → $116,818 → $122,341
Immediate Support: $105,189
Major Support Below: $97,205
Potential Setup:
A confirmed breakout above $108,700 with volume could initiate a rally toward the next resistance zones.
Bulls must hold the $105,000 area to avoid another deep pullback into the lower structure.
Bias:
Cautiously bullish — market is waiting for a catalyst to trigger follow-through.
Stay patient, and watch for confirmation through price and volume.
DYOR. Not financial advice.

BTC - Are you the one who is long?If yes! Book, Looks like a LIQ hump trap here! Wait for 105k smooth, or let it fall to retrace up to 109,860 to initiate!
